. 2020 Jul 2;7(3):e134.
doi: 10.14440/jbm.2020.327. eCollection 2020.

A 2D and 3D melanogenesis model with human primary cells induced by tyrosine

Affiliations

A 2D and 3D melanogenesis model with human primary cells induced by tyrosine

Maryana S Branquinho et al. J Biol Methods. .

Abstract

Research on melanogenesis, its regulation in health and disease, and the discovery of new molecules with pigmenting and depigmenting activities use different models. Here we standardize a protocol based on previous ones using primary human melanocytes and keratinocytes in co-cultures, in which melanogenesis was induced under mild conditions by the addition of tyrosine plus ammonium chloride (NH4Cl). The expression of MITF, TYR, TYRP1, and Melan-A as well as melanin content were measured. Furthermore, we extended this study to a reconstructed 3D model. Pigmentation was visually observable and melanosomes were identified by Fontana-Masson staining by the addition of tyrosine plus NH4Cl during the stratification phase. The 2D and 3D protocols proposed here circumvent limitations of previous models, using human primary cells and mild conditions for melanogenesis. These protocols offer a viable, robust, simple, and animal-free investigational option for human skin pigmentation studies and screening tests for new compounds that modulate pigmentation.

Keywords: co-culture; keratinocyte; melanin; melanocyte; pigmentation.


Conflict of interest statement

Competing interests: The authors have declared that no competing interests exist.

Figures
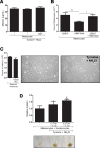
Figure 1.
Figure 1.
The melanogenesis model using melanocytes plus keratinocytes. A. Melanin content (μg/ml) in melanocytes treated or not with tyrosine (0.25 mM) + NH4Cl (5 mM) in the presence and absence of KGF (20 ng/ml) in 254CF medium for 5 d (n = 6). B. Melanocytes count after 5 d in 254CF, KGM Gold, or 1:1 254CF:KGM Gold medium (n = 3). C. Melanocytes + keratinocytes count and microscopy (40x) in co-culture stimulated with tyrosine (0.25 mM) + NH4Cl (5 mM) for 5 d (n = 6). D. Melanin content in melanocytes plus keratinocytes cocultures (2.5 × 10⁵ cells each) in presence of tyrosine (0.1 and 0.25 mM) and NH4Cl (2 and 5 mM) after 5 d and pellets aspect for each condition (n = 6). *P < 0.05, **P < 0.01, and ***P < 0.001 compared with the control. #P < 0.05 compared with the condition of lowest concentration.
Figure 2.
Figure 2.
Gene expression of melanogenesis markers. Gene expression of MITF (A), TYR (B), TYRP1 (C), and Melan-A (D) in melanocytes plus keratinocytes co-cultures (2.5 × 10⁵ cells each) stimulated with tyrosine (0.25 mM) and NH4Cl (5 mM) for 8 h, 24 h, and 5 d (n = 6). GAPDH was used as the reaction calibrator. Comparative method (2-ΔΔCT) was used to analyze the levels of mRNA expression. The white bars refer to the control, and the black bars refer to conditions stimulated with tyrosine plus NH4Cl. ***P < 0.001.
Figure 3.
Figure 3.
Protein expression of TYR and melanin content over time in melanocytes plus keratinocytes co-culture (2.5 × 10⁵ cells each) stimulated with tyrosine (0.25 mM) and NH4Cl (5 mM) for 8, 24, 48 and 72 h. A. Relative melanin content from 8 h to 5 d (n = 6). B. Relative intensity of TYR bands and representative western blot. The endogenous antibody used was anti-vinculin (n = 4). The white bars refer to the control, and the black bars refer to the conditions stimulated with tyrosine plus NH4Cl. ***P < 0.001.
Figure 4.
Figure 4.
3D skin model treated with tyrosine (0.25 mM) + NH4Cl (5 mM). Pigmentation was analyzed macroscopically and on histological sections stained with Fontana-Masson. The arrows indicate the melanin granules in the basal layer of the epidermis.

References

    1. Transparency Market Research (2018) Pigmentation disorders treatment market—global industry analysis, size, share, growth, trends, and forecast, 2018–2026. Available from: https://www.transparencymarketresearch.com/pigmentation-disorders-treatm...
    1. Yamaguchi Y, Hearing VJ. (2009). Physiological factors that regulate skin pigmentation. Biofactors 35: 193-199. doi: 10.1002/biof.29. PMID: - DOI - PMC - PubMed
    1. Lo JA, Fisher DE. (2014) The melanoma revolution: from UV carcinogenesis to a new era in therapeutics. Science 346: 945-949. doi: 10.1126/science.1253735. PMID: - DOI - PMC - PubMed
    1. Niu C, Aisa HA. (2017) Upregulation of Melanogenesis and Tyrosinase Activity: Potential Agents for Vitiligo. Molecules 22: doi: 10.3390/molecules22081303. PMID: - DOI - PMC - PubMed
    1. Koo J, Kim HT, Yoon H, Kwon K, Choi I, et al. (2008) Effect of xanthohumol on melanogenesis in B16 melanoma cells. Exp Mol Med 40: 313-319. doi: 10.3858/emm.2008.40.3.313. PMID: - DOI - PMC - PubMed

LinkOut - more resources