[Preprint]. 2020 Sep 8:2020.09.06.20189159.
doi: 10.1101/2020.09.06.20189159.

Kynurenic acid underlies sex-specific immune responses to COVID-19

Affiliations

Kynurenic acid underlies sex-specific immune responses to COVID-19

Yuping Cai et al. medRxiv. .

Update in

  • Kynurenic acid may underlie sex-specific immune responses to COVID-19.
    Cai Y, Kim DJ, Takahashi T, Broadhurst DI, Yan H, Ma S, Rattray NJW, Casanovas-Massana A, Israelow B, Klein J, Lucas C, Mao T, Moore AJ, Muenker MC, Oh JE, Silva J, Wong P; Yale IMPACT Research team; Ko AI, Khan SA, Iwasaki A, Johnson CH. Cai Y, et al. Sci Signal. 2021 Jul 6;14(690):eabf8483. doi: 10.1126/scisignal.abf8483. Sci Signal. 2021. PMID: 34230210 Free PMC article.

Abstract

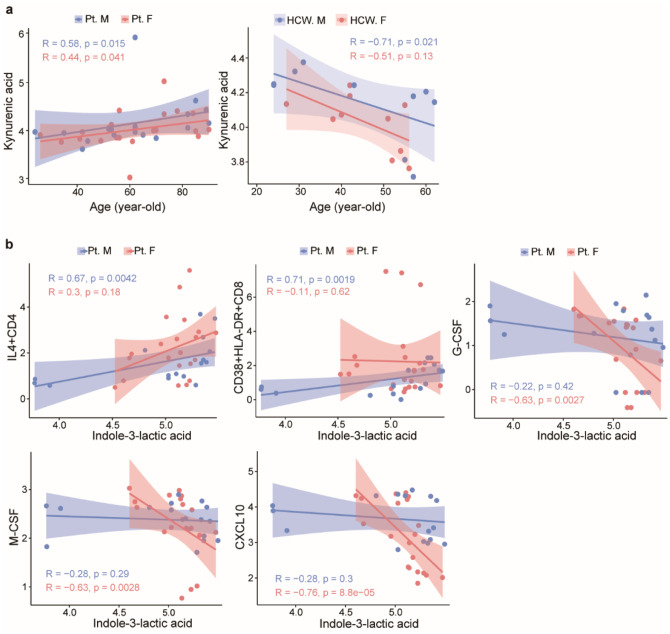
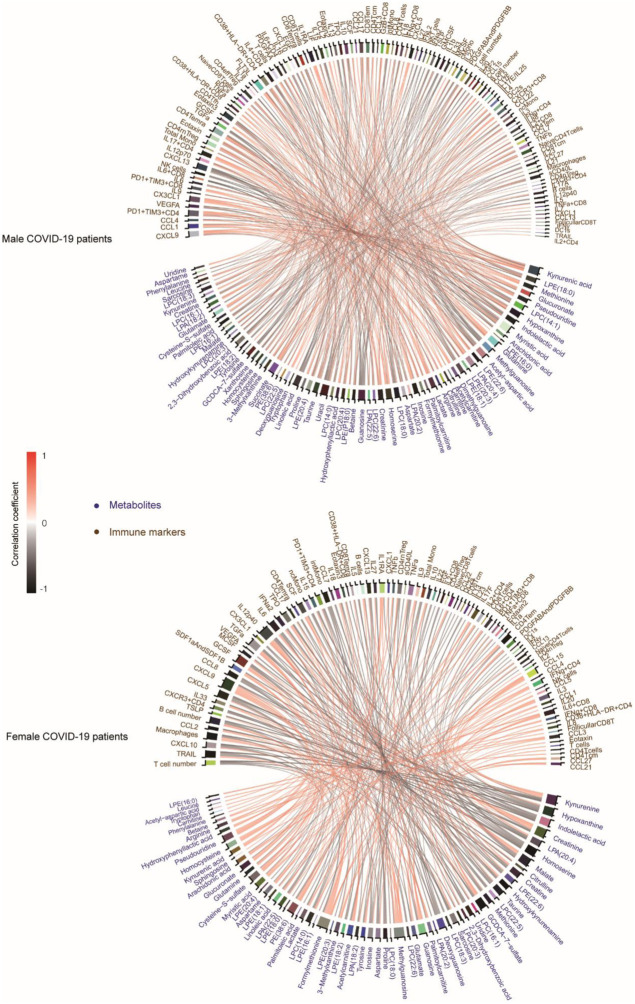
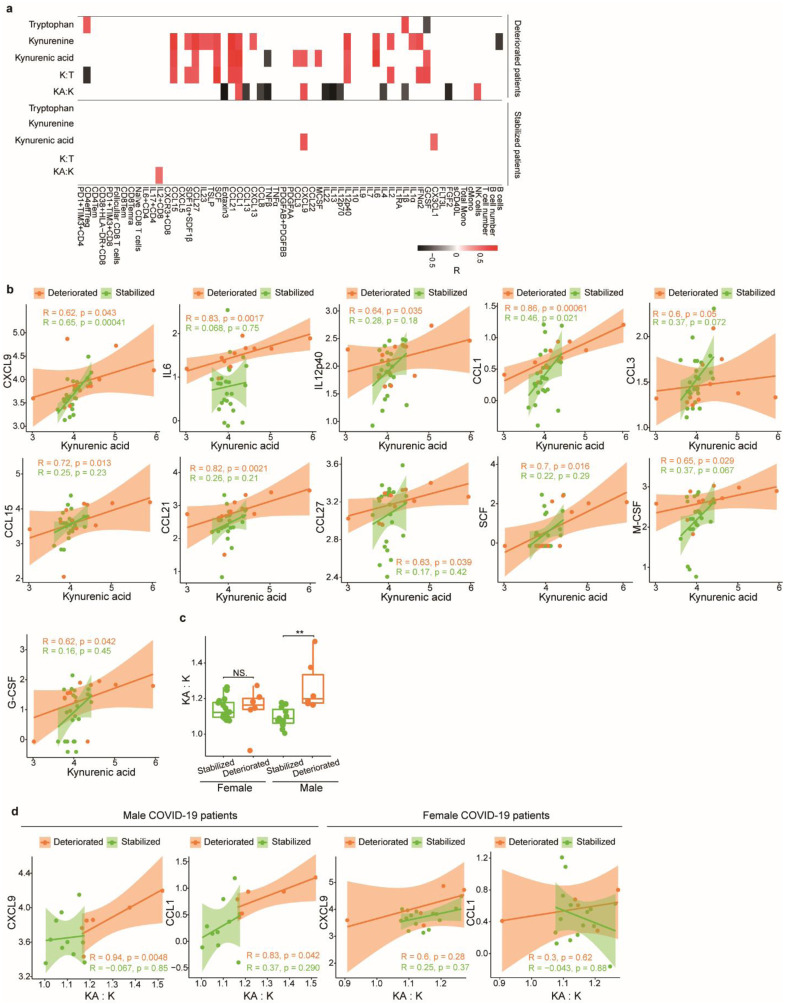
Coronavirus disease-2019 (COVID-19) has poorer clinical outcomes in males compared to females, and immune responses underlie these sex-related differences in disease trajectory. As immune responses are in part regulated by metabolites, we examined whether the serum metabolome has sex-specificity for immune responses in COVID-19. In males with COVID- 19, kynurenic acid (KA) and a high KA to kynurenine (K) ratio was positively correlated with age, inflammatory cytokines, and chemokines and was negatively correlated with T cell responses, revealing that KA production is linked to immune responses in males. Males that clinically deteriorated had a higher KA:K ratio than those that stabilized. In females with COVID-19, this ratio positively correlated with T cell responses and did not correlate with age or clinical severity. KA is known to inhibit glutamate release, and we observed that serum glutamate is lower in patients that deteriorate from COVID-19 compared to those that stabilize, and correlates with immune responses. Analysis of Genotype-Tissue Expression (GTEx) data revealed that expression of kynurenine aminotransferase, which regulates KA production, correlates most strongly with cytokine levels and aryl hydrocarbon receptor activation in older males. This study reveals that KA has a sex-specific link to immune responses and clinical outcomes, in COVID-19 infection.


Conflict of interest statement

Competing interest declaration

The authors declare no competing financial or non-financial interests.

Figures

Extended Data Figure 1
Scatter plots of correlation coefficient against −log10 (p value) between metabolites and immune markers in all patients with COVID-19, males with COVID-19, and females with COVID-19, respectively.
Extended Data Figure 2
Extended Data Figure 2. Correlations between metabolites and immune markers in patients with COVID-19 and healthcare workers stratified by sex.
a, Correlation between age and kynurenic acid levels in patients with COVID-19 (left) and HCWs (right). b, Correlation between indole-3-lactic acid and IL4+CD4, CD38+HLA-DR+CD8, G-CSF, M-CSF and CXCL10 in males with COVID-19 and females with COVID-19, respectively. 95% confidence intervals (CIs) for the correlation coefficients were indicated as the shadowed area colored according to sex.
Extended Data Figure 3
Extended Data Figure 3. Correlations between KYAT gene expression and cytokines positively associated with either high KA or KA:K.
Pearson correlation coefficients were calculated for gene pairs within the indicated tissue for each sex using GTEx data. Differences in the correlations (RMale–RFemale) are presented as heatmaps, with red indicating a more positive correlation in males and blue indicating a more positive correlation in females (n=729 males, 1914 females).
Extended Data Figure 4
Extended Data Figure 4. Correlations between KYAT3, immune markers, and AhR activation in younger and older individuals, stratified by sex.
a, Correlations between KYAT3 expression and IL6, IL10, CXCL9, TNF, and M-CSF in GTEx brain samples. b, Correlations between KYAT3 and AhR activation score in brain, muscle and colon. c, Correlation between KYAT3 and classic AhR target gene CYP1B1 in brain.
Fig. 1
Fig. 1. Chord diagram of correlations between metabolites and immune markers in COVID-19 patients.
Spearman correlations > 0.5 or < −0.5 are displayed and with p<0.05.
Fig. 2
Fig. 2. Tryptophan pathway metabolites and immune responses.
a, Correlation between kynurenic acid (KA) and immune markers in males with COVID-19 (Pt. M, n=17) and females with COVID-19 (Pt. F, n=22). 95% confidence intervals (CIs) for the correlation coefficients are indicated as shaded areas colored according to patient sex. b, Tryptophan (T) metabolism pathway schematic. c, Heatmap showing correlation between tryptophan metabolites and immune markers in males and females with COVID-19. Spearman correlations > 0.5 or < −0.5 are displayed, p<0.05. d, Correlation between age and KA:kynurenine (K) ratio in patients with COVID-19 and healthcare workers (HCWs). e, Correlation between KYAT3 (expression averaged within each age group) and age in Genotype-Tissue Expression (GTEx) samples (n=729 males, 1914 females). Metabolites are displayed as ion intensity log10 transformed, cytokines and chemokines are pg/mL log10 transformed, T cell subsets are % in CD3 T cells, T cell number are 10^6 cells/mL, PBMCs are % in live PBMCs.
Fig. 3
Fig. 3. Tryptophan metabolites, immune markers and disease severity.
a, Heatmap of correlations between metabolites in the tryptophan pathway and immune markers by disease severity. Spearman correlations > 0.5 or < −0.5 are displayed with a p<0.05. b, Correlation between kynurenic acid (KA) and immune markers by disease severity. 95% confidence intervals (CIs) for the correlation coefficients are indicated in shaded area colored according to disease progression status. c, Comparison of the ratio of KA:kynurenine (K) level by disease severity stratified by sex. Stabilized (females n=16, males =11), deteriorated (females n = 6, males n = 6). Nonparametric Kruskal–Wallis rank sum test with pairwise Wilcoxon Mann-Whitney U test, p values adjusted for false discovery rate (Benjamini-Hochberg). **p<0.01, NS. not significant. d, Correlation between the ratio of KA:kynurenine (K) and CXCL9 and CCL1 stratified by disease severity and sex. Metabolites are displayed as ion intensity log10 transformed, cytokines and chemokines are pg/mL log10 transformed, T cell subsets are % in CD3 T cells, T cell number are 10^6 cells/mL, PBMCs are % in live PBMCs.
Fig. 4.
Fig. 4.. Glutamate, immune markers and disease severity.
a, Comparison of glutamate levels in stablized patients and deteriorated patients (left panel) and stratified by sex (right panel). Stabilized patients (n=27), deteriorated patients (n=12), stabilized females (n=16), deteriorated females (n = 6), stabilized males (n = 11), and deteriorated males (n = 6). Nonparametric Kruskal–Wallis rank sum test with pairwise Wilcoxon Mann-Whitney U test, p values adjusted for false discovery rates (FDR) (Benjamini-Hochberg). **p<0.01, NS. not significant. b, Correlation between glutamate and Eotaxin2, IL5, IL6, CD4 T cells, CD4rnTreg cells, CD8 T cells and GzB+CD8 cells in stabilized patients and deteriorated patients. c, Correlation between glutamate and immune markers eotaxin2, IL5, IL6, CD4 T cells, CD8 T cells, GzB+CD8 cells, and IL6 in stabilized patients and deteriorated patients stratified by sex. 95% confidence intervals (CIs) for the correlation coefficients were indicated as the shadowed area colored according to progression status. Metabolites are displayed as ion intensity log10 transformed, cytokines and chemokines are pg/mL log10 transformed, T cell subsets are % in CD3 T cells, T cell number are 10^6 cells/mL, PBMCs are % in live PBMCs.

References

    1. McPadden J. et al. Clinical Characteristics and Outcomes for 7,995 Patients with SARS-CoV-2 Infection. medRxiv, doi: 10.1101/2020.07.19.20157305 (2020). - DOI - PMC - PubMed
    1. Takahashi T. et al. Sex differences in immune responses that underlie COVID-19 disease outcomes. Nature, doi: 10.1038/s41586-020-2700-3 (2020). - DOI - PMC - PubMed
    1. Ganeshan K. & Chawla A. Metabolic regulation of immune responses. Annu Rev Immunol 32, 609–634, doi: 10.1146/annurev-immunol-032713-120236 (2014). - DOI - PMC - PubMed
    1. O’Neill L. A., Kishton R. J. & Rathmell J. A guide to immunometabolism for immunologists. Nature reviews. Immunology 16, 553–565, doi: 10.1038/nri.2016.70 (2016). - DOI - PMC - PubMed
    1. Song J. W. et al. Omics-Driven Systems Interrogation of Metabolic Dysregulation in COVID-19 Pathogenesis. Cell metabolism, doi: 10.1016/j.cmet.2020.06.016 (2020). - DOI - PMC - PubMed

Publication types