Review
. 2021 Feb;69(2):137-155.
doi: 10.1369/0022155420959146. Epub 2020 Sep 16.

The Use of Quantitative Digital Pathology to Measure Proteoglycan and Glycosaminoglycan Expression and Accumulation in Healthy and Diseased Tissues

Affiliations
Review

The Use of Quantitative Digital Pathology to Measure Proteoglycan and Glycosaminoglycan Expression and Accumulation in Healthy and Diseased Tissues

A Sally Davis et al. J Histochem Cytochem. 2021 Feb.

Abstract

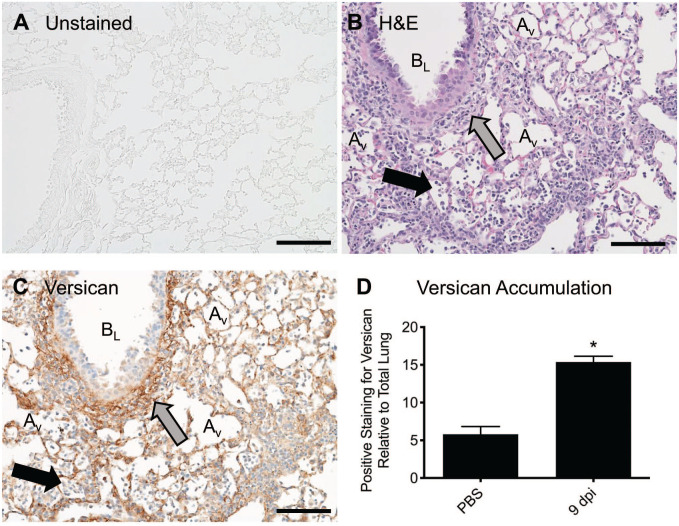
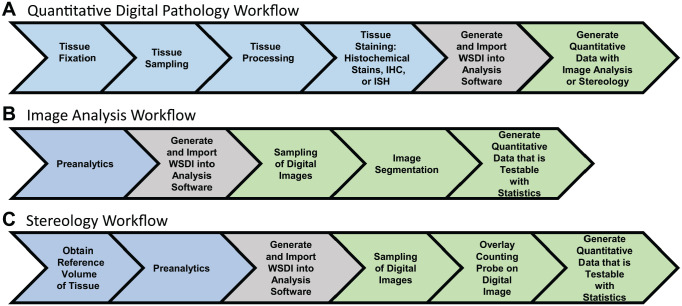
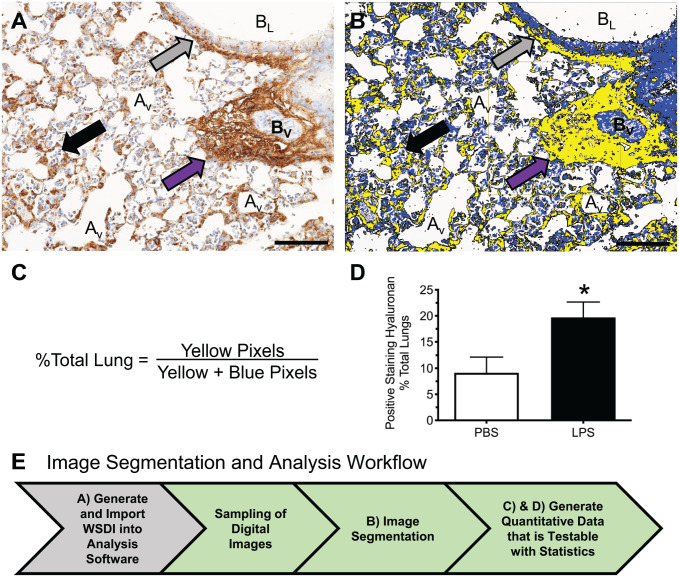
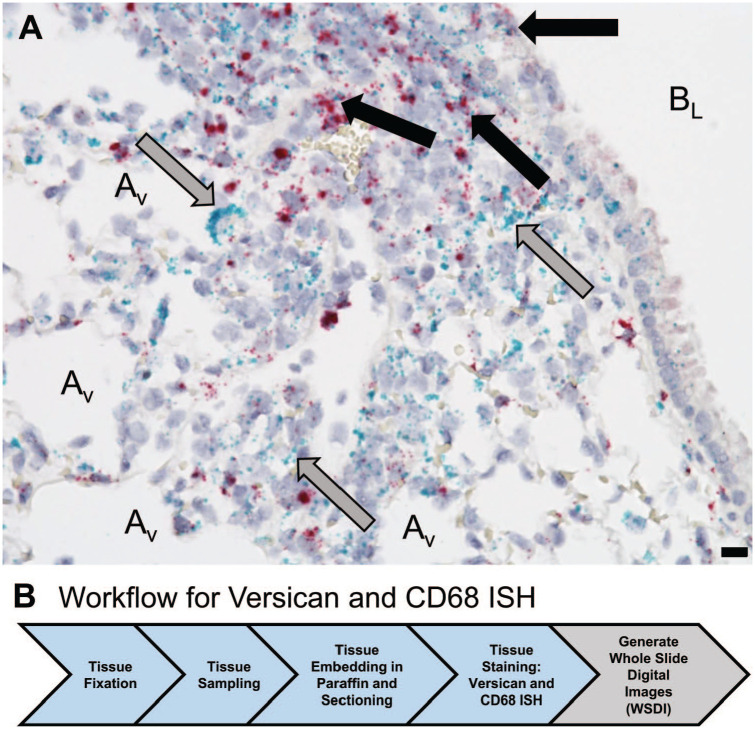
Advances in reagents, methodologies, analytic platforms, and tools have resulted in a dramatic transformation of the research pathology laboratory. These advances have increased our ability to efficiently generate substantial volumes of data on the expression and accumulation of mRNA, proteins, carbohydrates, signaling pathways, cells, and structures in healthy and diseased tissues that are objective, quantitative, reproducible, and suitable for statistical analysis. The goal of this review is to identify and present how to acquire the critical information required to measure changes in tissues. Included is a brief overview of two morphometric techniques, image analysis and stereology, and the use of artificial intelligence to classify cells and identify hidden patterns and relationships in digital images. In addition, we explore the importance of preanalytical factors in generating high-quality data. This review focuses on techniques we have used to measure proteoglycans, glycosaminoglycans, and immune cells in tissues using immunohistochemistry and in situ hybridization to demonstrate the various morphometric techniques. When performed correctly, quantitative digital pathology is a powerful tool that provides unbiased quantitative data that are difficult to obtain with other methods.

Keywords: artificial intelligence; asthma; digital pathology; extracellular matrix; glycosaminoglycans; image analysis; immunohistochemistry; in situ hybridization; influenza; machine learning; proteoglycans; stereology.


Conflict of interest statement

Competing Interests: The author(s) declared no potential conflicts of interest with respect to the research, authorship, and/or publication of this article.

Figures

Figure 1.
Figure 1.
Histochemical stains provide contrast to tissues, which is required to visualize cells, structures, and molecules. (A) The unstained lung tissue from a mouse is transparent, making it difficult to visualize structures and cells. (B) An H&E-stained lung tissue obtained from a mouse 9 dpi with influenza virus has contrast, allowing for the visualization of neutrophils and macrophages (black arrow) in alveoli. An accumulation of lymphocytes and macrophages (gray arrow) is observed in the peribronchiolar space around a bronchiole. (C) A tissue section adjacent to the section shown in (B) with positive immunostaining for the chondroitin sulfate proteoglycan, versican (brown). The gray arrow highlights an accumulation of versican in the peribronchiolar space of the same bronchiole shown in (A). Positive staining for versican on alveolar septa is also observed. Hematoxylin staining of nuclei (blue) provides the morphological details required to identify neutrophils and macrophages (black arrow) in alveoli. (D) Quantitative digital pathology was performed on WSDIs of lung tissue obtained from mice after oropharyngeal treatment with PBS (vehicle control) or 9 dpi with influenza virus (PR/8). The analysis showed a significant increase in versican accumulation in lungs at 9 dpi using the Mann–Whitney test, *p<0.03 with n=4 mice/group, values are mean ± SEM. Scale bar (A, B, and C), 100 μm. Abbreviations: AV, alveolus; BL, bronchiole lumen; dpi, days post-infection; H&E, hematoxylin and eosin; PBS, phosphate-buffered saline; WSDI, whole slide digital image.
Figure 2.
Figure 2.
(A) Workflow for performing quantitative digital pathology on 2D tissue sections using image analysis and stereology. Blue shading designates preanalytical factors, which are procedures a tissue undergoes before quantitative analysis. Gray shading designates generation of whole slide digital images, and green shading designates quantitative analysis of digital images. (B) Workflow for image analysis, a 2D analysis technique used to obtain quantitative data from tissue sections stained with histochemical stains, IHC, or ISH. (C) Workflow for stereology, a 3D analysis technique that is considered the gold standard for quantitative analysis of tissue sections. A critical preanalytical step often required when performing stereology is the need to obtain a reference volume, which is the volume of tissue, organ, or biopsy before processing of the tissue. Abbreviations: 2D, two-dimensional; 3D, three-dimensional; IHC, immunohistochemistry; ISH, in situ hybridization.
Figure 3.
Figure 3.
Image analysis using whole slide digital imaging and automated image analysis software provides quantitative data on the relative amount of positive staining for HA in lungs of mice treated with PBS or LPS. (A) Positive immunostaining for HA (brown) in lung tissue obtained from a mouse 48 hr after oropharyngeal instillation of LPS. HA accumulation is observed in alveolar septa, peribronchiolar (gray arrow), and perivascular (purple arrow) spaces. Hematoxylin (blue) is the counterstain used to provide contrast, which allows for visualization of neutrophils within an alveolus (black arrow). (B) Segmentation of the digital image shown in (A) using Visiopharm Image Analysis Software where yellow pixels designate lung tissue that stains positive for HA and blue pixels define unstained lung tissue. (C) Formula used to determine the relative area of lung tissue stained positive for HA. (D) Accumulation of HA is significantly increased in the lungs of mice treated with LPS. Values are mean ± SEM with n=4 for each group. *Significantly different (p<0.04) than mice treated with PBS using the Mann–Whitney test and GraphPad Prism. (E) Workflow for quantification of HA in WSDIs using image analysis. Scale bar (A and B), 100 μm. Abbreviations: Av, alveolus; BL, bronchiole lumen; BV, blood vessel; HA, hyaluronan; LPS, lipopolysaccharide; PBS, phosphate-buffered saline; WSDI, whole slide digital image.
Figure 4.
Figure 4.
(A) In situ hybridization provides evidence of colocalization of versican (red) and CD68 mRNA (green) in cells in the lungs obtained from a C57BL/6J male mouse 9 dpi with influenza virus. Black arrows identify cells positive for CD68 and versican mRNA among bronchiolar epithelial cells and in the peribronchiolar space. Gray arrows identify cells stained positive only for CD68 in the peribronchiolar space and adjacent to alveoli. (B) Workflow for in situ hybridization includes fixation in formalin and proper sampling using a cutting instrument that sections lung tissue into 2 mm sections that were then processed into 4 mm sections. In situ hybridization was performed on these tissue sections using RNAscope kits (Advanced Cell Diagnostics [ACD]; Newark, CA) on a Leica Bond Rx (Leica Biosystems; Nussloch, Germany). The Hamamatsu-HT 9600 Nanozoomer Digital Pathology System (Hamamatsu Photonics; Hamamatsu City, Japan) converted the stained tissue section into a WSDI. Scale bar, 10 µm. Abbreviations: AV, alveolus; BL, bronchiole lumen; dpi, days post-infection; WSDI, whole slide digital images.
Figure 5.
Figure 5.
The physical disector provides accurate measurement of cell numbers and/or volume in tissues. (A) Two WSDIs from two tissue sections approximately 6 µm apart (i.e., disector height) were processed using the Visiopharm Autodisector module, which sampled, aligned, and labeled the adjacent sections as the “reference” and “look-up” sections. A two-dimensional counting frame is shown superimposed on these images with inclusion lines (left and bottom) and exclusion lines (right and top) of the counting frame. A hematoxylin-stained nucleus (blue) in a mast cell (MC) identified using a murine monoclonal anti-tryptase antibody (brown stain) is counted if it is in focus, if it is inside the counting frame, or if it touches the inclusion lines but does not touch the exclusion lines. MC nuclei that were in focus in the “reference” were counted if they were not present in the “look-up” sections. For efficiency, this process was reversed so that the Look-up section became the Reference section. In this case, the MC nuclei shown by red arrow in the lower right-hand counting frame in the Look-up section are counted because they are not observed in the counting frame of the adjacent Reference section. A point associated with each counting frame was used to determine the reference volume by enumerating points hitting the submucosa and the epithelium. The point in the lower left-hand counting frame, highlighted by red arrow, is hitting the epithelium, so it is counted. (B) Workflow for performing analysis using the physical disector on two WSDIs to measure the volume of MCs in tissue biopsies. (A) is a supplemental figure from Altman et al. Abbreviation: WSDI, whole slide digital image.
Figure 6.
Figure 6.
Deep learning algorithms and image analysis protocols were used to perform image segmentation and analysis to measure the colocalization of versican and PDGFRB mRNA in the nuclei of lung tissue obtained from an influenza virus–infected mouse. (A) Digital image of the tissue section stained for versican (red) and PDGFRB (green) mRNA in tissues adjacent to a bronchiole (BL) in lung tissue from a 9 dpi with influenza virus mouse. (B) To decrease nuclear identification processing time, uniform random sampling was performed before running the deep learning module. The green dashed line defines lung tissue and the black boxes show the uniform sampling pattern that was laid down with a random start on the WSDI. The analysis software identifies and only performs analysis on lung tissue. This is illustrated by the black fill in each of the boxes. (C) The Visiopharm deep learning module was used to train the computer to accurately identify nuclei (gray) for nuclear segmentation. (D) Image analysis protocols were used to identify nuclei that were positively stained for versican mRNA alone (red), PDGFRB mRNA alone (green) or versican and PDGFRB mRNA in the same nuclei (yellow). (E) Workflow for generating objective data on the colocalization of versican and PDGFRB. Scale bar (A, C, D), 85 μm; (B), 1 mm. Abbreviations: AV, alveolus; BL, bronchiole lumen; dpi, days post-infection; PDGFRB, platelet-derived growth factor receptor beta; WSDI, whole slide digital images
Figure 7.
Figure 7.
Uniform random sampling of tissues minimizes bias and variability due to the multifocal distribution of cells and other analytes of interest in tissues. (A) Cutting instrument with trimming blades used to section mouse lungs into 2 mm sagittal sections to ensure adequate sampling. This cutting instrument was used to sample the lung tissues analyzed in Figs. 1, 3, 4, and 6. (B) Stratified uniform sampling of a lung lobe from a non-human primate that uses a plexiglass template with evenly spaced 5 mm holes that was randomly placed over section of a lung lobe. A punch biopsy was used to collect tissue for microbial cultures and histology, with 10% of the lung lobe collected for each test. (B) is adapted from Luciw et al.

Similar articles

Cited by

References

    1. Goodwin P, Johnson B, Frevert C. Microscopy, immunohistochemistry, digital imaging, and quantitative microscopy. In: Treuting PM, Dintzis SM, Montine KS, editors. Comparative anatomy and histology: a mouse, rat, and human atlas. 2nd ed. Amsterdam; Boston: Elsevier/Academic Press; 2018. p. 55–66.
    1. Brown C, Sekhavati F, Cardenes R, Windmueller C, Dacosta K, Rodriguez-Canales J, Steele KE. CTLA-4 immunohistochemistry and quantitative image analysis for profiling of human cancers. J Histochem Cytochem. 2019;67(12):901–18. - PMC - PubMed
    1. Zarella MD, Bowman D, Aeffner F, Farahani N, Xthona A, Absar SF, Parwani A, Bui M, Hartman DJ. A practical guide to whole slide imaging: a white paper from the digital pathology association. Arch Pathol Lab Med. 2019;143(2):222–34. - PubMed
    1. Bankhead P, Loughrey MB, Fernandez JA, Dombrowski Y, McArt DG, Dunne PD, McQuaid S, Gray RT, Murray LJ, Coleman HG, James JA, Salto-Tellez M, Hamilton PW. QuPath: open source software for digital pathology image analysis. Sci Rep. 2017;7(1):16878. - PMC - PubMed
    1. Iozzo RV, Schaefer L. Proteoglycan form and function: a comprehensive nomenclature of proteoglycans. Matrix Biol. 2015;42:11–55. - PMC - PubMed

Publication types

MeSH terms

LinkOut - more resources