Association of UGT1A1*6 polymorphism with irinotecan-based chemotherapy reaction in colorectal cancer patients: a systematic review and a meta-analysis
- PMID: 32936306
- PMCID: PMC7578622
- DOI: 10.1042/BSR20200576
Association of UGT1A1*6 polymorphism with irinotecan-based chemotherapy reaction in colorectal cancer patients: a systematic review and a meta-analysis
Abstract
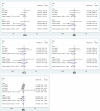
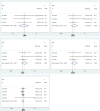
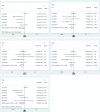
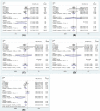
Colorectal cancer (CRC) is a leading cause of cancer-related deaths across the world. Irinotecan (IRI) is commonly used to treat CRC, and IRI-based chemotherapy is linked with adverse reaction and the efficacy of the treatment regimen. The gene UGT1A1 plays a central role in the IRI metabolic pathway. A polymorphism UGT1A1*6 has been widely researched which may be related to response of IRI-based chemotherapy in CRC. All relevant studies were strictly searched from PubMed, Embase, Cochrane Library and Web of Science databases to explore the associations between UGT1A1*6 and response of IRI-based chemotherapy with CRC. Nine articles comprising 1652 patients were included in the final combination. Meta-analysis showed G allele or GG had a lower risk of severe late-onset diarrhea compared with A/AA in allele model and homozygote model (G vs. A: OR = 0.53, 95% CI: 0.28-0.99, P=0.05; GG vs. AA: OR = 0.48, 95% CI: 0.23-0.99, P=0.05), no significant association was observed in other models. In addition, a significant association between UGT1A1*6 and neutropenia was observed in all models (G vs. A: OR = 0.57, 95% CI: 0.46-0.71, P=0.00; GG vs. AA: OR = 0.28, 95% CI: 0.17-0.45, P=0.01; GA vs. AA: OR = 0.42, 95% CI: 0.26-0.70, P=0.00; GG+GA vs. AA: OR = 0.32, 95% CI: 0.20-0.52, P=0.00; GG vs. AA+GA: OR = 0.40, 95% CI: 0.22-0.71, P=0.00), whereas, no relationship was found between UGT1A1*6 and clinical response among the different genotypes. UGT1A1*6 may be considered as a biomarker for IRI-based chemotherapy in CRC.
Keywords: UGT1A1; colorectal cancer; irinotecan; meta-analysis; response; rs4148323.
© 2020 The Author(s).
Conflict of interest statement
The authors declare that there are no competing interests associated with the manuscript.
Figures



Similar articles
-
Meta-analysis revisiting the influence of UGT1A1*28 and UGT1A1*6 on irinotecan safety in colorectal cancer patients.Pharmacogenomics. 2024;25(10-11):469-477. doi: 10.1080/14622416.2024.2385289. Epub 2024 Aug 22. Pharmacogenomics. 2024. PMID: 39171626
-
Relevance of CYP3A4*20, UGT1A1*37 and UGT1A1*28 variants in irinotecan-induced severe toxicity.Br J Clin Pharmacol. 2018 Jun;84(6):1389-1392. doi: 10.1111/bcp.13574. Epub 2018 Apr 16. Br J Clin Pharmacol. 2018. PMID: 29504153 Free PMC article.
-
Association of UGT1A1*28 polymorphisms with irinotecan-induced toxicities in colorectal cancer: a meta-analysis in Caucasians.Pharmacogenomics J. 2014 Apr;14(2):120-9. doi: 10.1038/tpj.2013.10. Epub 2013 Mar 26. Pharmacogenomics J. 2014. PMID: 23529007 Free PMC article.
-
UGT1A1 6/28 polymorphisms could predict irinotecan-induced severe neutropenia not diarrhea in Chinese colorectal cancer patients.Med Oncol. 2013;30(3):604. doi: 10.1007/s12032-013-0604-x. Epub 2013 May 18. Med Oncol. 2013. PMID: 23686699
-
Irinotecan-induced toxicity pharmacogenetics: an umbrella review of systematic reviews and meta-analyses.Pharmacogenomics J. 2017 Jan;17(1):21-28. doi: 10.1038/tpj.2016.58. Epub 2016 Aug 9. Pharmacogenomics J. 2017. PMID: 27503581
Cited by
-
The role of UGT1A1 polymorphism in the management of colorectal cancer.Oncol Rev. 2025 May 13;19:1547904. doi: 10.3389/or.2025.1547904. eCollection 2025. Oncol Rev. 2025. PMID: 40432911 Free PMC article. Review.
-
Association of UGT1A1*6, UGT1A1*28, or ABCC2 c.3972C>T genetic polymorphisms with irinotecan-induced toxicity in Asian cancer patients: Meta-analysis.Clin Transl Sci. 2022 Jul;15(7):1613-1633. doi: 10.1111/cts.13277. Epub 2022 May 31. Clin Transl Sci. 2022. PMID: 35506159 Free PMC article.
-
Liposomal irinotecan (Onivyde): Exemplifying the benefits of nanotherapeutic drugs.Cancer Sci. 2022 Jul;113(7):2224-2231. doi: 10.1111/cas.15377. Epub 2022 May 26. Cancer Sci. 2022. PMID: 35445479 Free PMC article. Review.
-
Influence of UGT1A1 *6/*28 Polymorphisms on Irinotecan-Related Toxicity and Survival in Pediatric Patients with Relapsed/Refractory Solid Tumors Treated with the VIT Regimen.Pharmgenomics Pers Med. 2021 Mar 23;14:369-377. doi: 10.2147/PGPM.S292556. eCollection 2021. Pharmgenomics Pers Med. 2021. PMID: 33790625 Free PMC article.
-
Meta-analysis revisiting the influence of UGT1A1*28 and UGT1A1*6 on irinotecan safety in colorectal cancer patients.Pharmacogenomics. 2024;25(10-11):469-477. doi: 10.1080/14622416.2024.2385289. Epub 2024 Aug 22. Pharmacogenomics. 2024. PMID: 39171626
References
-
- Cremolini C., Rossini D., Dell’Aquila E., Lonardi S., Conca E., Del Re M. et al. . (2019) Rechallenge for patients with RAS and BRAF wild-type metastatic colorectal cancer with acquired resistance to first-line cetuximab and irinotecan: a phase 2 single-arm clinical trial. JAMA Oncol. 5, 343–350 10.1001/jamaoncol.2018.5080 - DOI - PMC - PubMed
Publication types
MeSH terms
Substances
LinkOut - more resources
Full Text Sources
Medical

