. 2021 Jun;41(6):1264-1276.
doi: 10.1177/0271678X20951993. Epub 2020 Sep 16.

Rapid hematoma growth triggers spreading depolarizations in experimental intracortical hemorrhage

Affiliations

Rapid hematoma growth triggers spreading depolarizations in experimental intracortical hemorrhage

Paul Fischer et al. J Cereb Blood Flow Metab. 2021 Jun.

Abstract

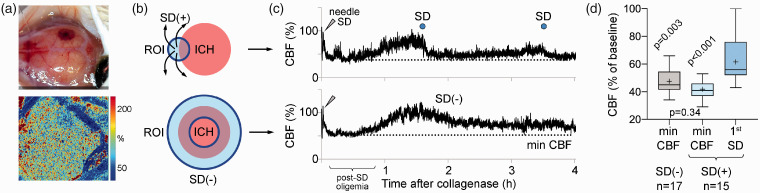
Recurrent waves of spreading depolarization (SD) occur in brain injury and are thought to affect outcomes. What triggers SD in intracerebral hemorrhage is poorly understood. We employed intrinsic optical signaling, laser speckle flowmetry, and electrocorticography to elucidate the mechanisms triggering SD in a collagenase model of intracortical hemorrhage in mice. Hematoma growth, SD occurrence, and cortical blood flow changes were tracked. During early hemorrhage (0-4 h), 17 out of 38 mice developed SDs, which always originated from the hematoma. No SD was detected at late time points (8-52 h). Neither hematoma size, nor peri-hematoma perfusion were associated with SD occurrence. Further, arguing against ischemia as a trigger factor, normobaric hyperoxia did not inhibit SD occurrence. Instead, SDs always occurred during periods of rapid hematoma growth, which was two-fold faster immediately preceding an SD compared with the peak growth rates in animals that did not develop any SDs. Induced hypertension accelerated hematoma growth and resulted in a four-fold increase in SD occurrence compared with normotensive animals. Altogether, our data suggest that spontaneous SDs in this intracortical hemorrhage model are triggered by the mechanical distortion of tissue by rapidly growing hematomas.

Keywords: Cerebral amyloid angiopathy; electrocorticography; intracerebral hemorrhage; laser speckle imaging; spreading depolarization.


Conflict of interest statement

Declaration of conflicting interests: The author(s) declared the following potential conflicts of interest with respect to the research, authorship, and/or publication of this article: M.E. reports grants from Bayer and fees paid to the Charité from Bayer, Boehringer Ingelheim, BMS, Daiichi Sankyo, Amgen, GSK, Sanofi, Covidien, Novartis, Pfizer, all outside the submitted work. The author(s) declared no potential conflicts of interest with respect to the research, authorship, and/or publication of this article.

Figures

Figure 1.
Figure 1.
Experimental design. (a) Experimental setup including the femoral artery catheter to monitor systemic physiology, the camera for intrinsic optical signal imaging (IOS), a second camera and a near infrared laser diode for laser speckle flowmetry (LSF). Horizontal line shows typical experimental timeline. Starting 0, 8, 24, or 48 h after collagenase injection, electrophysiology (ECoG,DC), arterial blood pressure (BP), IOS, and LSF were continuously recorded for 4 h. Representative electrophysiological (DC) and blood pressure (BP) tracings, and IOS and LSF images are shown. A typical slow negative extracellular potential shift of the SD wave is shown on the DC tracing recorded by a glass capillary microelectrode (e; 1.5 mm anterior and 0.5 mm lateral from bregma) visible on the IOS image along with the intracerebral hemorrhage (ICH) around collagenase injection site (2 mm posterior and 3 mm lateral from bregma). All images are obtained through intact skull. LSF image shows CBF changes relative to baseline (%) as shown in the color bar. The field of view is similar to IOS. Representative 1-mm coronal sections were prepared at the end of the recordings to calculate ICH volume. (b) Hemorrhage volume measured using coronal sections correlates with hemoglobin content measured later in tissue homogenates (Spearman r=0.56, p<0.001; left panel). (c) The dorsal area of ICH prior to sacrifice (as seen in IOS) showed a tight and linear correlation with the ICH volume calculated post-mortem (Spearman r = 0.92, p<0.001; right panel). Each dot represents a single animal.
Figure 2.
Figure 2.
Spreading depolarizations occur during early but not late stages of intracortical hemorrhage. (a) Representative intrinsic optical signal (IOS) images (every 30 min), continuous electrophysiological recordings (ECoG and DC), and the coronal section at the end of the experiment from two animals in the early stage of intracerebral hemorrhage (ICH) (0–4 h). The first animal (top) has a slow growing, small hematoma, and did not develop any spreading depolarization (SD). The second animal (bottom) developed a large hematoma within 90 min. Two SDs occurred during this rapid growth phase (arrowheads). (b) Representative data from an animal studied at a later stage (48–52 h) of ICH. Despite the large hematoma, there was no change in hematoma size and no SD. (c) Time of SD occurrence during early stage of ICH in animals that developed at least one SD. Each line represents one animal and each circle represents one SD. Most SDs emerged between 30 and 120 min after collagenase injection. Animals with no SD are not shown. (d) SD frequency and ICH volume are shown for early and late stages. There was no SD detected during late stages of ICH (p=0.020 vs. early stage; Mann–Whitney test) despite nearly identical hematoma volumes (p=0.99 vs. early stage; Mann–Whitney test).
Figure 3.
Figure 3.
Intracortical hemorrhage volume, growth rate, and occurrence of spreading depolarizations. (a) Volume of intracerebral hemorrhage (ICH) shown as a function of time in animals with spreading depolarization (SD) (left panel) and without spreading depolarization (right panel). Each line represents one animal. Filled circles mark the first SD, unfilled circles mark subsequent SDs. Average hematoma volumes at the time of first SD and at the end of the experiment are shown as whisker-box plots to the right of each time course graph. The mean time of first SD occurrence (t1st SD) is shown as dotted line on all graphs as a reference point. Hematoma volumes at the time of first SD (blue whisker-box plot) were nearly identical to the final hematoma volumes in animals that never developed an SD (gray whisker-box plot in no SD group; p=0.59, unpaired t-test). (b) Average ICH growth per 10-min intervals (see inset) is shown before and after the first SD in each animal that developed one, and the average of first SD time points (tSD) in animals that did not develop any SD. ICH growth accelerated and peaked right before an SD (left panel), whereas no acceleration was observed in animals that did not develop any SD (right panel). Moreover, ICH growth during the 10 min preceding the first SD was significantly higher than the ICH growth at an equivalent time point, as well as the peak growth rate at any time point, in animals not developing an SD (p<0.001 or p=0.014, respectively, Mann–Whitney test).
Figure 4.
Figure 4.
Cerebral blood flow and spreading depolarization occurrence. (a) Representative cortical hemorrhage in the right hemisphere (top) and simultaneous laser speckle flowmetry (LSF) showing relative cerebral blood flow (CBF) imaged through intact skull (bottom). CBF within the ICH is mildly reduced, while rest of the cortex shows normal CBF. (b) Region of interest (ROI, blue shaded) placement at the hemorrhage site is shown for CBF calculation. In animals that developed a spreading depolarization (SD) (top), a circular ROI (0.8 mm diameter) was placed where SD originated from to plot CBF changes in that ROI throughout the 4-h experiment. In animals that did not develop any SD (bottom), a ring ROI (0.8 mm-thick) was placed at the average distance of all SD origins to the center of ICH to capture the CBF in an equivalent perimeter of ICH. (c) Representative CBF tracings are shown from such ROIs in animals with or without SD (bottom and top, respectively). In both cases, CBF decreased to approximately 50% of baseline after the initial SD caused by needle insertion for collagenase injection (0 min), which is typical for post-SD oligemia in mice. An SD (top tracing, blue circle) emerged 100 min after collagenase when CBF was approximately 90% of baseline at its origin. A second SD occurred later around 210 min. The minimum CBF in each tracing is marked by a dotted line. (d) Minimum CBF in experiments that did not show an SD and minimum CBF as well as CBF at the onset of first spontaneous SD in animals that developed one are shown. Average CBF when and where SD originated was above 60% of baseline and significantly higher than the minimum CBF levels reached in either group (p<0.001 and p = 0.003 vs. 1st SD; one-way ANOVA followed by Tukey’s multiple comparisons test).
Figure 5.
Figure 5.
Effects of normobaric hyperoxia on spreading depolarization occurrence. (a) Normobaric hyperoxia (NBO) was induced 10 min after collagenase injection and compared with normoxic controls (n=8 each). NBO did not affect final hemorrhage volume (p=0.410 vs. control, unpaired t-test) or peak hemorrhage growth rate (p=0.554, Mann–Whitney test). (b) NBO did not affect the minimum cerebral blood flow (CBF) reached during the experiment or the CBF immediately preceding the first spreading depolarization (SD) (p=0.986 and p=0.459, respectively; Mann–Whitney test). (c) NBO did not affect the fraction of animals developing an SD (p=0.590, χ2) or the frequency of SDs (p = 0.991, Mann–Whitney test).
Figure 6.
Figure 6.
Accelerating hematoma growth triggers spreading depolarization in intracortical hemorrhage. (a) Intraperitoneal administration of phenylephrine 45 min after collagenase injection increased blood pressure (BP) by 70% compared to baseline within 15 min. (b) The surge in BP accelerated hematoma growth so that the volume of intracerebral hemorrhage (ICH) in the normotensive group after 240 min was reached in the hypertensive group within only 40 min after phenylephrine injection (p=0.945, Mann–Whitney test; left panel). Peak ICH growth rate was more than doubled in hypertensive animals (HTN) compared with normotensive controls (p=0.003, Mann–Whitney test), with a wider range of values (right panel). (c) Induced hypertension increased spreading depolarization (SD) frequency by fourfold compared with controls (p=0.050, Mann–Whitney test; left panel). In contrast, the percentage of animals developing SDs only increased from 45% to 60% (p=0.39, χ2; right panel). (d) We next dichotomized controls and hypertensive animals based on SD occurrence. In both groups, animals that developed an SD showed significantly higher ICH growth rates, than animals not developing an SD (p<0.001, two-way ANOVA followed by Holm–Sidak multiple comparison). Moreover, hypertensive animals that developed SDs had faster ICH growth rates than controls that developed SDs (p<0.001, two-way ANOVA followed by Holm-Sidak multiple comparison), explaining the overall higher SD frequencies in the hypertensive group.
Figure 7.
Figure 7.
Propensity of primary intracortical hemorrhage and primary focal ischemic infarcts to develop spreading depolarizations. Top panel shows a representative intracortical hemorrhage on 1-mm coronal section 4 h after injection of collagenase (left) and a representative focal ischemic lesion (arrowheads) on H&E-stained coronal section 4 h after distal middle cerebral artery occlusion (right). Despite nearly identical location and lesion volume (middle panel), ischemic lesions triggered more than twice the number of spreading depolarizations compared with hemorrhagic lesions (p = 0.039, Mann–Whitney test; bottom panel). For this comparison, we used 27 out of the 38 intracortical hemorrhage animals in control groups studied above with hematoma volumes matching the infarct volumes for a common denominator.

Similar articles

Cited by

References

    1. O'Donnell MJ, Xavier D, Liu L, et al.. Risk factors for ischaemic and intracerebral haemorrhagic stroke in 22 countries (the INTERSTROKE study): a case-control study. Lancet 2010; 376: 112–123. - PubMed
    1. van Asch CJ, Luitse MJ, Rinkel GJ, et al.. Incidence, case fatality, and functional outcome of intracerebral haemorrhage over time, according to age, sex, and ethnic origin: a systematic review and meta-analysis. Lancet Neurol 2010; 9: 167–176. - PubMed
    1. Poon MT, Fonville AF, Al-Shahi Salman R.Long-term prognosis after intracerebral haemorrhage: systematic review and meta-analysis. J Neurol Neurosurg Psychiatry 2014; 85: 660–667. - PubMed
    1. Hartings JA, Shuttleworth CW, Kirov SA, et al.. The continuum of spreading depolarizations in acute cortical lesion development: examining Leao's legacy. J Cereb Blood Flow Metab 2017; 37: 1571–1594. - PMC - PubMed
    1. Dreier JP, Fabricius M, Ayata C, et al.. Recording, analysis, and interpretation of spreading depolarizations in neurointensive care: review and recommendations of the COSBID research group. J Cereb Blood Flow Metab 2017; 37: 1595–1625. - PMC - PubMed

Publication types

LinkOut - more resources