. 2020 Nov 25;108(4):748-762.e4.
doi: 10.1016/j.neuron.2020.08.019. Epub 2020 Sep 15.

Central Vestibular Tuning Arises from Patterned Convergence of Otolith Afferents

Affiliations

Central Vestibular Tuning Arises from Patterned Convergence of Otolith Afferents

Zhikai Liu et al. Neuron. .

Erratum in

Abstract

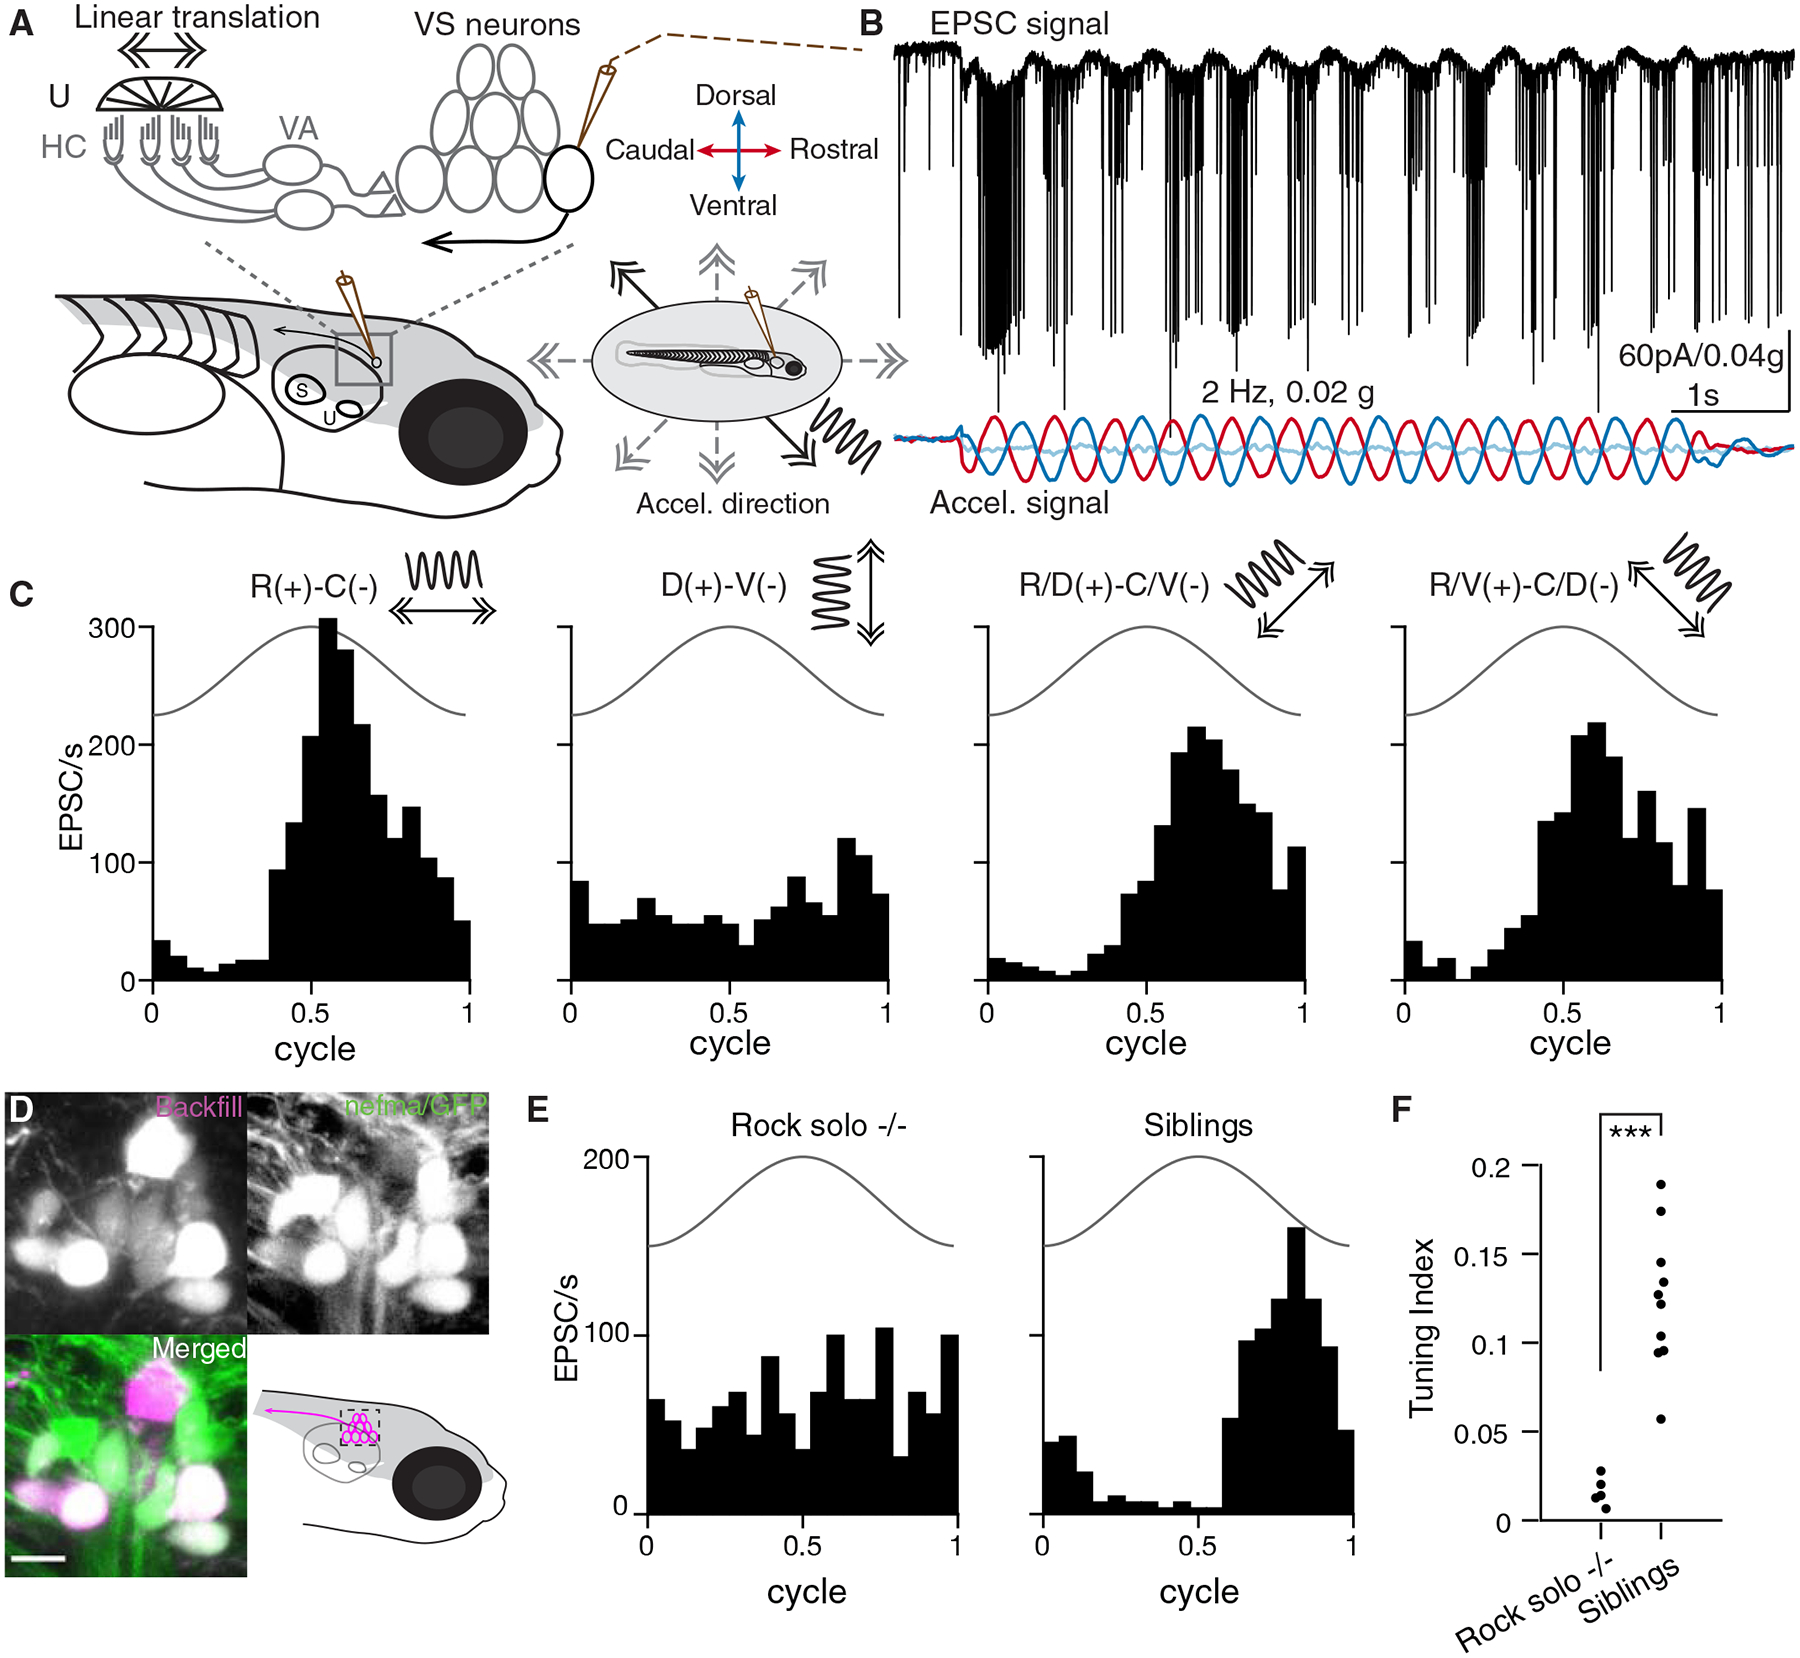
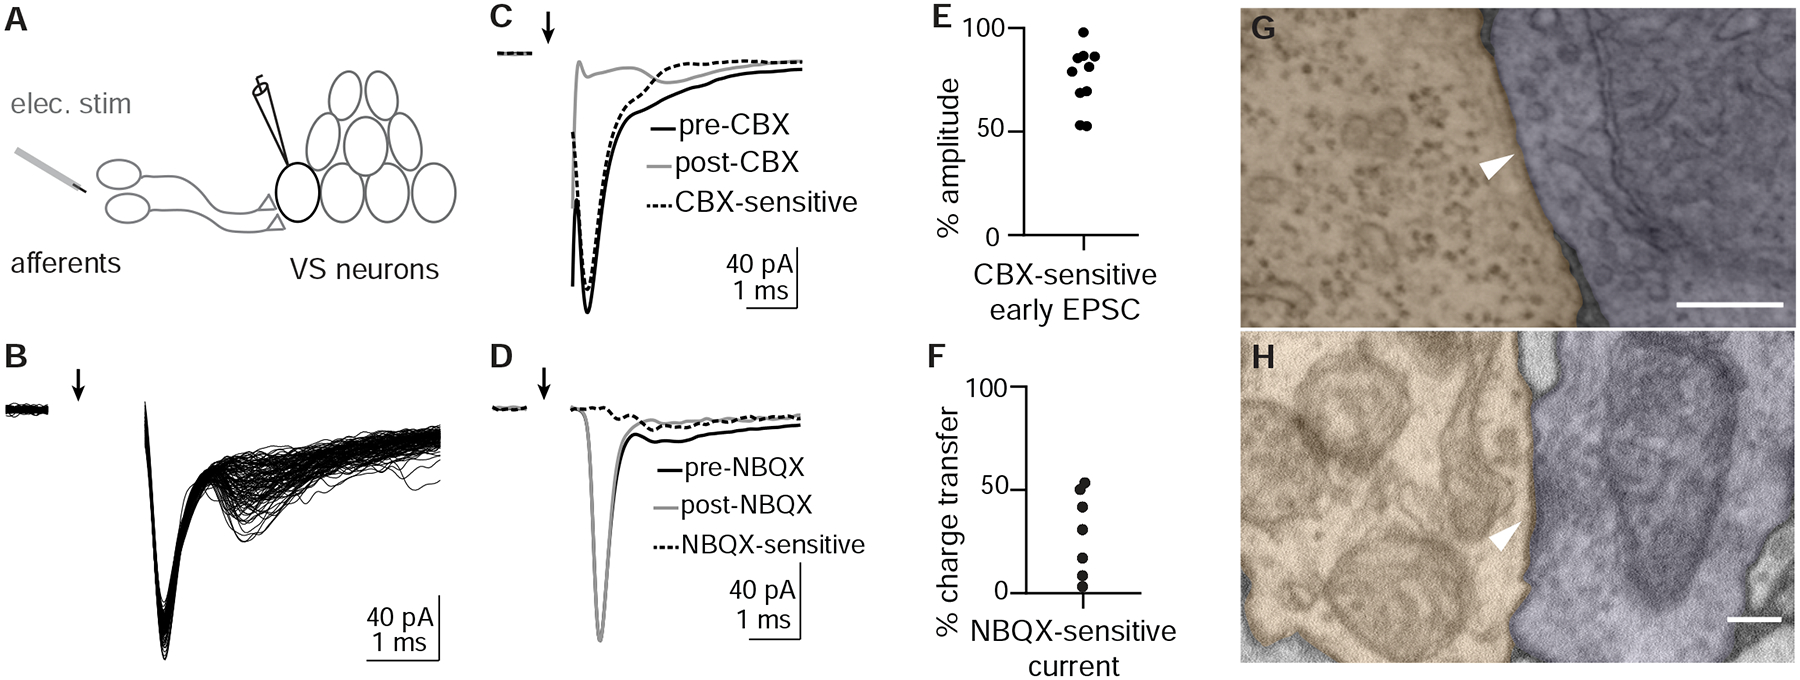
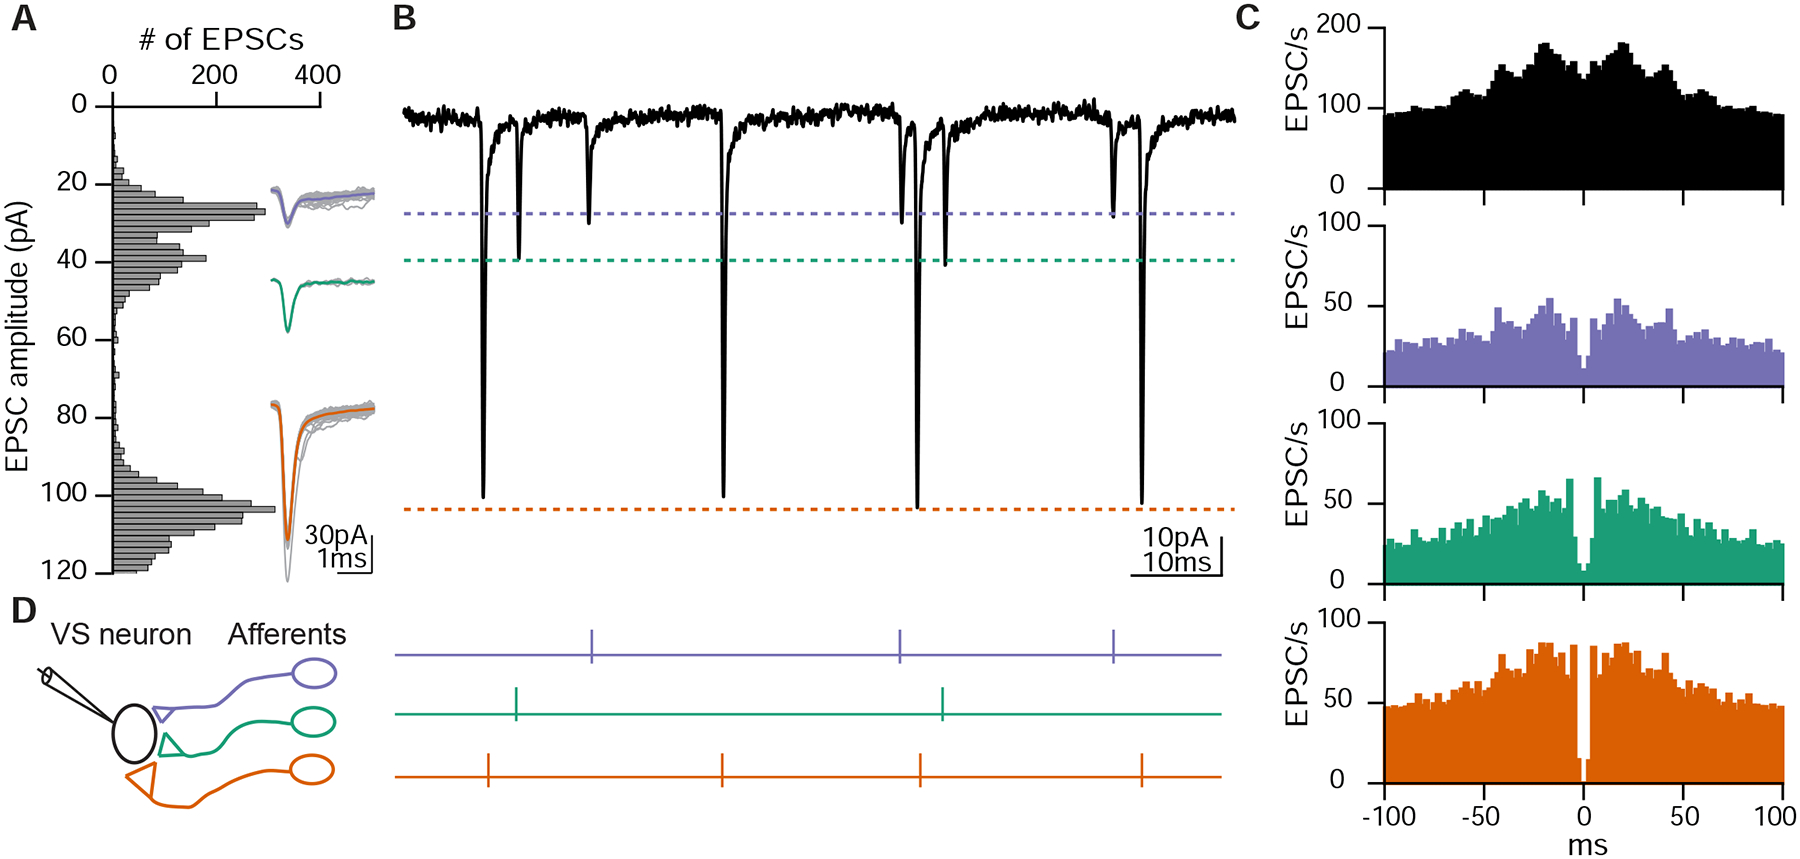
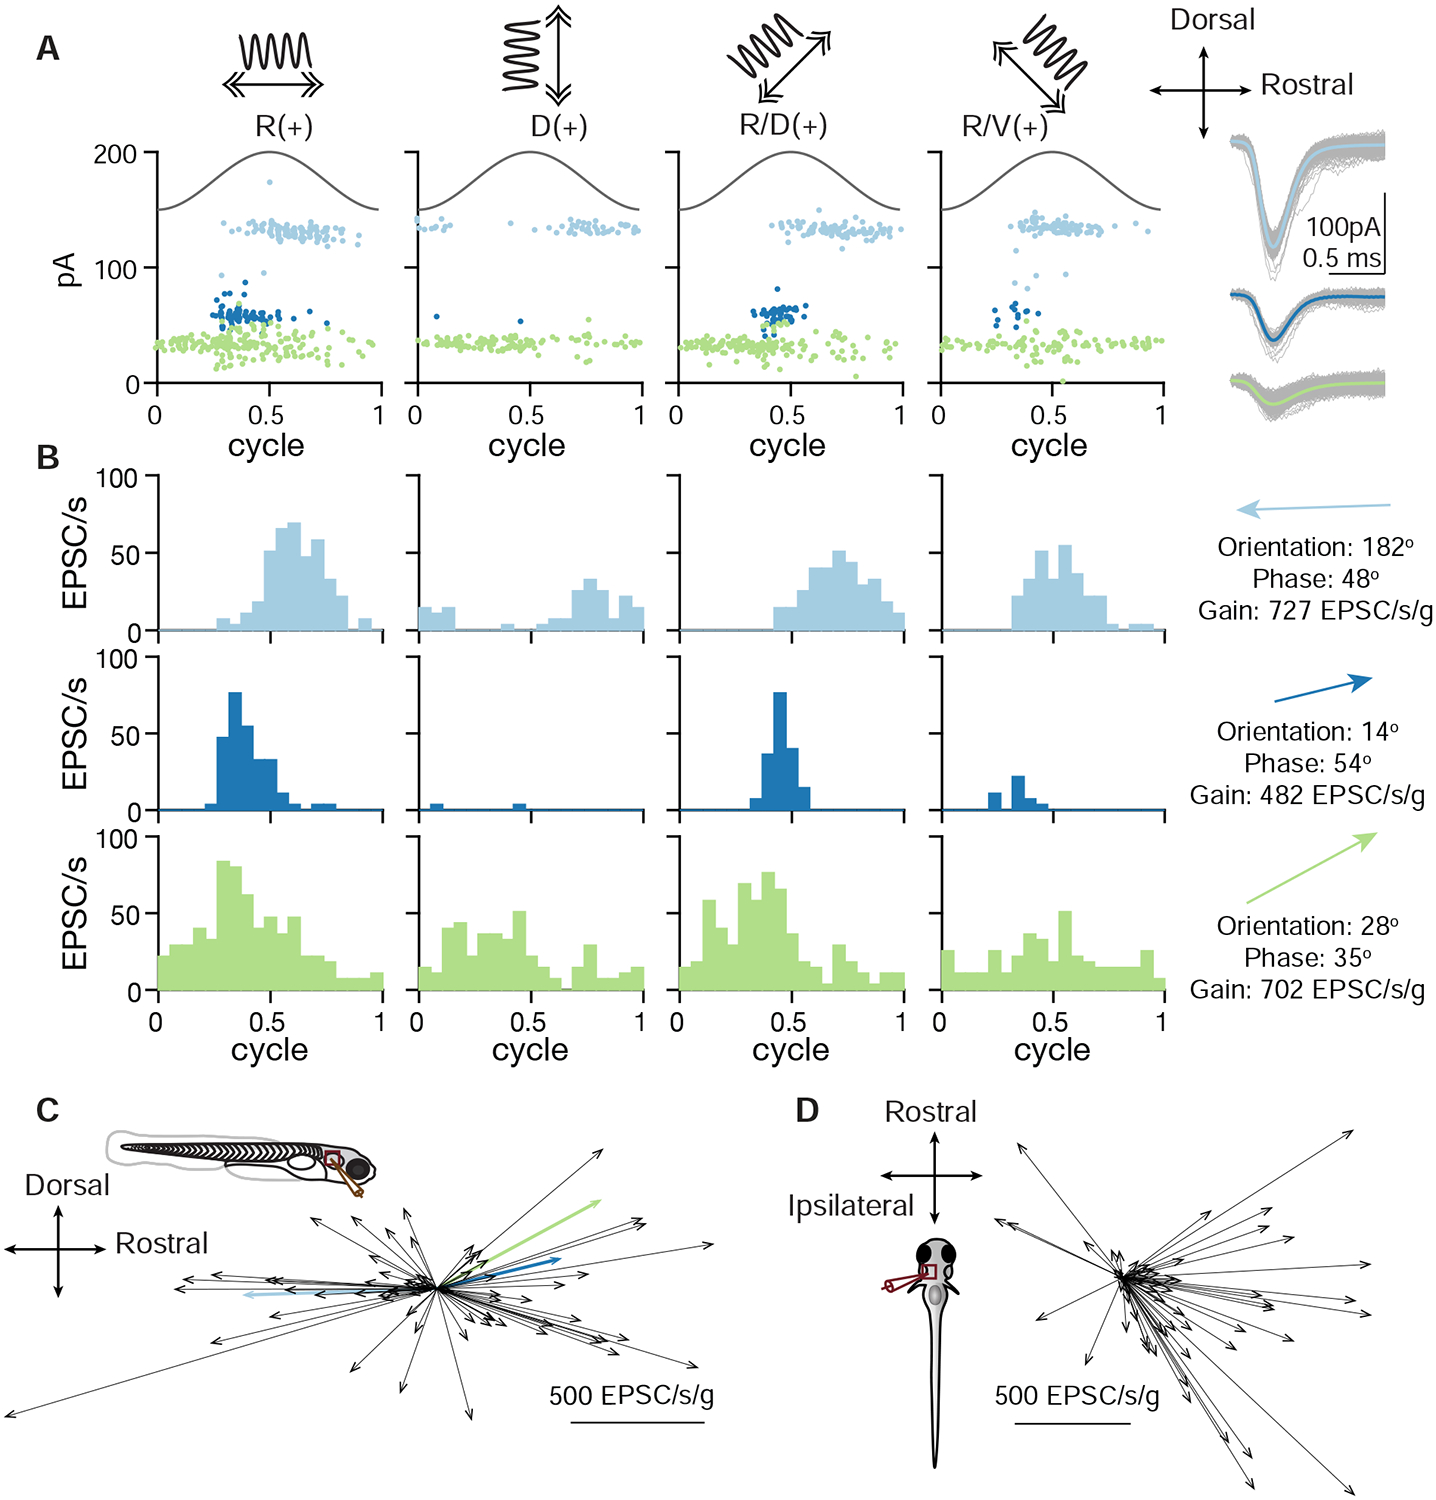
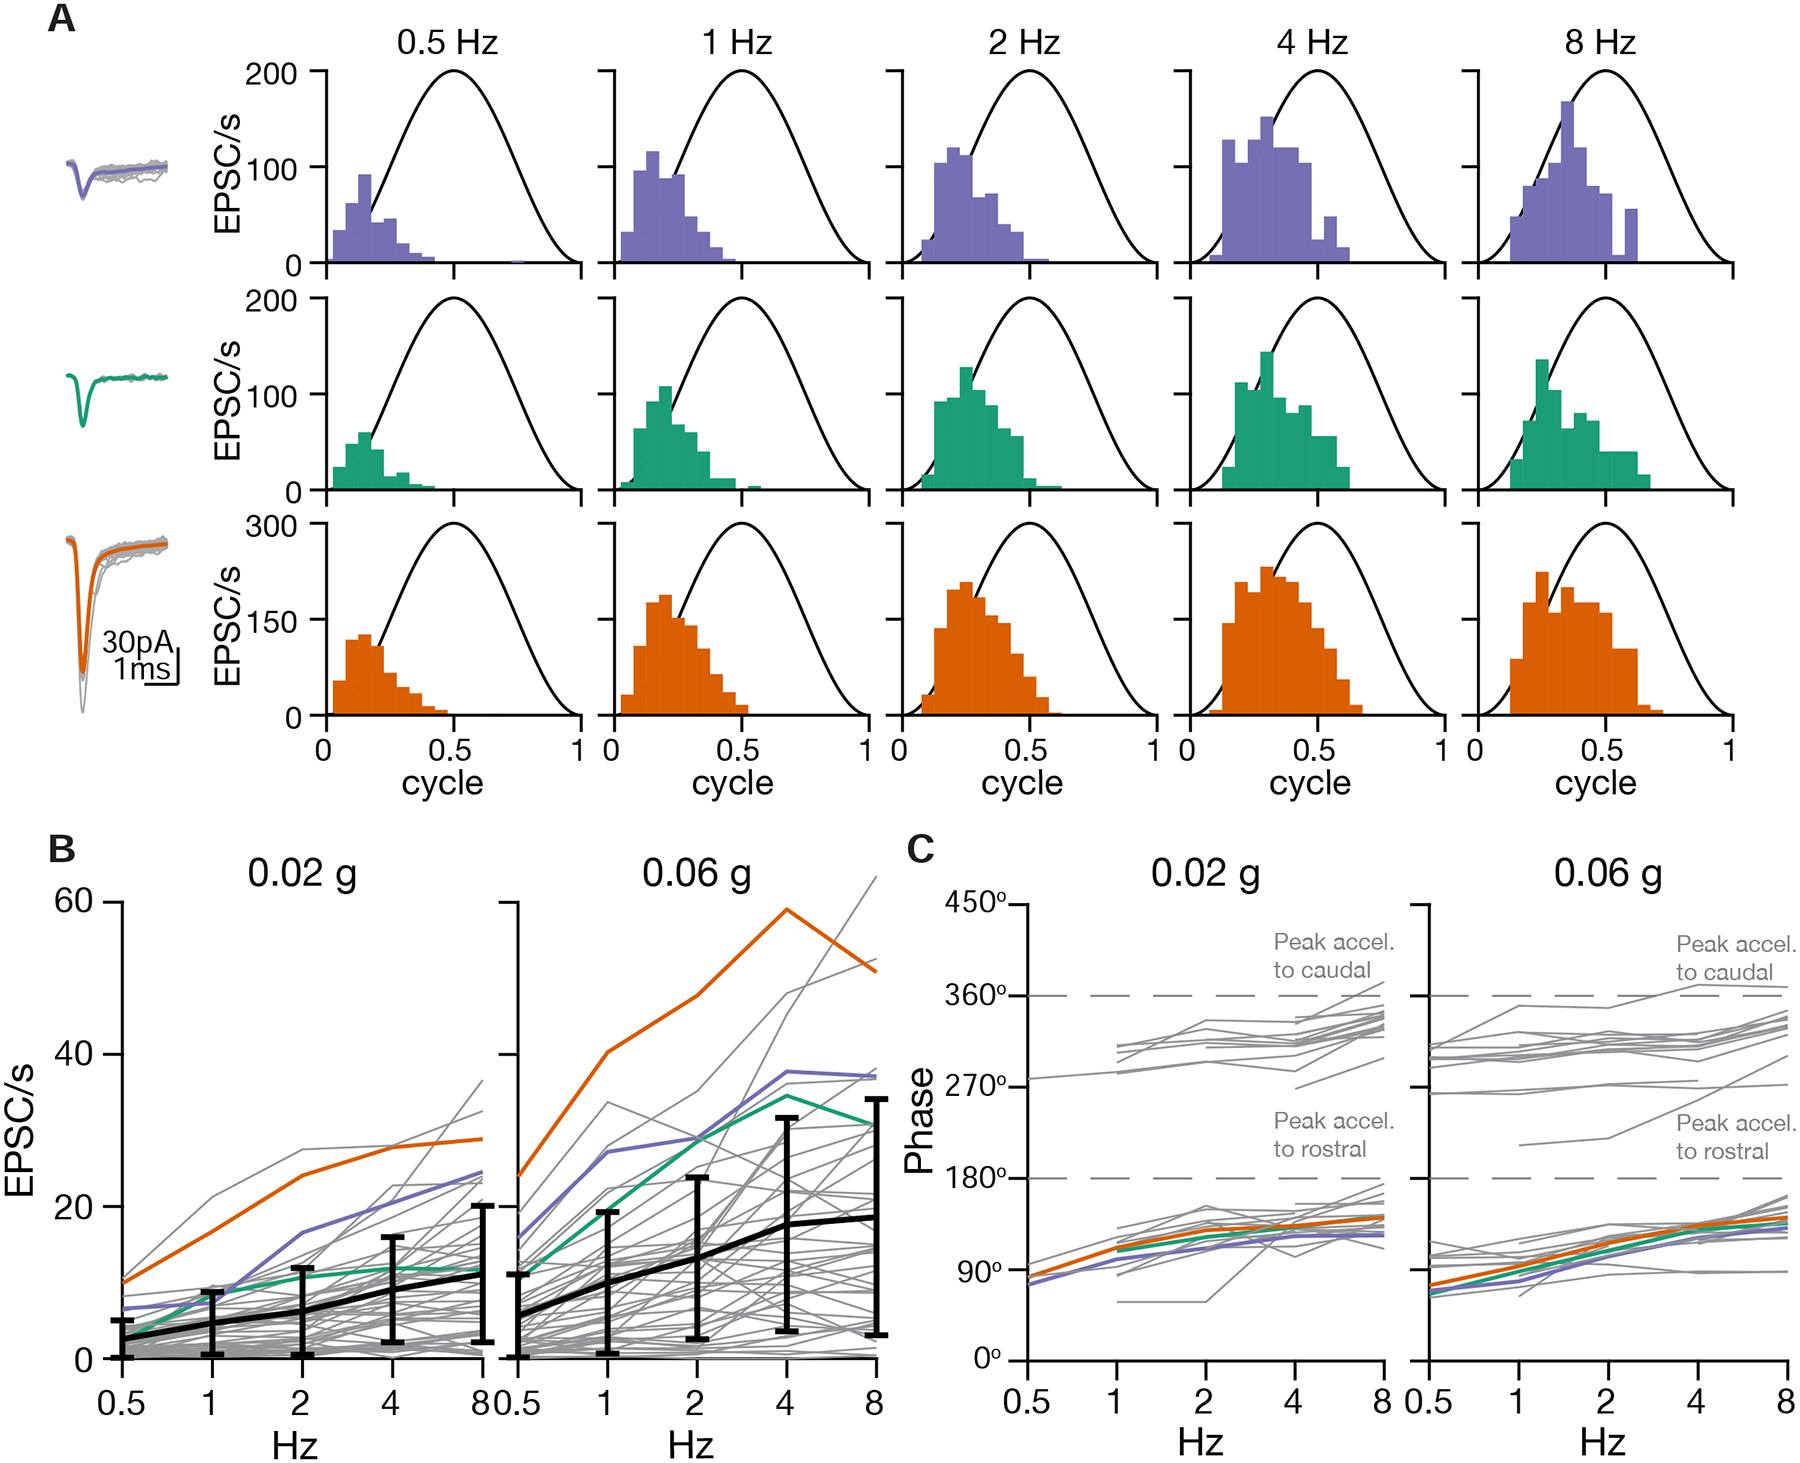
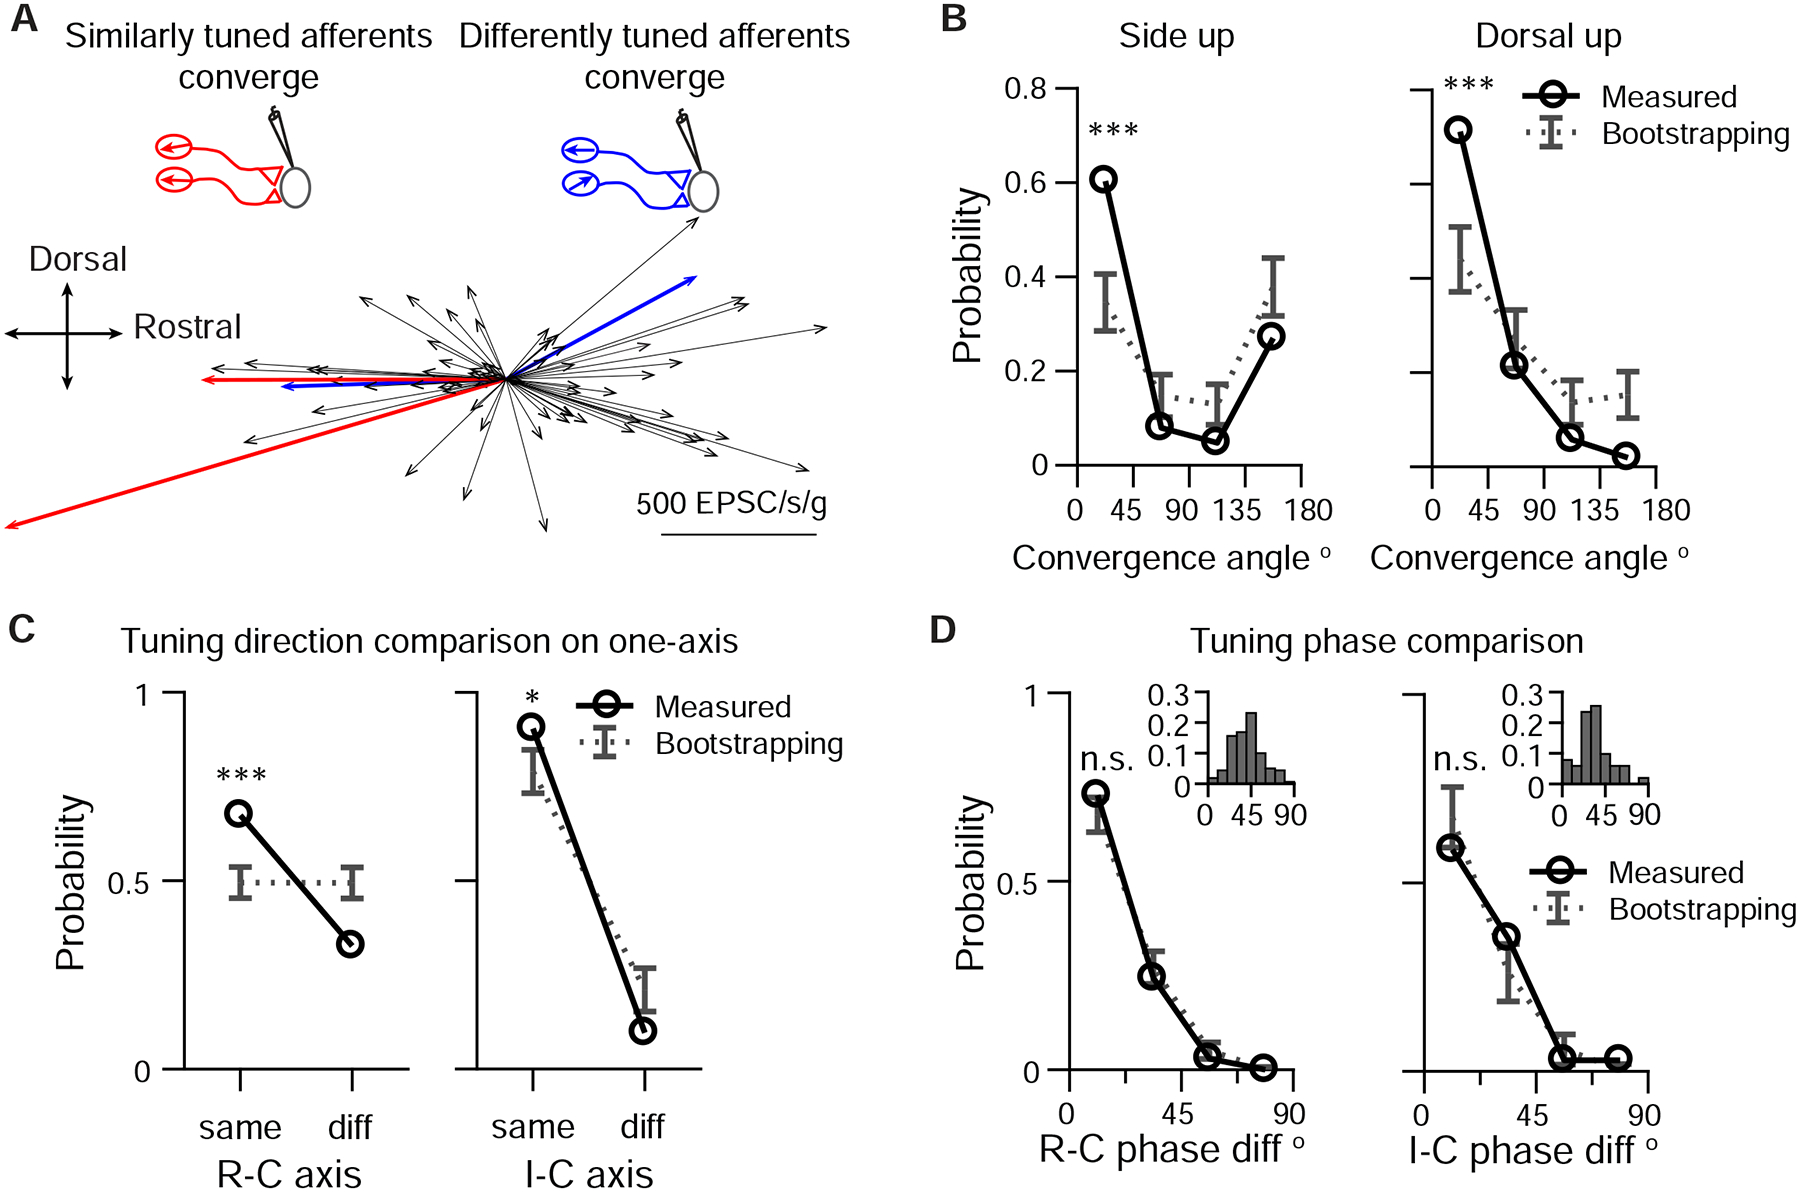
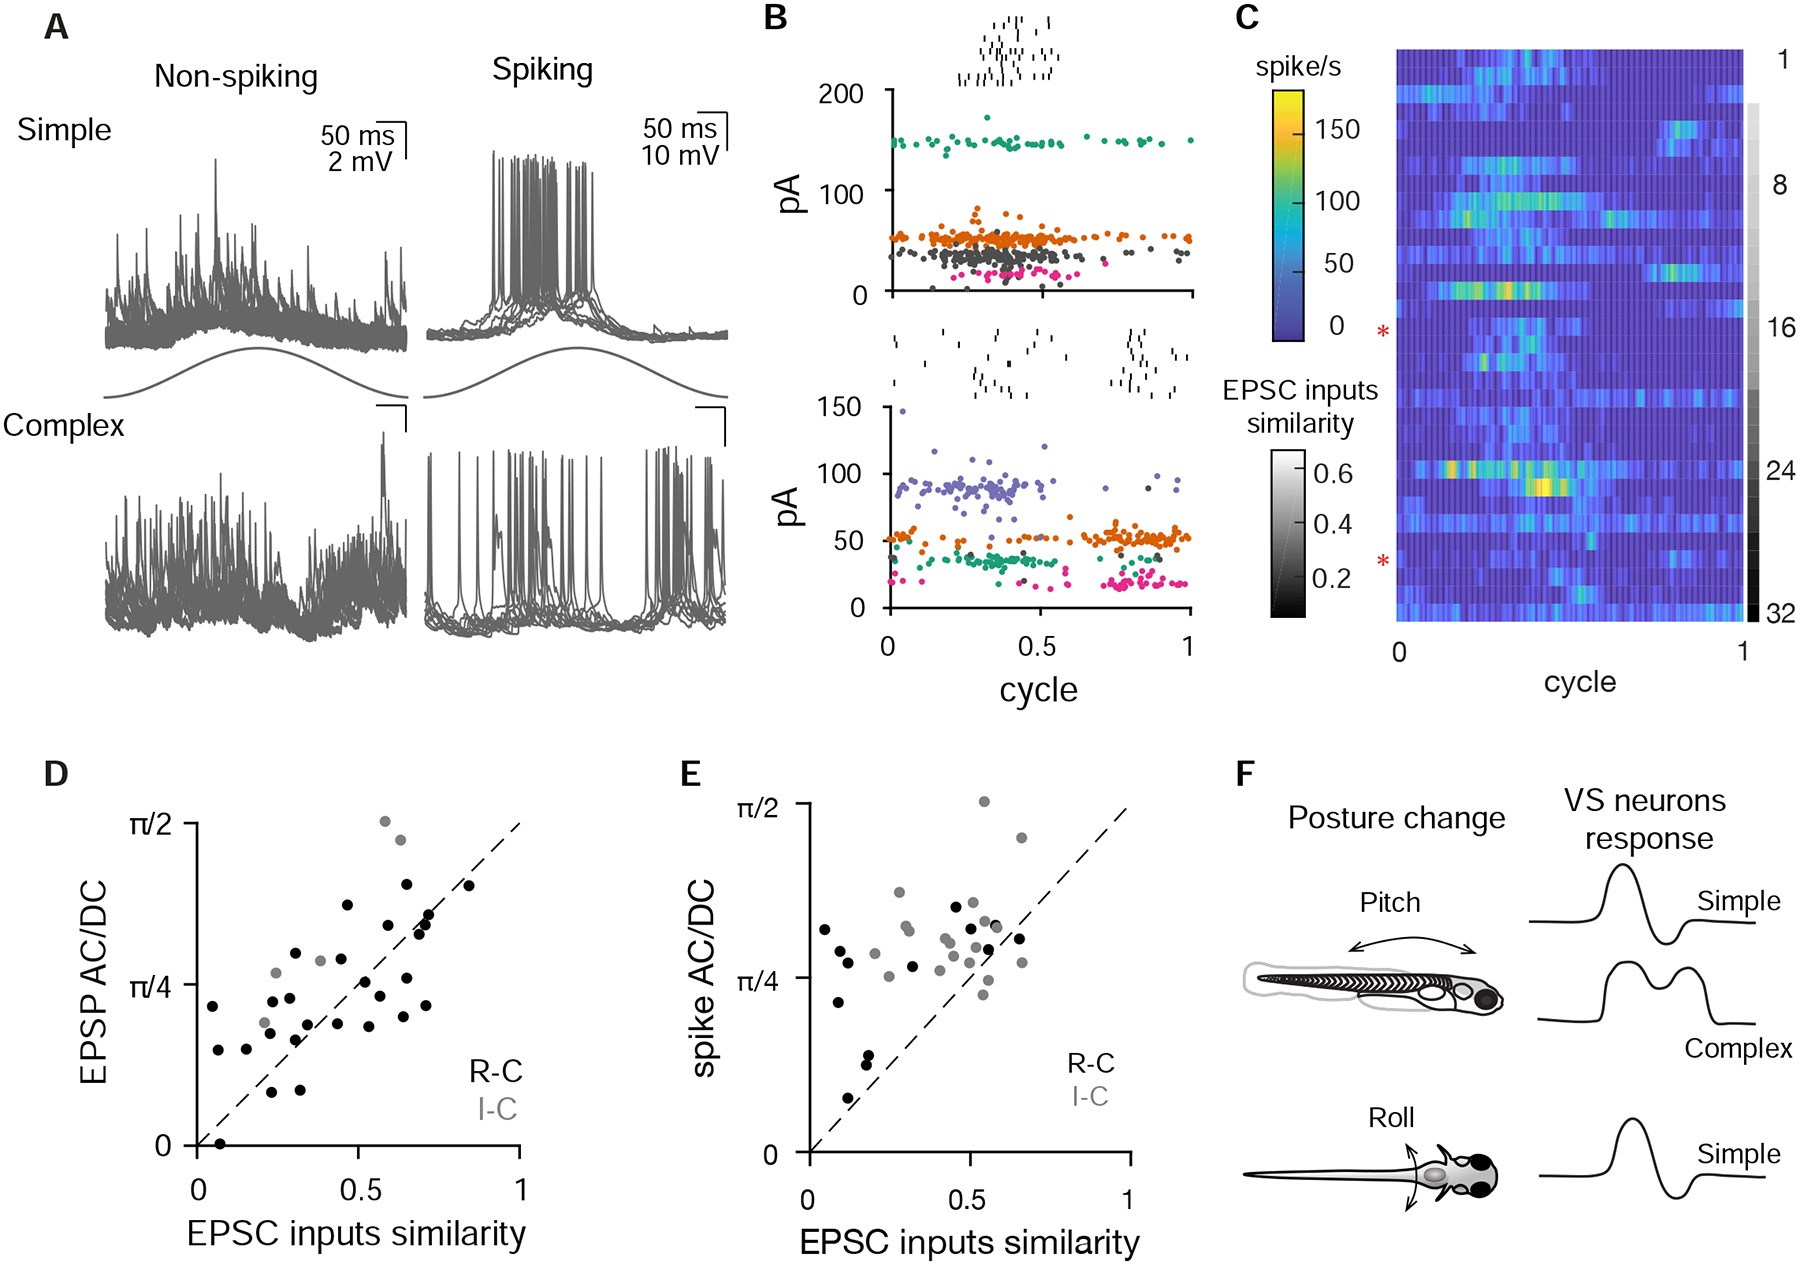
As sensory information moves through the brain, higher-order areas exhibit more complex tuning than lower areas. Though models predict that complexity arises via convergent inputs from neurons with diverse response properties, in most vertebrate systems, convergence has only been inferred rather than tested directly. Here, we measure sensory computations in zebrafish vestibular neurons across multiple axes in vivo. We establish that whole-cell physiological recordings reveal tuning of individual vestibular afferent inputs and their postsynaptic targets. Strong, sparse synaptic inputs can be distinguished by their amplitudes, permitting analysis of afferent convergence in vivo. An independent approach, serial-section electron microscopy, supports the inferred connectivity. We find that afferents with similar or differing preferred directions converge on central vestibular neurons, conferring more simple or complex tuning, respectively. Together, these results provide a direct, quantifiable demonstration of feedforward input convergence in vivo.

Keywords: body balance; electrical synapse; feedforward excitation; high-pass tuning; neural computation; sensorimotor transformation; sensory encoding; vestibulospinal neuron.


Conflict of interest statement

Declaration of Interests The authors declare no competing interests.

Figures

Figure 1:
Figure 1:
Sensory-evoked responses in vivo in vestibulospinal (VS) neurons A. Schematic representing in vivo patch clamp recording configuration and vestibular afferent circuit in larval zebrafish, U: utricle, HC: hair cells, VA: vestibular afferents, S: saccule. Inset, vestibular stimuli were delivered by a motorized table, acceleration direction indicated by the arrows and waveform by the sinusoidal curve. Solid, stimulus direction same as in B; dashed, other stimulus directions. B. Example recording trace from a VS neuron in voltage clamp (Vhold: −65 mV) during 2 Hz, 0.02 g translational movement on the R/V(+)-C/D(−) axis. Membrane current and EPSC frequency are modulated by the translational movement. Black, EPSCs; colored, acceleration (same as in A) in three body axes recorded by an accelerometer (red, (R)ostral[+]-(C)audal[−]; dark blue, (D)orsal[+]-(V)entral[-]; light blue, (I)psilateral[+]-(C)ontralateral[−]). C. Sensory-evoked EPSC responses to translation in four different directions for the same VS neuron as in B, across 12 cycles. Solid line, acceleration (2 Hz, 0.02 g). D. Tg(nefma:gal4; UAS:GFP) (green) colabels VS neurons identified by dye backfilling (magenta) from spinal cord. Scale bar: 5 μm E. Sensory responses of a VS neuron in the best direction in a rock solo −/− (left) and in a het/WT sibling (right). F. Summary of tuning index in the best direction for all VS neurons recorded in rock solo −/− (9 neurons, 5 fish) and siblings (15 neurons, 10 fish). Mann-Whitney U test, p=6.7e-4
Figure 2:
Figure 2:
Otolith afferent to VS neuron transmission is mediated by mixed electrical and chemical synapses A. Schematic of whole-cell recording configuration from VS neuron while electrically stimulating otolith afferents. B. Example EPSCs evoked by electrical stimulation of the otolith afferents; 105 EPSCs overlaid. Arrow indicates onset of stimulation. Stimulus artifact is blanked. C. Carbenoxolone (CBX) diminishes the fast component of evoked EPSCs while slower component remains. Average traces from an example VS neuron; pre-CBX, n=100; post-CBX, n=100. D. NBQX abolishes the second, slower component of evoked EPSCs without diminishing the early component. Pre-NBQX, n=349; post-NBQX, n=333. E. Group data quantifying the reduction of early EPSC amplitude by CBX, n=10. F. Group data quantifying the total charge transfer that is abolished by NBQX application, n=7. G. Example EM image of gap junction between identified otolith afferent (pseudocolored purple) and VS neuron (peach), recognizable by the tight apposition of membranes to the exclusion of extracellular space,. Scale bar: 200 nm. H. Example EM image of chemical synapse between otolith afferent (purple) and VS neuron (peach), characterized by the presence of synaptic vesicles, postsynaptic density, and parallel membranes at the cleft. Scale bar: 200 nm.
Figure 3:
Figure 3:
Distinct EPSC amplitudes reflect individual afferent inputs A. Histogram of spontaneous and sensory-evoked EPSC amplitude distribution of the same VS neuron as Fig. 1B. Inset, overlay of individual EPSCs (gray) and average (colored) for each amplitude bin. B. Example trace of EPSCs exhibiting stereotypic shapes and amplitudes in three clusters, corresponding to each amplitude bin in A. C. Auto-correlogram of all EPSCs recorded from the VS neuron (top, black) or divided into three clusters based on EPSC amplitudes (bottom, colored). Note EPSC activities around 0 ms only appears across all EPSCs, but not within each cluster. D. Schematic of three different otolith afferents converging onto one VS neuron, each eliciting EPSCs with a distinct amplitude (represented by different synaptic sizes). Right, spike activities of three afferents inferred from B.
Figure 4:
Figure 4:
Anatomical reconstructions reveal a similar convergence pattern as physiology A. Serial-section EM reconstruction (lateral view) of all myelinated utricular afferents (blues) and VS neurons (browns) on the right side of one animal (5.5 dpf). Inset, identified synaptic contacts between afferents and VS neurons (red). Color scale represents number of distinct afferents synapsing with a given VS neuron (browns). VS neurons with greater number of afferent inputs are located more ventrally. B. Dorsal view of the same reconstruction as in A. Color scale represents number of VS neurons contacted by a given afferent (blues). C. Number of distinct synaptic contacts from each utricular afferent onto each VS neuron, based on serial-section EM reconstruction. D. Histogram of the numbers of distinct afferents converging onto each VS neuron, as measured by serial-section EM reconstruction (11 neurons, 1 fish) E. Histogram of the numbers of distinct afferents converging onto each VS neuron, as inferred from whole-cell physiology recording (104 neurons, 89 fish)
Figure 5:
Figure 5:
Spatial tuning of inferred otolith afferents A. EPSC responses of an example neuron in response to 2 Hz, 0.02 g translational stimuli (solid sinusoidal line, acceleration) along 4 different axes (top, arrows). Each dot represents one EPSC; note three EPSC clusters with distinct amplitudes. Right, overlay of individual EPSCs (gray) and average (colored) for each cluster. B. EPSC tuning of three clusters. Right, vectors representing the maximum tuning direction, phase, and gain of each inferred afferent corresponding to an EPSC cluster. C. Maximum tuning directions of all afferents from VS neurons recorded from fish oriented side-up. Colored arrows represent tuning of afferents in B (69 afferents, 43 neurons, 33 fish). D. Maximum tuning directions of all inferred afferents from VS neurons recorded from fish oriented dorsal-up (60 afferents, 36 neurons, 36 fish).
Figure 6:
Figure 6:
Temporal tuning of inferred otolith afferents A. Sensory tuning of afferent inputs to one VS neuron during translational movement at 5 different frequencies in the R(+)-C(−) axis. Left, EPSC waveforms of three different clusters recorded from one VS neuron. Right, temporal tuning profile of each EPSC cluster on the R-C axis. B. Gains of inferred afferents across different frequencies of translational acceleration. Gray, individual afferents; colored, afferents from A; black, mean and standard deviation of gains from all afferents (0.02 g, 48 afferents; 0.06 g: 46 afferents; 25 neurons, 20 fish) C. Phases of inferred afferents across frequencies, relative to the sinusoidal stimulus. 180° (0.5 cycle in A) represents the peak of acceleration towards rostral direction; 360° represents the peak of acceleration towards caudal direction (0 or 1 cycle in A). Data were thresholded to only include afferents whose gain was > 5 EPSC/s (0.02 g, 36 afferents; 0.06 g, 38 afferents; 25 neurons, 20 fish)
Figure 7:
Figure 7:
Afferents with similar tuning direction preferentially converge A. Example of two pairs of converging afferents from two VS neurons in side-up fish. Red, converging afferents are similarly tuned, with small converging angle between the pair; Blue: converging afferents are differently tuned, with large convergent angle between the pair. B. Probability distribution of converging angles for measured and randomly generated afferents pairs in side-up fish and dorsal-up fish. Two tailed z-test, side up, 0–45°: p=2e-5, 135–180°: p=0.08. (63 afferent pairs); dorsal up, 0–45°: p=8e-5, 135–180°: p=0.007. (52 afferent pairs) C. Probability distribution of converging afferents tuned to the same direction vs different direction, on the R-C and I-C axis. Two tailed z-test, R-C, same: p=1e-5, diff: p=4e-5 (150 afferent pairs); I-C, same: p=0.044, diff: p=0.044 (52 afferent pairs). D. Probability distribution of phase difference for converging afferents, on the R-C and I-C axis. Two tailed z-test, R-C, 0–22.5° p=0.26 (103 afferent pairs); I-C, 0–22.5°, p=0.28 (34 afferent pairs). Inset: distribution of tuning phase of afferents, R-C, 177 afferents; I-C, 60 afferents; 90° represents the peak of acceleration of preferred direction (2 Hz, 0.02 g).
Figure 8:
Figure 8:
Complex central tuning arises from divergent afferent inputs A. Example subthreshold and spiking responses from VS neurons with simple tuning (top) or more complex, multi-phase responses (bottom) during 2 Hz, 0.02 g translational movement (11–12 cycles overlaid). B. Example spiking cells (same as in A), showing that simple (top) and complex (bottom) spiking tuning response are constructed from afferent inputs with similar and different tuning directions, respectively. At top (black) is the sensory-evoked spike raster. Colored and gray dots represent sensory-evoked EPSCs; all the EPSCs with the same color in a panel are inferred to arise from the same afferent. Gray, EPSCs that are not necessarily from individual afferents, based on the absence of clear refractory period structure in autocorrelogram. EPSCs and rasters are from 11–12 cycles. C. Average spiking rate of VS neurons during a cycle of sensory stimulation, ranked from more similar EPSC inputs to more different EPSC inputs, n=32. Red asterisks label the example spiking simple and complex VS neuron in A and B. D. Correlation of EPSC inputs similarity index and EPSP AC/DC response ratio (see Methods), for all non-spiking VS neurons with multiple convergent afferents. Sensory tuning of afferent inputs and EPSPs was measured on the R-C axis (black, n=27) and I-C axis (grey, n=5). Dashed, unity line. R: 0.67, p=2.9e-5 E. Correlation of EPSC input similarity index and spike activity AC/DC ratio, for all spiking VS neurons on the R-C axis (black, n=13 recordings) and I-C axis (gray, n=19). Dashed, unity line. R: 0.48, p=5.5e-3. F. Summary of different VS neuron responses to posture change on the pitch and roll axes.

References

    1. AKROUH A & KERSCHENSTEINER D 2013. Intersecting Circuits Generate Precisely Patterned Retinal Waves. Neuron, 79, 322–334. - PMC - PubMed
    1. ALONSO JM & MARTINEZ LM 1998. Functional connectivity between simple cells and complex cells in cat striate cortex. Nature Neuroscience, 1, 395–403. - PubMed
    1. ANGELAKI DE 1992. SPATIOTEMPORAL CONVERGENCE (STC) IN OTOLITH NEURONS. Biological Cybernetics, 67, 83–96. - PubMed
    1. ANGELAKI DE, BUSH GA & PERACHIO AA 1993. 2-DIMENSIONAL SPATIOTEMPORAL CODING OF LINEAR ACCELERATION IN VESTIBULAR NUCLEI NEURONS. Journal of Neuroscience, 13, 1403–1417. - PMC - PubMed
    1. ANGELAKI DE & CULLEN KE 2008. Vestibular system: The many facets of a multimodal sense. Annual Review of Neuroscience, 31, 125–150. - PubMed

Publication types