. 2020 Oct 1;183(1):211-227.e20.
doi: 10.1016/j.cell.2020.08.032. Epub 2020 Sep 15.

A Genetically Defined Compartmentalized Striatal Direct Pathway for Negative Reinforcement

Affiliations

A Genetically Defined Compartmentalized Striatal Direct Pathway for Negative Reinforcement

Xiong Xiao et al. Cell. .

Abstract

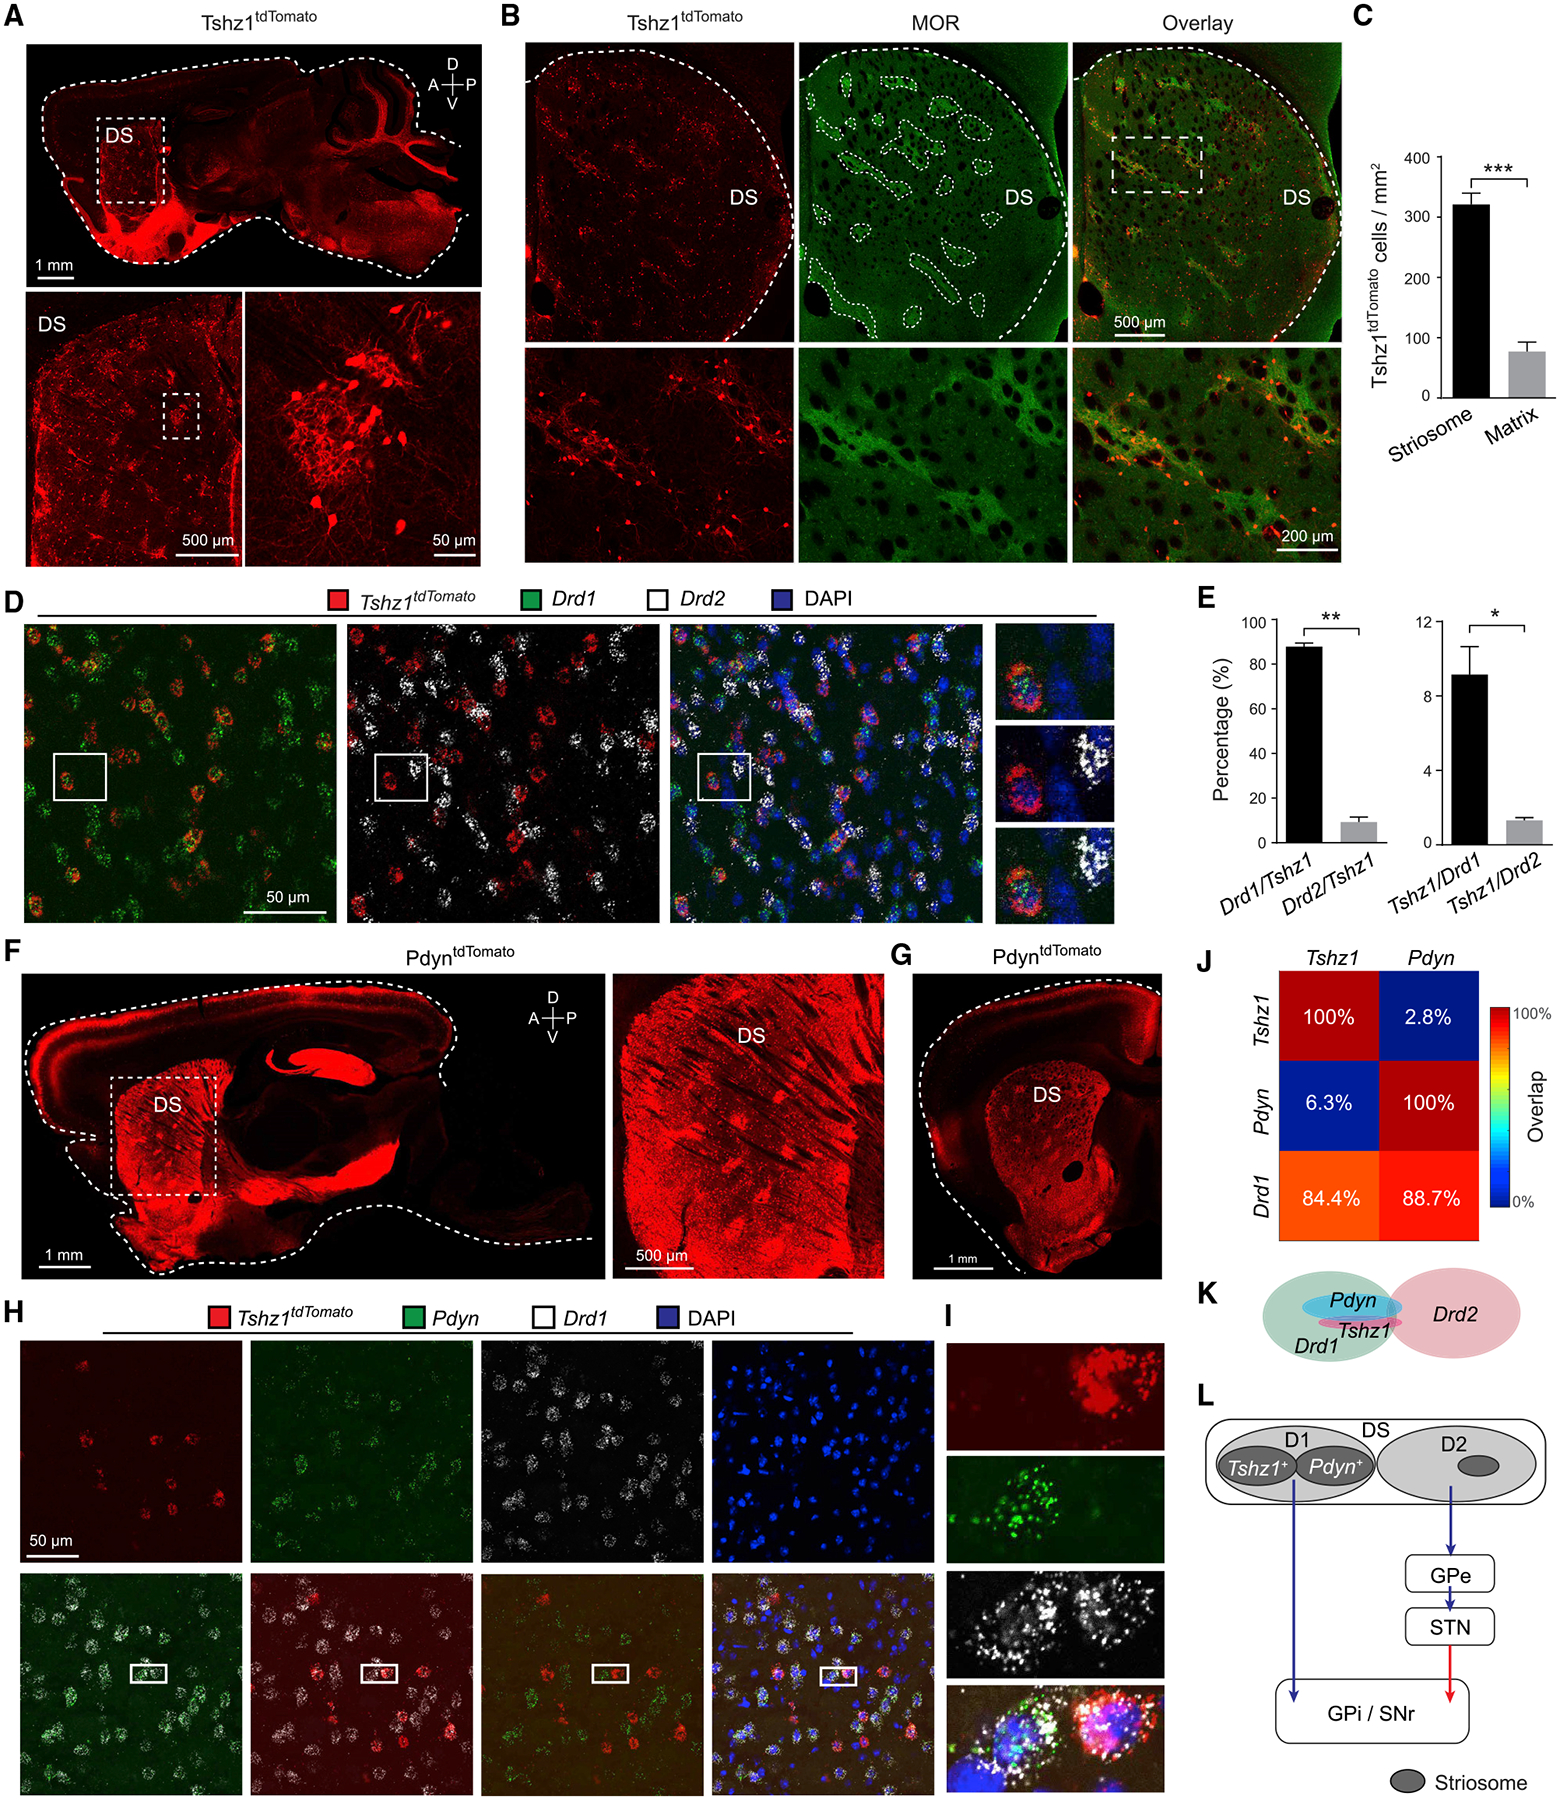
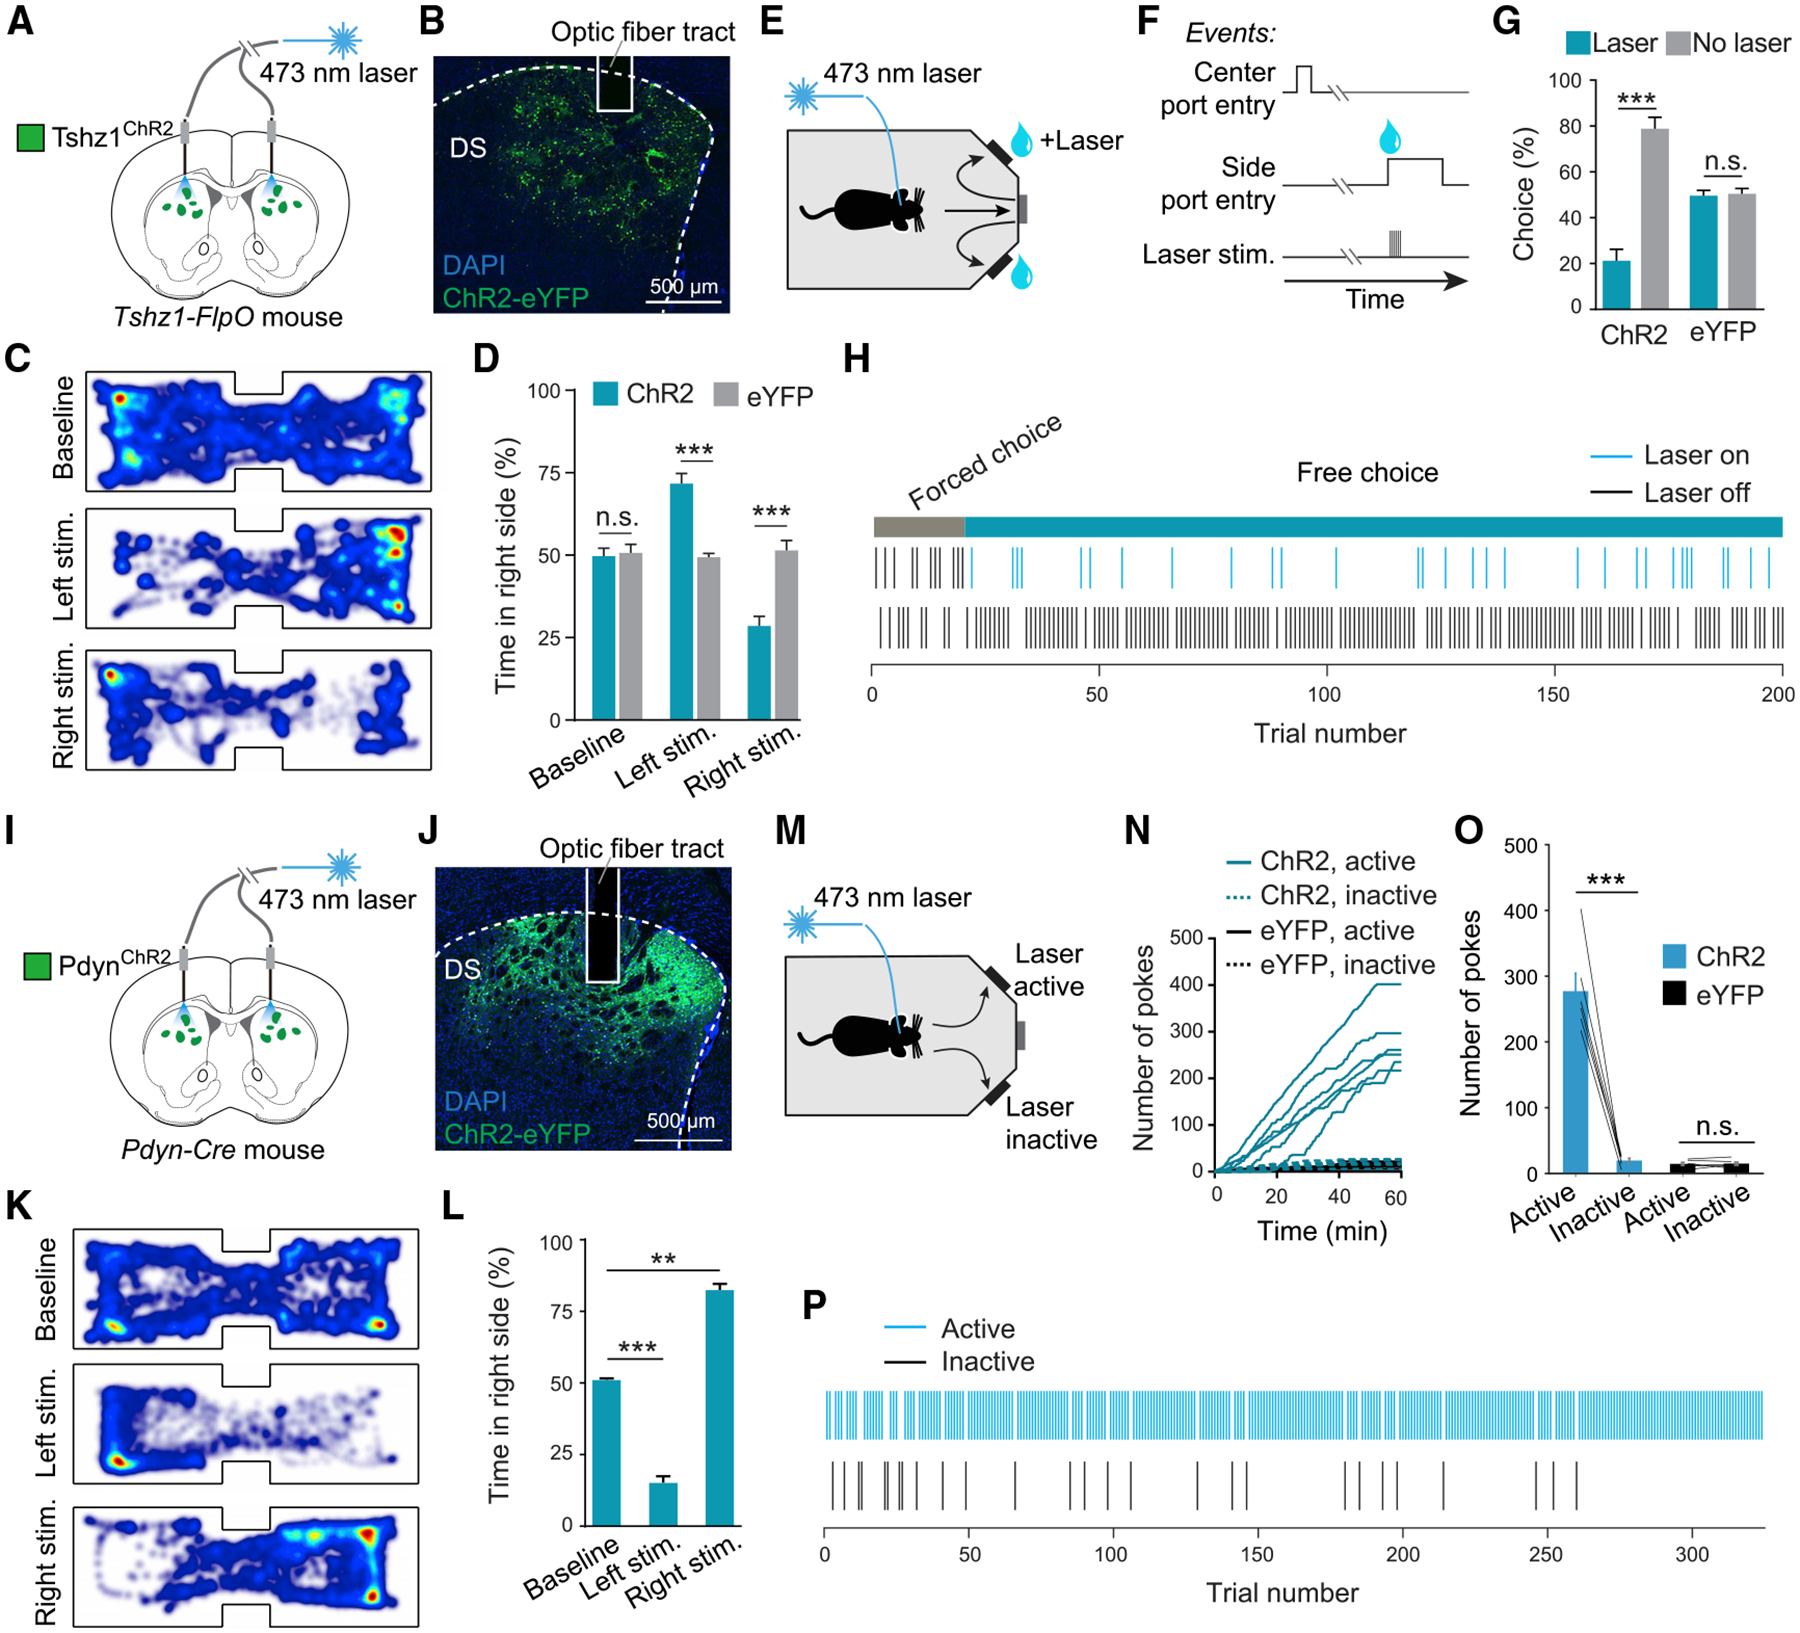
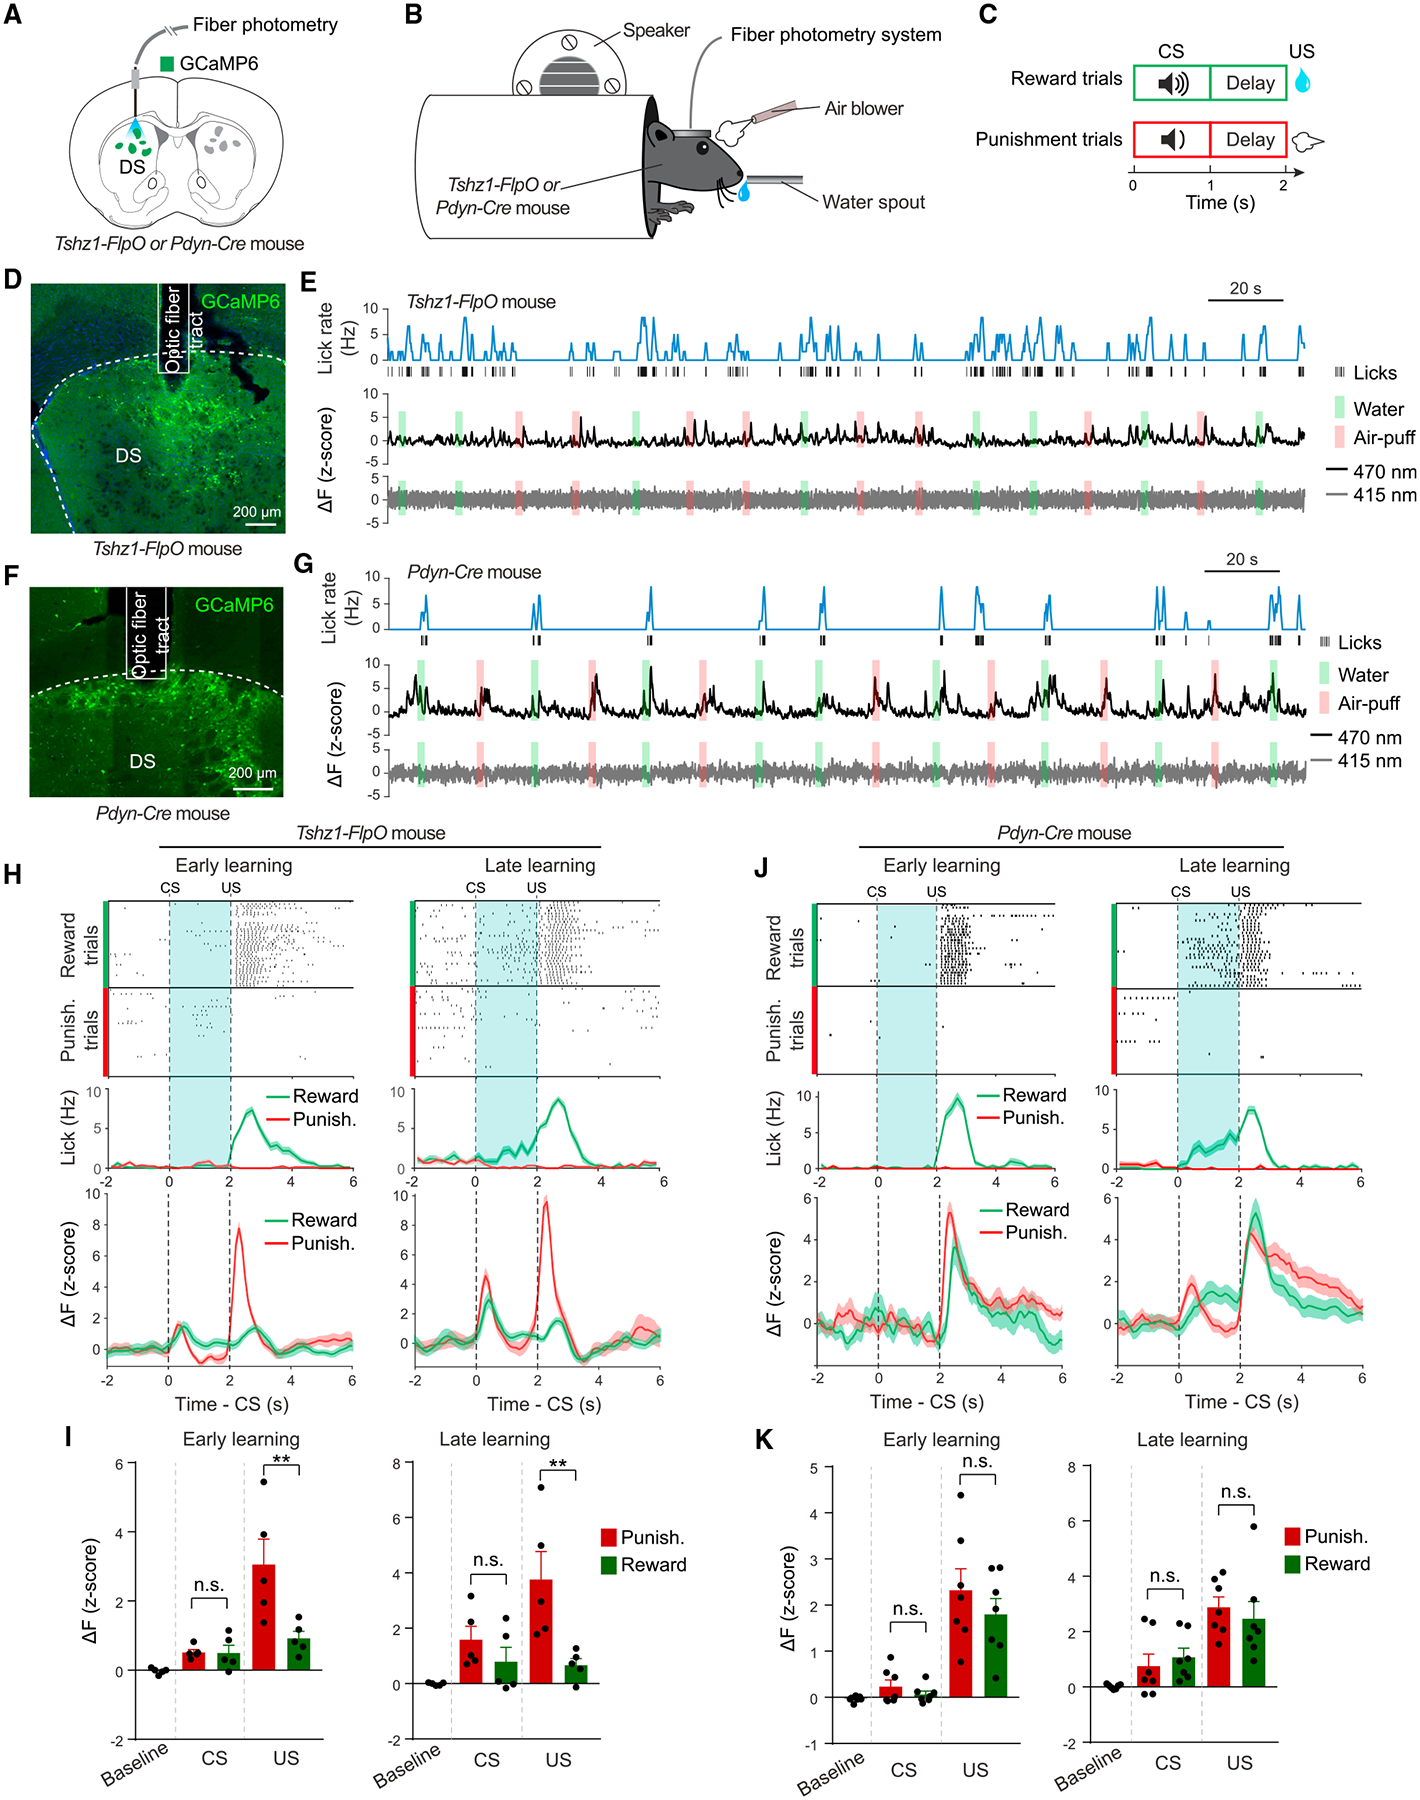
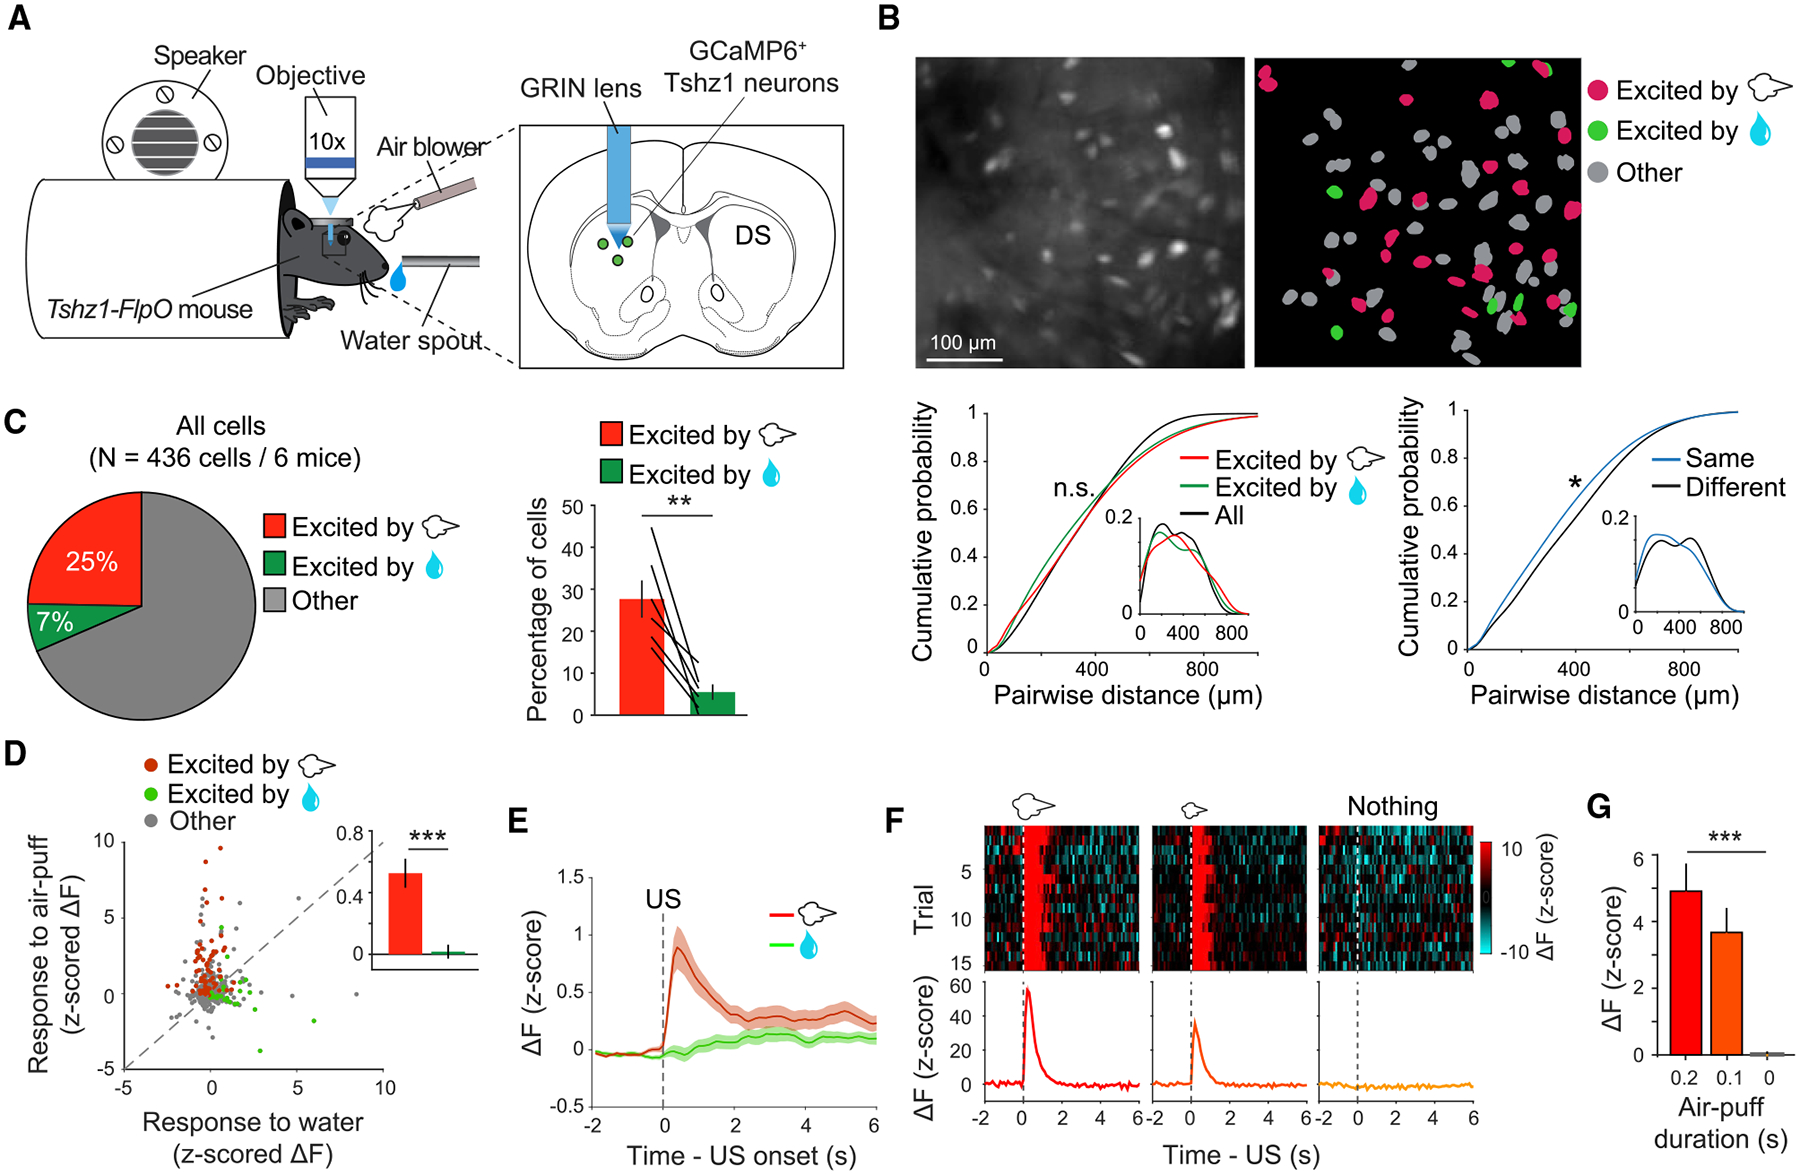
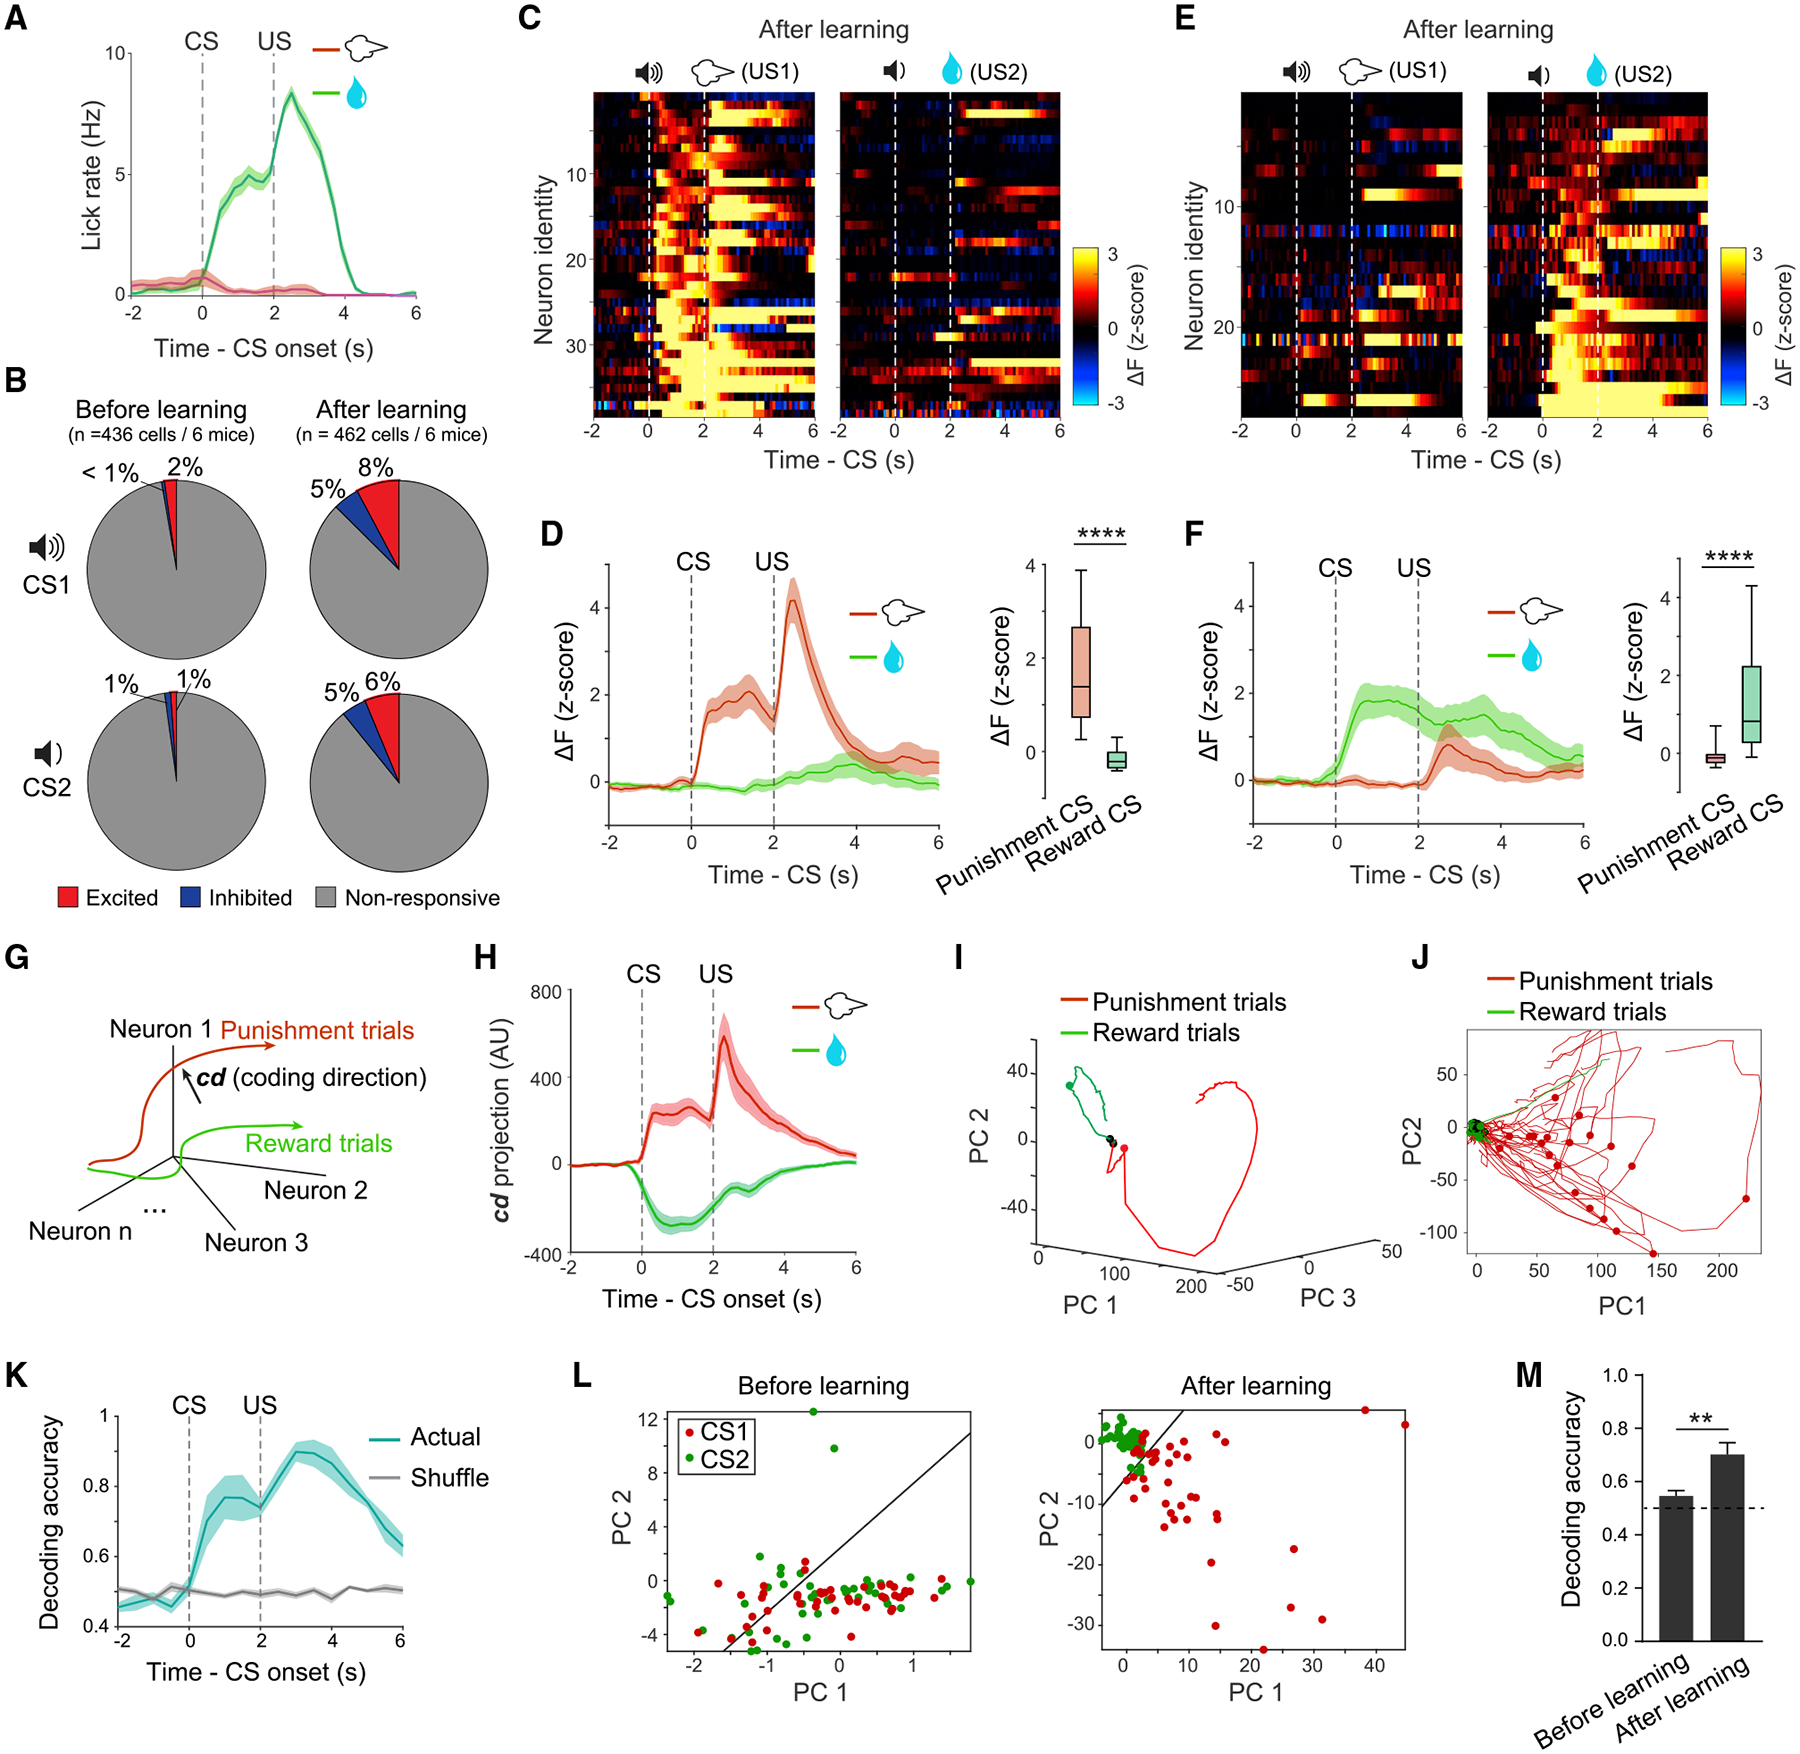
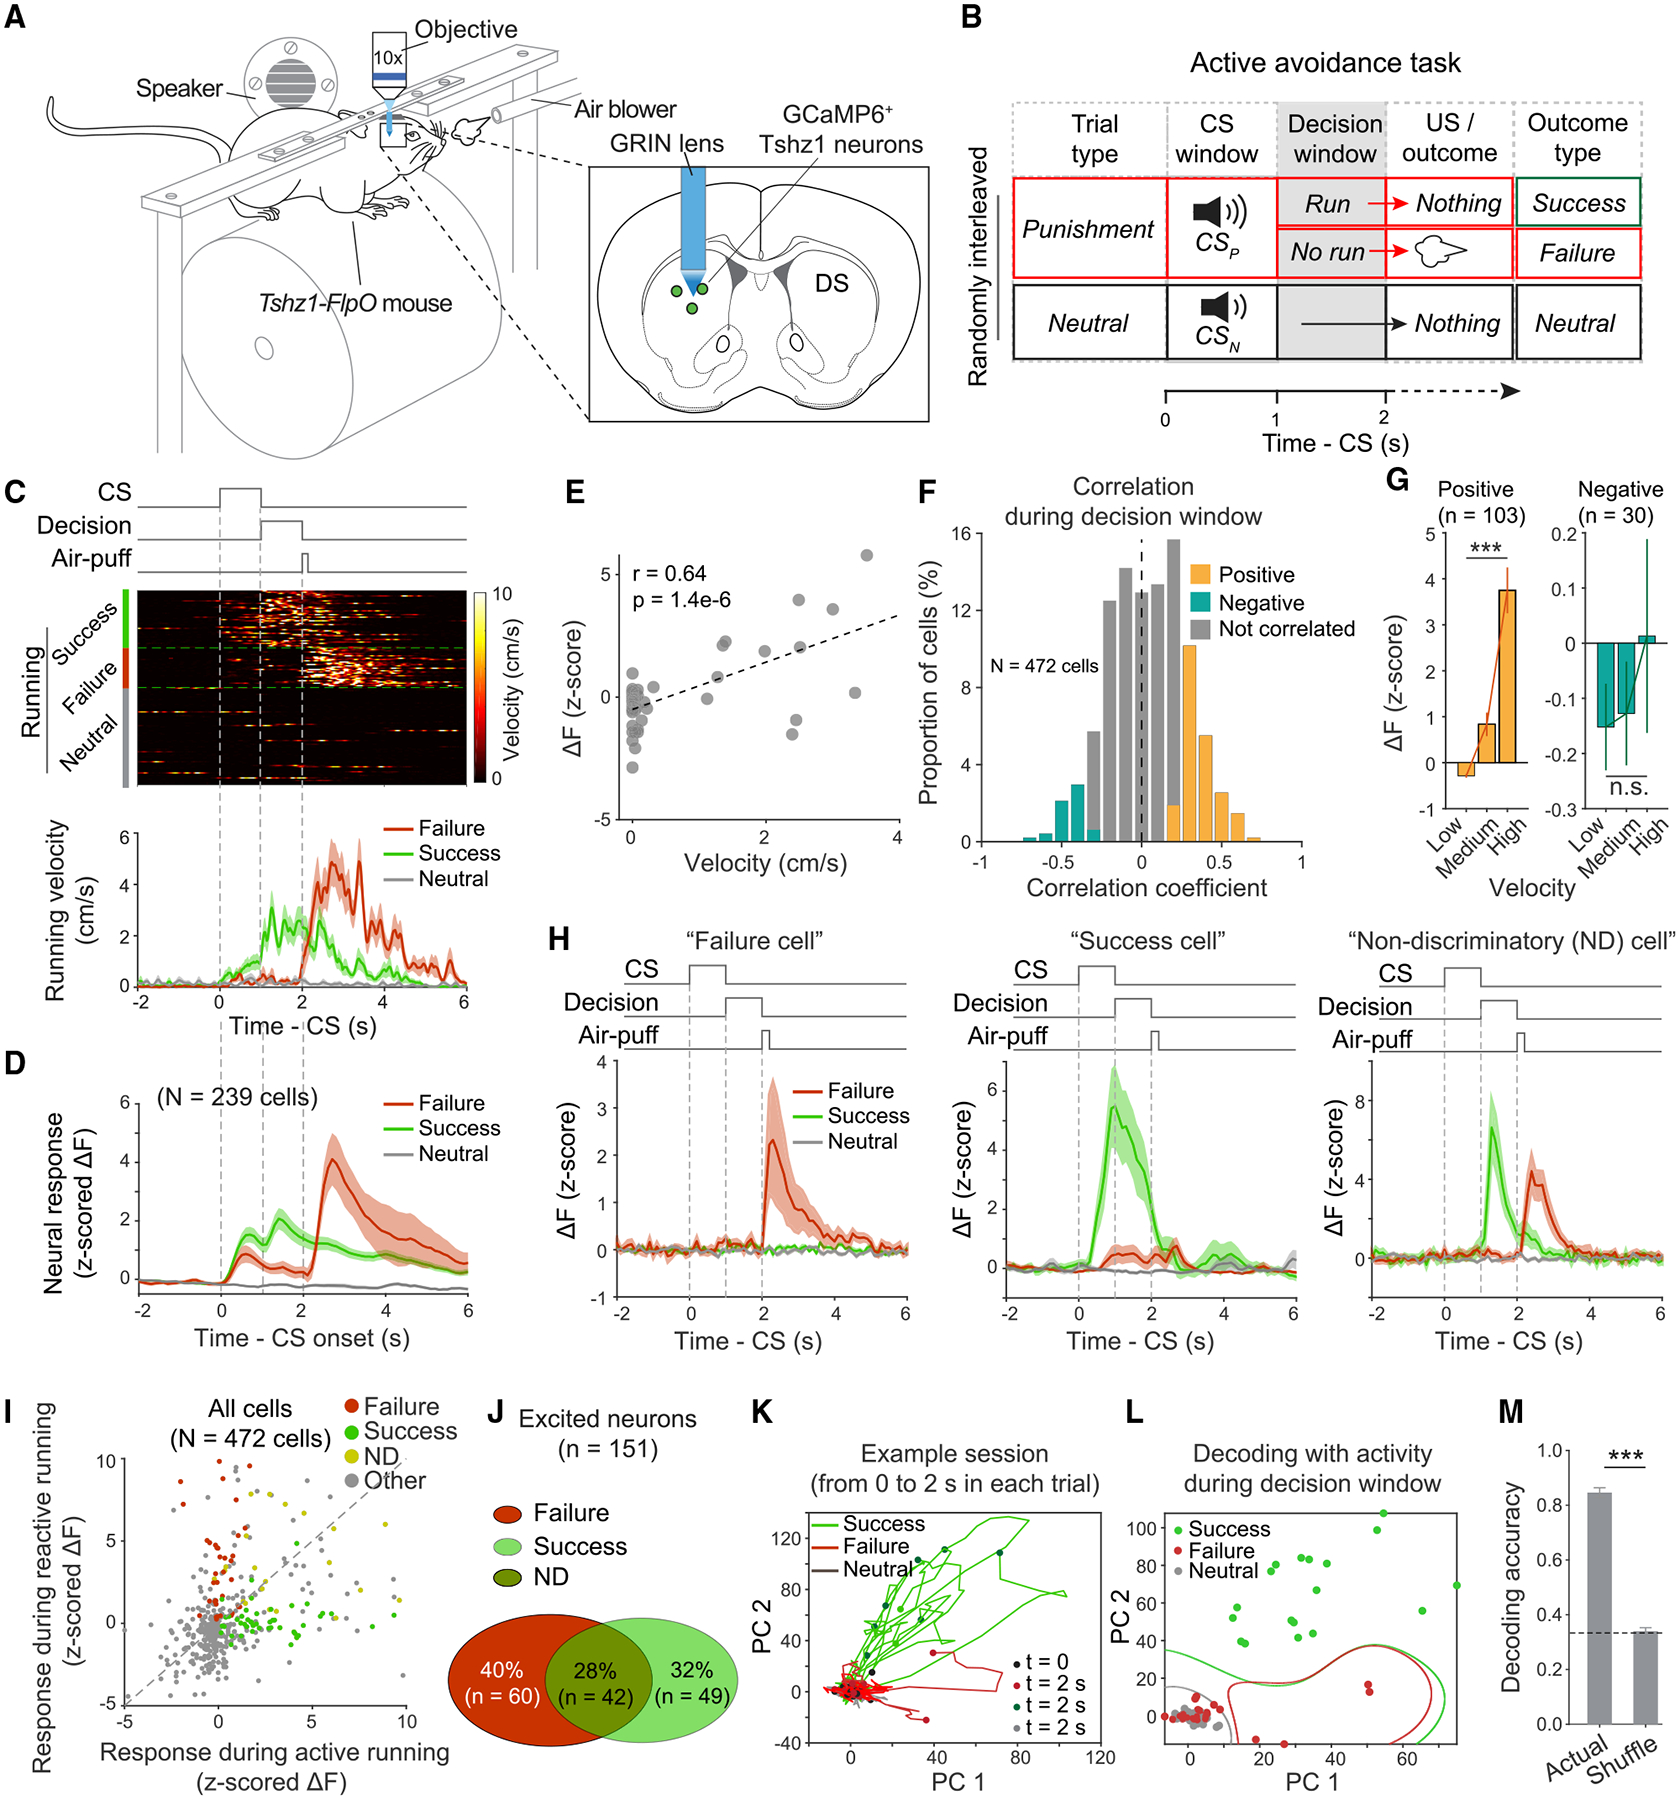
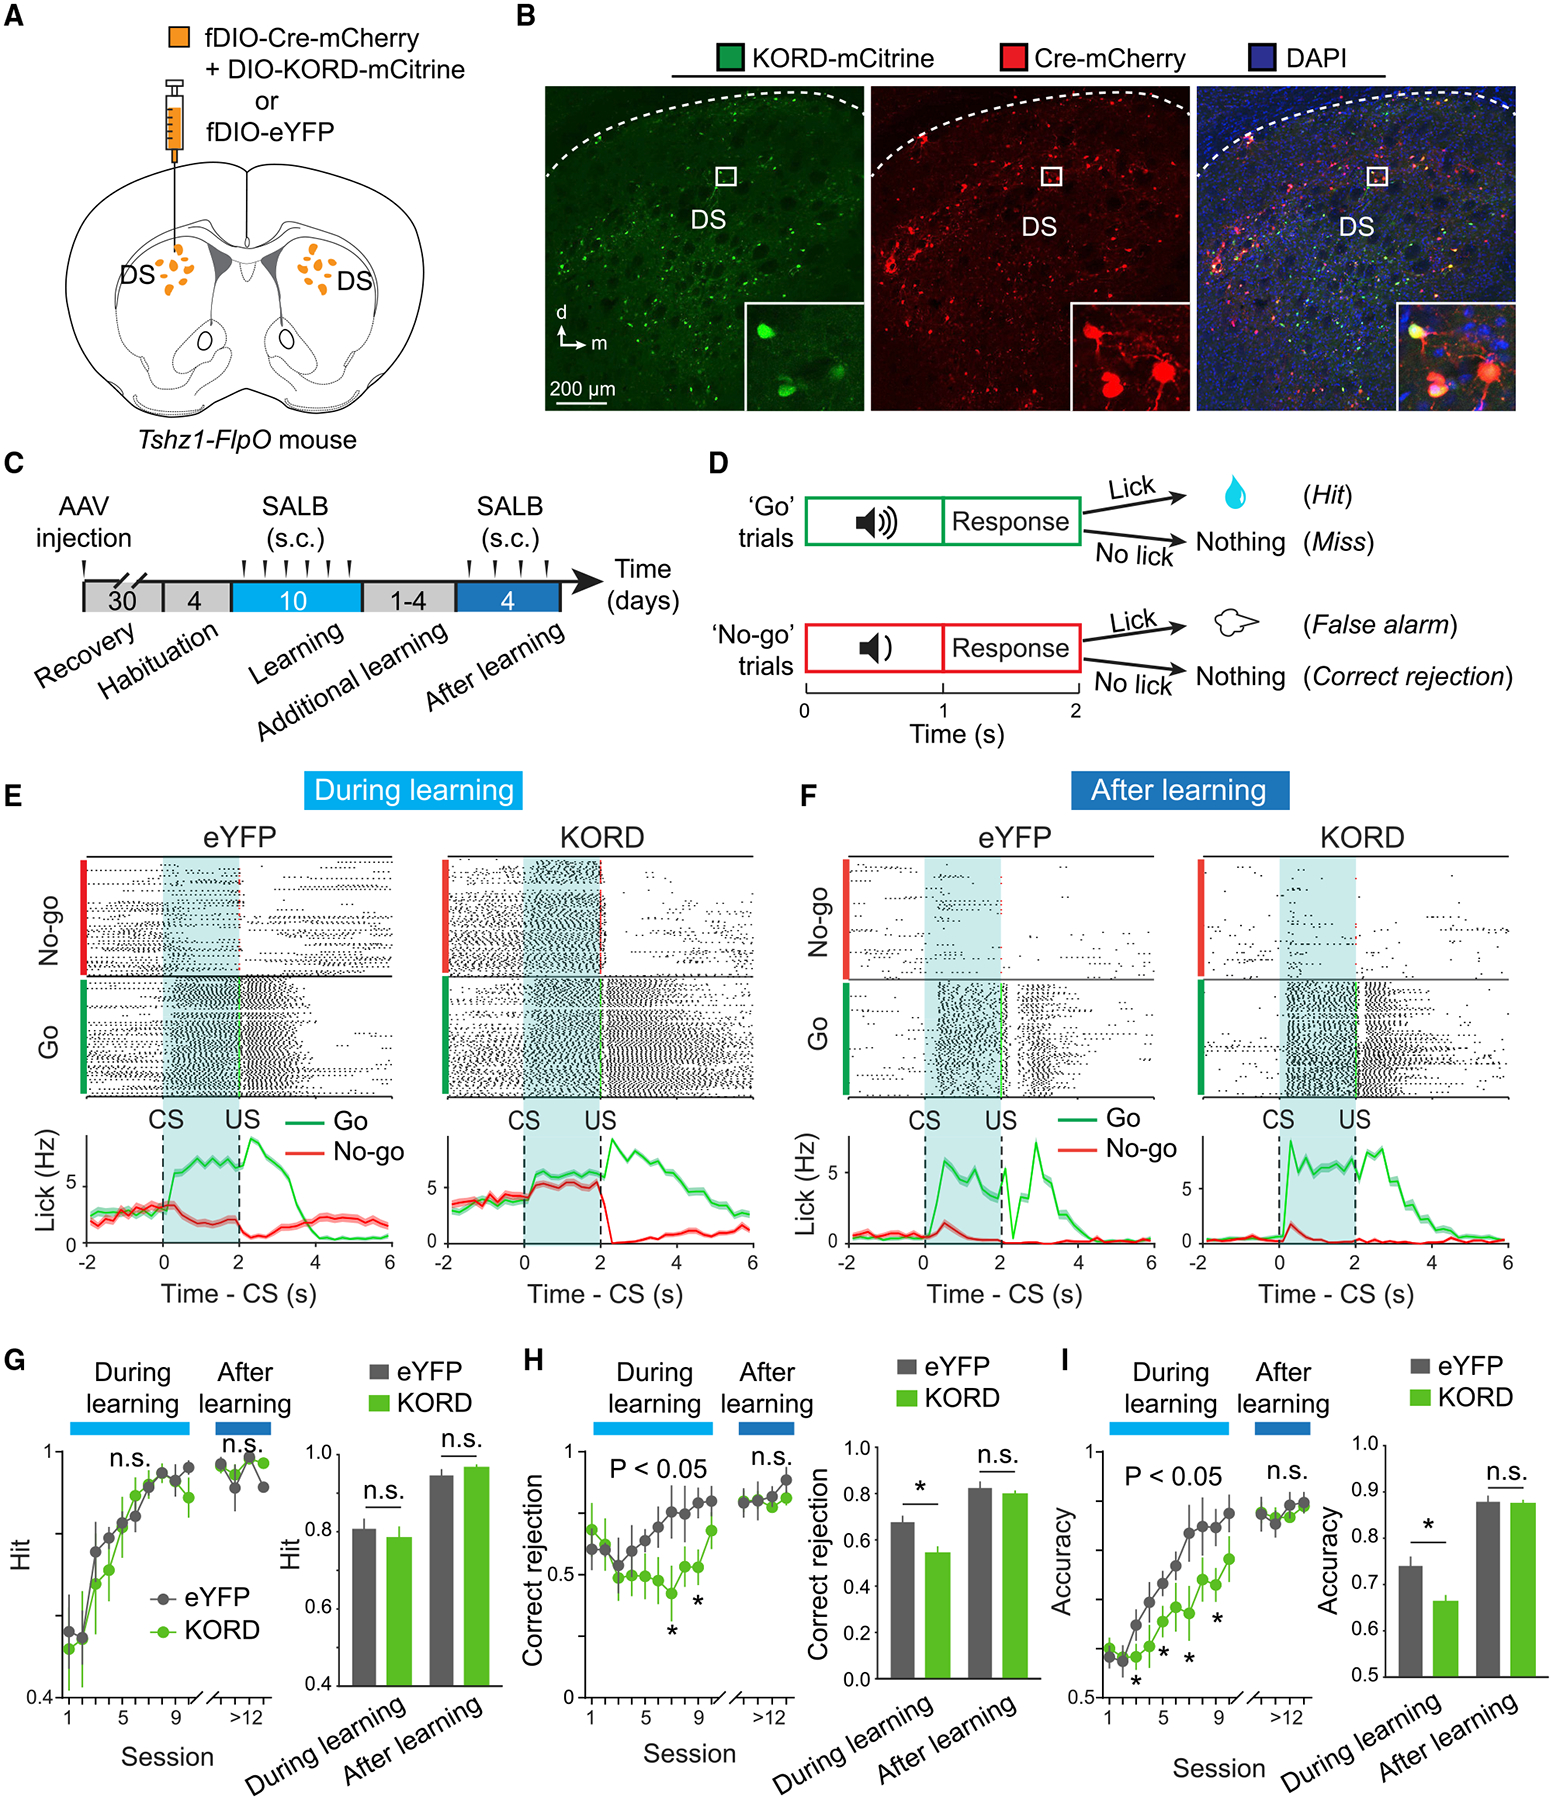
The striosome compartment within the dorsal striatum has been implicated in reinforcement learning and regulation of motivation, but how striosomal neurons contribute to these functions remains elusive. Here, we show that a genetically identified striosomal population, which expresses the Teashirt family zinc finger 1 (Tshz1) and belongs to the direct pathway, drives negative reinforcement and is essential for aversive learning in mice. Contrasting a "conventional" striosomal direct pathway, the Tshz1 neurons cause aversion, movement suppression, and negative reinforcement once activated, and they receive a distinct set of synaptic inputs. These neurons are predominantly excited by punishment rather than reward and represent the anticipation of punishment or the motivation for avoidance. Furthermore, inhibiting these neurons impairs punishment-based learning without affecting reward learning or movement. These results establish a major role of striosomal neurons in behaviors reinforced by punishment and moreover uncover functions of the direct pathway unaccounted for in classic models.

Keywords: Tshz1; aversive learning; avoidance; direct pathway; dorsal striatum; motivation; negative reinforcement; punishment; reward; striosome.


Conflict of interest statement

Declaration of Interests The authors declare no competing interests.

Figures

Figure 1.
Figure 1.. Tshz1 and Pdyn Label Two Distinct Populations of dMSNs in the Striosome
(A) Confocal images of a sagittal brain section from a Tshz1-2A-FlpO;Frt-Stop-Frt-tdTomato mouse, in which Tshz1+ neurons express tdTomato (Tshz1tdTomato) and thus are red fluorescent. Images at the bottom are high-magnification images of the boxed area in the DS (top) and the boxed area over a patch (bottom left). (B) Confocal images of Tshz1tdTomato neurons in the DS (left) and striosomes identified by an antibody recognizing MOR (middle). In the bottom panel are images of the boxed area in the top panel (right), showing the localization of Tshz1tdTomato neurons in the striosomes. (C) Quantification of Tshz1tdTomato cell density in the striosome and matrix (n = 3 mice; t(2) = 36.5, ***p < 0.001, paired t test). (D) Confocal images of in situ hybridization for Tshz1tdTomato, Drd1, and Drd2 in the DS. Right, high-magnification images of the boxed area on the left. (E) Quantification of the percentage of Drd1 or Drd2 cells in Tshz1tdTomato cells (left) (n = 3 mice; t(2) = 21.2, **p = 0.0022, paired t test) or vice versa (right) (t(2) = 9.7, *p = 0.0105, paired t test). (F) Characterization of Pdyn+ neurons in the DS. Left: a confocal image of a sagittal brain section prepared from a Pdyn-Cre;Ai14 mouse, in which Pdyn+ neurons express tdTomato (PdyntdTomato). Right: a high-magnification view of the boxed area on the left, showing that PdyntdTomato neurons form patches in the DS. (G) A confocal image of a coronal brain section prepared from a Pdyn-Cre;Ai14 mouse. (H) Confocal images of in situ hybridization for Tshz1tdTomato, Pdyn, and Drd1 in the DS. (I) High-magnification images of the boxed area in (H), showing that Tshz1 and Pdyn do not overlap, but both overlap with Drd1. (J) Quantification of the fractions of Tshz1+ nuclei that were positive for Pdyn and Drd1, and the fractions of Pdyn+ nuclei that were positive for Tshz1 and Drd1 (n = 3 mice). (K) A schematic showing the relationship between different populations in the DS. (L) A schematic diagram showing the components of the direct and indirect pathways. The direct pathway includes the Tshz1+ and Pdyn+ MSNs in the striosome. DS, dorsal striatum; GPe, globus pallidus externus; GPi, globus pallidus internus; SNr, substantia nigra pars reticulata; SNc, substantia nigra pars compacta; STN, subthalamic nucleus. Data in (C) and (E) are presented as mean ± SEM. See also Figure S1.
Figure 2.
Figure 2.. Optogenetic Activation of Tshz1+ or Pdyn+ dMSNs Has Opposite Behavioral Effects
(A) A schematic of the approach. (B) A confocal image of ChR2 expression in Tshz1+ dMSNs in a representative mouse. (C) Heatmaps for the activity of a representative mouse at baseline (top), or in a situation whereby entering the left (middle) or right (bottom) side of the chamber triggered photo-stimulation in the DS. (D) Quantification of the mouse activity as shown in C, for mice in which the Tshz1+ dMSNs expressed ChR2 (n = 6) or eYFP (n = 6). The ChR2 mice, but not the eYFP mice, avoided the side associated with the photo-stimulation (F(2,30) = 53.1, p < 0.001, ***p < 0.001, n.s. (non-significant), p > 0.05, two-way ANOVA followed by Tukey’s test). (E and F) Schematics of the experimental setup (E) and design (F). (G) Photo-stimulation in the DS of the ChR2 mice, but not the eYFP mice, caused a decrease in choice associated with the stimulation (F(1,20) = 52.6, p < 0.001, ***p < 0.001, n.s., p > 0.05, two-way ANOVA followed by Tukey’s test). (H) An example session showing the choice bias of a ChR2 mouse against the photo-stimulation. (I) A schematic of the approach. (J) A confocal image of ChR2 expression in Pdyn+ dMSNs in a representative mouse. (K) Heatmaps for the activity of a representative mouse at baseline (top) or in a situation whereby entering the left (middle) or right (bottom) side of the chamber triggered photo-stimulation in the DS. (L) Quantification of the mouse activity as shown in (K). Photo-activation of Pdyn+ dMSNs (n = 6 mice) induced preference for the side associated with the photo-activation (F(2,15) = 41.95, p < 0.0001, **p = 0.0021, ***p = 0.0002, one-way ANOVA followed by Tukey’s test). (M) A schematic of the experimental design. (N) Cumulative curves for the poking responses at a port where poking triggered the photo-stimulation (active) and a port where poking did not trigger the photo-stimulation (inactive), in mice in which Pdyn+ dMSNs expressed ChR2 (n = 6), or Tshz1+ dMSNs expressed eYFP (as the control; n = 6). (O) Quantification of the poking responses as shown in (N). The ChR2 mice, but not the eYFP mice, poked the port for photo-stimulation in the DS (F(1,20) = 86.64, p < 0.0001, ***p < 0.001, n.s., p > 0.05, two-way ANOVA followed by Tukey’s test). (P) An example session of a ChR2 mouse, which poked viciously at the active port but not the inactive port, indicating robust self-stimulation. Data in (D), (G), (L), and (O) are presented as mean ± SEM. See also Figures S2 and S3.
Figure 3.
Figure 3.. Tshz1+ but Not Pdyn+ dMSNs Are Preferentially Excited by Aversive Stimuli
(A–C) Schematics of the approach (A), experimental setup (B), and design (C). (D) A representative confocal image of GCaMP6 expression in Tshz1+ dMSNs. (E) Example traces of simultaneously measured behavioral (top) and neural (middle) responses in a representative Tshz1-2A-FlpO mouse. The gray trace (bottom) represents the fluorescence signals acquired with the isosbestic wavelength (415 nm), which was used to monitor potential motion artifacts during recording with fiber photometry. (F) Representative confocal images of GCaMP6 expression in Pdyn+ dMSNs. (G) Example traces of simultaneously measured behavioral (top) and neural (middle) responses in a representative Pdyn-Cre mouse. The gray trace (bottom) represents the fluorescence signals acquired with the isosbestic wavelength (415 nm), which was used to monitor potential motion artifacts during recording with fiber photometry. (H) Top: licking events, sorted according to trial types, for a representative Tshz1-2A-FlpO mouse in the early (left) and late (right) stages of training in the Pavlovian task. Middle: average licking rates of this mouse in different types of trials as indicated. Bottom: average GCaMP6 signals from this mouse, obtained from different types of trials. Dashed lines indicate the onset of CS and US, as indicated. (I) Left: quantification of the responses of Tshz1+ dMSNs in all mice to different stimuli at the early stage of training (n = 5 mice; F(1,8) = 10.03, p = 0.013; CS response, p = 0.99 (n.s., nonsignificant); US response, **p = 0.0031; two-way ANOVA followed by Bonferroni’s test). Right: quantification of the responses of Tshz1+ dMSNs in all mice to different stimuli at the late stage of training (n = 5 mice; F(1,8) = 12.17, p = 0.0082; CS response, p = 0.61 (n.s.); US response, **p = 0.0060; two-way ANOVA followed by Bonferroni’s test). (J) Top: licking events, sorted according to trial types, for a representative Pdyn-Cre mouse in the early (left) and late (right) stages of training in the Pavlovian task. Middle: average licking rates of this mouse in different types of trials as indicated. Bottom: average GCaMP6 signals from this mouse, obtained from different types of trials. Dashed lines indicate the onset of CS and US, as indicated. (K) Left: quantification of the responses of Pdyn+ dMSNs in all mice to different stimuli at the early stage of training (n = 7 mice; F(1,12) = 0.29, p = 0.59; CS response, p = 0.90 (n.s.); US response, p = 0.41 (n.s.); two-way ANOVA followed by Bonferroni’s test). Right: quantification of the responses of Pdyn+ dMSNs in all mice to different stimuli at the late stage of training (n = 7 mice; F(1,12) = 1.23, p = 0.29; CS response, p = 0.85 (n.s.); US response, p = 0.78 (n.s.); two-way ANOVA followed by Bonferroni’s test). Data are presented as mean ± SEM. Shaded areas represent SEM. See also Figures S4 and S5.
Figure 4.
Figure 4.. Individual Tshz1+ dMSNs Are Predominantly Excited by and Encode the Value of the Aversive Stimulus
(A) A schematic of the experimental setup and the approach. (B) Top left, the field of view (FOV) of raw GCaMP6m fluorescence signals from Tshz1+ dMSNs in a mouse before conditioning. Top right, the spatial locations of individual extracted neurons in the FOV shown on the left. Different classes of Tshz1+ dMSNs are color coded. Bottom left, quantification of the pairwise distances of different classes of neurons, as indicated, in the FOV. The distributions of the pairwise distances were not significantly different (n.s.) between groups (negative valence neurons [NVNs] versus positive valence neurons [PNVs], p = 0.35; NVNs versus all neurons (All), p = 0.14; PVNs versus All, p = 0.13; Kolmogorov-Smirnov test). Bottom right, quantification of the pairwise distances of neurons belonging to the same class (“Same,” i.e., the distances of NVN-NVN pairs and those of PNV-PNV pairs; data were combined), and those belonging to different classes (“Different,” i.e., the distances of NVN-PNV pairs). These two distributions were significantly different (*p = 0.02; Kolmogorov-Smirnov test). Data from each of the 6 mice were pooled together (n = 436 cells/6 mice). (C) Left: pie chart of the percentage distributions of Tshz1+ dMSNs, showing those selectively excited by air puff (i.e., the NVNs), by water (i.e., the PVNs), or other types of neurons (other), before training in the Pavlovian conditioning task. Right: the fractions of NVNs and PVNs in individual mice (n = 6; t(5) = 4.73, **p = 0.005, paired t test). (D) A scatterplot of individual Tshz1+ dMSNs’ responses to air puff and water. The NVNs, PVNs and all other neurons are color coded as indicated. Inset: a bar graph showing the average responses of all neurons to air puff (red) and water (green) (***p < 0.001, Wilcoxon signed-rank test). (E) Average responses of all Tshz1+ dMSNs to punishment and reward. (F) Trial-by-trial (top) and average (bottom) responses of an example NVN to air puffs of different durations. (G) Average responses of NVNs to air puffs of different durations (n = 95; F(2,282) = 15.65, ***p < 0.001, one-way ANOVA followed by Tukey’s test). Data are presented as mean ± SEM. Shaded areas in the activity traces represent SEM. See also Figure S6.
Figure 5.
Figure 5.. Learning Induces Predictive Signals in Tshz1+ dMSNs
(A) Licking behavior in Pavlovian conditioning. Shown were data from a well-trained mouse in a representative session. Dashed lines indicate the timing of delivery of CS and US. (B) Pie graphs showing the learning-induced changes in the fractions of Tshz1+ dMSNs responsive to CS1 (excitation, χ2 = 16.8, p = 4.1 × 10⁻⁵; inhibition, χ2 = 14.7, p = 1.2 × 10⁻⁴; χ2 test) or CS2 (excitation, χ2 = 12.1, p = 5.0 × 10⁻⁵; inhibition, χ2 = 9.5, p = 0.0021; χ2 test). (C) Heatmaps of the responses of individual neurons excited by the punishment CS after training in the Pavlovian conditioning. Each row represents the responses of one neuron in punishment (left) and reward (right) trials. Neurons are sorted according to their responses to the CS predicting air puff. (D) Left: average responses of all neurons in (C) in different trial types as indicated. Right: quantification of the CS responses of these neurons (****p = 7.7 × 10⁻⁸, Wilcoxon signed-rank test). (E) Heatmaps of the responses of individual neurons excited by the reward CS after training in the Pavlovian conditioning. Each row represents the responses of one neuron in punishment (left) and reward (right) trials. Neurons are sorted according to their responses to the CS predicting water reward. (F) Left: average responses of all neurons in (E) in different trial types as indicated. Right: quantification of the CS responses of these neurons (****p = 6.3 × 10⁻⁶, Wilcoxon signed-rank test). (G) A schematic of the “coding direction” analysis (see STAR Methods), showing how neuronal activities are projected onto the coding direction (cd, a vector schematically denoted by the black arrow). (H) Tshz1+ dMSN activities in punishment and reward trials projected onto the cd. Data were pooled from 6 mice after training in the conditioning. AU, arbitrary unit. (I) The trajectories of trial-averaged Tshz1+ dMSN population activities after dimensionality reduction with principal component analysis (PCA). Data were from a representative mouse after training. Black dots indicate CS onset; red or green dots indicate US onset. (J) The trajectories of trial-by-trial Tshz1+ dMSN population activities after dimensionality reduction with PCA. Data were from a representative mouse after training. Black dots indicate CS onset; red or green dots indicate US onset. (K) Decoding accuracy across time in a trial, showing that the accuracy increased following CS onset. Actual, decoding analysis using the actual responses of neurons in punishment and reward trials; shuffle, decoding analysis using the responses of neurons that were shuffled across trial types. Responses after training were used for the analysis. (L) An example of support vector machine (SVM) decoding using the principal components (PCs) of Tshz1+ dMSN population activities during CS period. The responses before (left) and after (right) training in the conditioning were used for the analysis. (M) Learning improved the accuracy of Tshz1+ dMSN population CS response in decoding punishment versus reward trials (t(10) = 4.37, **p = 0.0014, t test). Data are presented as mean ± SEM. Shaded areas represent SEM. See also Figure S6.
Figure 6.
Figure 6.. Tshz1+ dMSNs Represent Specific Aspects of Active Avoidance
(A) Schematics of the experimental setup and approach. (B) A schematic of the experimental design. (C) Top: running events, sorted according to trial types, for a representative mouse in the active avoidance task. Bottom: average running velocity of this mouse in different types of trials as indicated. (D) Average activity of all the Tshz1+ dMSNs imaged in the mouse in (C). (E) Correlation between neural activity and running velocity during the decision window in a representative mouse. (F) Histogram showing the distribution of neurons based on their correlation coefficients calculated as in (E). Yellow, green and gray bars represent neurons showing significant positive (p < 0.05; n = 102), significant negative (p < 0.05; n = 30) and no significant (p > 0.05) correlation, respectively. (G) Average responses of the neurons showing significant positive and negative correlations in (F), in trials in which running velocities of mice during the decision window were classified as being low, medium, and high. Left, F(2,306) = 41.31, p < 0.0001; right, F(2,87) = 0.52, p = 0.60; one-way ANOVA. (H) The responses of an example “failure cell,” “success cell,” and “non-discriminatory (ND) cell” in different types of trials in the active avoidance task, as indicated. (I) A scatterplot of individual Tshz1+ dMSNs’ responses during active running (in success trials) and reactive running (in failure trials). The failure cells, success cells, ND cells, and all other cells are color coded as indicated. (J) Percentage distribution of the neurons excited during reactive running (failure cells), active running (success cells), and both (ND cells). These cells correspond to the same cells classified in (I). (K) The trajectories of trial-by-trial Tshz1+ dMSN population activities after dimensionality reduction with PCA. Time 0 indicates CS onset in each trial. Data were from one mouse in an example session. (L) SVM decoding using the principal components (PCs) of Tshz1+ dMSN population activities during the decision window in an example session. (M) Performance of the decoding as shown in (L), for failure and success trials (n = 4 sessions). Actual decoding analysis using the actual responses of neurons in failure, success, and neutral trials; shuffle, decoding analysis using the responses of neurons that were shuffled across these trial types. Data are presented as mean ± SEM. Shaded areas represent SEM. See also Figure S6.
Figure 7.
Figure 7.. Chemogenetic Inhibition of Tshz1+ dMSNs Impairs Aversive Learning
(A) A schematic of the approach. (B) Representative confocal images showing the expression of KORD (left) and Cre (middle), and the co-expression of the two molecules (right) in Tshz1+ dMSNs. Inset in each panel, a high-magnification image of the boxed region. (C and D) Schematics of the experimental procedure (C) and the go/no-go task (D). (E) Licking behavior of example mice, in which the Tshz1+ dMSNs expressed eYFP (left) or KORD (right), in the go/no-go task following treatment with SALB during the learning phase. Top, lick raster; bottom, average lick rate over time (0.2 s bin). (F) Same as (E), except that data were from mice that fully learned the task. (G) Hit rate in each session (left) (during learning, F(9,90) = 0.46, p = 0.90; after learning, F(3,30) = 0.36, p = 0.79; two-way ANOVA), and average across sessions (right) (F(1,20) = 0.93, p = 0.35, two-way ANOVA). n.s., non-significant (p > 0.05). (H) Correct rejection rate in each session (left) (during learning, F(9,90) = 2.14, p = 0.03, *p < 0.05; after learning, F(3,30) = 0.48, p = 0.70; two-way ANOVA followed by Tukey’s test), and average across sessions (right) (F(1,20) = 5.58, p = 0.03; during learning, *p = 0.02; after learning, p = 0.38; two-way ANOVA followed by Tukey’s test). (I) Overall accuracy in each session (left) (during learning, F(9,90) = 2.14, p = 0.03, *p < 0.05; after learning, F(3,30) = 0.50, p = 0.68; two-way ANOVA followed by Tukey’s test), and average across sessions (right) (F(1,20) = 7.14, p = 0.015; during learning, *p = 0.013; after learning, p = 0.72; two-way ANOVA followed by Tukey’s test). Data in (E)–(I) are presented as mean ± SEM. Shaded areas in the average traces in (E) and (F) represent SEM. See also Figure S7.

References

    1. Allen WE, Chen MZ, Pichamoorthy N, Tien RH, Pachitariu M, Luo L, and Deisseroth K (2019). Thirst regulates motivated behavior through modulation of brainwide neural population dynamics. Science 364, 253. - PMC - PubMed
    1. Amemori K, Gibb LG, and Graybiel AM (2011). Shifting responsibly: the importance of striatal modularity to reinforcement learning in uncertain environments. Front. Hum. Neurosci 5, 47. - PMC - PubMed
    1. Banghart MR, Neufeld SQ, Wong NC, and Sabatini BL (2015). Enkephalin Disinhibits Mu Opioid Receptor-Rich Striatal Patches via Delta Opioid Receptors. Neuron 88, 1227–1239. - PMC - PubMed
    1. Barbera G, Liang B, Zhang L, Gerfen CR, Culurciello E, Chen R, Li Y, and Lin DT (2016). Spatially Compact Neural Clusters in the Dorsal Striatum Encode Locomotion Relevant Information. Neuron 92, 202–213. - PMC - PubMed
    1. Berridge KC (2012). From prediction error to incentive salience: mesolimbic computation of reward motivation. Eur. J. Neurosci 35, 1124–1143. - PMC - PubMed

Publication types