. 2020 Sep 15;53(3):658-671.e6.
doi: 10.1016/j.immuni.2020.08.005.

Endogenous Glucocorticoid Signaling Regulates CD8+ T Cell Differentiation and Development of Dysfunction in the Tumor Microenvironment

Affiliations

Endogenous Glucocorticoid Signaling Regulates CD8+ T Cell Differentiation and Development of Dysfunction in the Tumor Microenvironment

Nandini Acharya et al. Immunity. .

Abstract

Identifying signals in the tumor microenvironment (TME) that shape CD8+ T cell phenotype can inform novel therapeutic approaches for cancer. Here, we identified a gradient of increasing glucocorticoid receptor (GR) expression and signaling from naïve to dysfunctional CD8+ tumor-infiltrating lymphocytes (TILs). Conditional deletion of the GR in CD8+ TILs improved effector differentiation, reduced expression of the transcription factor TCF-1, and inhibited the dysfunctional phenotype, culminating in tumor growth inhibition. GR signaling transactivated the expression of multiple checkpoint receptors and promoted the induction of dysfunction-associated genes upon T cell activation. In the TME, monocyte-macrophage lineage cells produced glucocorticoids and genetic ablation of steroidogenesis in these cells as well as localized pharmacologic inhibition of glucocorticoid biosynthesis improved tumor growth control. Active glucocorticoid signaling associated with failure to respond to checkpoint blockade in both preclinical models and melanoma patients. Thus, endogenous steroid hormone signaling in CD8+ TILs promotes dysfunction, with important implications for cancer immunotherapy.

Keywords: CD8(+) T cell; Nr3c1; TCF-1; cancer; dysfunction; exhaustion; glucocorticoid; immune checkpoint blockade; steroid; tumor-associated macrophages.


Conflict of interest statement

Declaration of Interests A.C.A. is a member of the SAB for Tizona Therapeutics, Compass Therapeutics, Zumutor Biologics, and Astellas Global Pharma Development, which have interests in cancer immunotherapy. V.K.K. is a member of the SAB for Astellas Global Pharma Development and has an ownership interest and is a member of the SAB for Tizona Therapeutics. A.R. and V.K.K. are co-founders of and have an ownership interest in Celsius Therapeutics. A.C.A.’s and V.K.K.’s interests were reviewed and managed by the Brigham and Women’s Hospital and Partners Healthcare in accordance with their conflict of interest policies. M.B. is a consultant for Eli Lilly and Company. A.R. is also an SAB member for Thermo Fisher, Neogene Therapeutics, Asimov, and Syros Pharmaceuticals and is an equity holder in Immunitas. A.R.’s interests were reviewed and managed by the Broad Institute and HHMI in accordance with their conflict of interest policies. A provisional patent application was filed including work in this manuscript.

Figures

Figure 1:
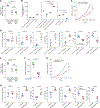
Figure 1:. A gradient of glucocorticoid receptor expression and signaling in CD8+ TILs
GR expression in TILs harvested from mice bearing MC38-Ovadim colon carcinoma (tumor size 100–120 mm2) (A,B) or from human colon carcinoma (C). A) Representative histograms of GR expression and summary data of mean fluorescence intensity (MFI) in the indicated CD8+ TILs populations. (n=5) B) Representative histograms of GR expression and summary data of MFI in OVA-specific CD8+ TILs. (n=5) C) Representative histograms of GR expression and summary data of MFI in CD8+ TILs. Data are normalized to the expression level in Tim-3-PD-1- CD8+ TILs. (n=7) D) tSNE plot showing projection of a (I) GC signature, (II) naïve CD8+T cell signature, (III) CD8+ T cell dysfunction signature onto the single-cell RNA profiles of CD8+ TILs (Singer et al., 2016). The contour marks cells showing highest expression and the color scale indicates low (blue) to high (red) expressing cells. (IV) Each cell in the dataset was scored for the three normalized signatures: GC, Naïve, and Dysfunction. Cells were then sorted based on their expression of the glucocorticoid signature from low (blue) to high (red) (x-Axis). The y-axis indicates the naive (blue) and dysfunction (red) signature score for each of the sorted cells. Moving average (shaded area) and smoothing conditional means (solid line) was used to aid visualization. *p < 0.05, **p < 0.01, ***p < 0.001, ****p < 0.0001. One-way ANOVA (Tukey’s multiple comparisons test) or unpaired Student’s t test. Mean ± SEM is shown.
Figure 2:
Figure 2:. Glucocorticoid signaling promotes checkpoint receptor expression and dampens CD8+ T cell effector functions
Murine (A-B) or human (C) naïve CD8+ T cells were repeatedly activated (anti-CD3/28) in the presence or absence of GC (Dex). Data shown are representative of 3 independent experiments B) Representative flow cytometry data and summary plots of the frequency and MFI the indicated cytokines following polyclonal activation (n=5) B and C) Representative flow cytometry data and summary plots of the frequency and MFI of the indicated checkpoint receptors (n=5 for B), (n=6 for C) *p<0.05, **p <0.01, ***p < 0.001, ****p<0.0001, unpaired Student’s t test. Mean ± SEM is shown.
Figure 3:
Figure 3:. Glucocorticoid signaling regulates effector differentiation in CD8+ TILs
A) MC38-Ovadim was implanted into WT (E8i-Cre-Nr3c1fl/fl) and E8i-Cre+Nr3c1fl/fl mice (n=8–9). Mean tumor growth is shown, ***p< 0.001, linear mixed model. Data are representative of 3 independent experiments. B-G) TILs were harvested from mice bearing MC38-Ovadim at early (size 40–60 mm2) and intermediate (size 120–150 mm2) stages of tumor progression as determined by the growth observed in WT controls. B) Representative flow cytometry data and summary plots of the frequency of OVA-specific CD8+ TILs at early (n=7) and intermediate (n=4) stages. (C-E) TILs were activated with OVA257–264 followed by intracellular staining. C) Representative flow cytometry data and summary plots of the frequency of the indicated cytokines in CD8+ TILs at early (n=7) and intermediate (n=9–10) stages. Data are pooled from 2 independent experiments for the intermediate stage. D) Representative flow cytometry data and summary plot of frequency of CD107a+ GzmB+ CD8+ TILs at early (n=7) and intermediate (n=6) stages. E) Representative flow cytometry data and summary plot of frequency of IL10-producingCD8+ TILs at early (n=7) and intermediate (n=5) stages. F) Representative flow cytometry data and summary plot of frequency of TCF-1+ cells within Ova-specific CD8+ TILs at early (n=7) and intermediate (n=4) stages. G) Representative flow cytometry data and summary plot of frequency of checkpoint receptor expressing CD8+ TILs at early (n=7) and intermediate (n=6–7) stages. NS, not significant, **p<0.01, ***p< 0.001, unpaired Student’s t-test. Mean ± SEM are shown. H) Experimental design: congenically marked WT (blue) and E8i-Cre+Nr3c1fl/fl (red) CD8+ T cells were transferred to Rag−/− recipients along with WT CD4+ T cells (green). MC38-Ovadim was implanted 2 days post T cell transfer. TILs were harvested at the intermediate stage of tumor growth and analyzed (n=6). NS, not significant, *p< 0.05, **p<0.01, ***p<0.001, ****p<0.0001, unpaired Student’s t-test or paired Student’s t-test (H). Mean ± SEM are shown.
Figure 4:
Figure 4:. Glucocorticoid signaling transactivates checkpoint receptor and IL-10 expression and induces T cell dysfunction genes
(A-E) Luciferase activity in 293T cells transfected with pGL4.23 or pGL4.10 luciferase reporters for the loci of the indicated checkpoint receptors or IL10 together with either empty vector (control) or vector encoding Nr3c1. Cells were treated with GC (Dex) after 24h. Firefly luciferase activity was measured 48 h after transfection and is presented relative to constitutive Renilla luciferase activity. NS, not significant, ****p<0.0001, two-way ANOVA (Tukey’s multiple comparisons test). Data are mean ± SEM and are representative of 2 independent experiments. F) Volcano plot showing the overlap of genes suppressed by GC (Dex) with genes expressed in Tim-3-PD-1 CD8+ TILs (p=1.4.0×10−26) and genes induced by GC (Dex) with Tim-3+PD-1+ CD8+ TILs (p=9.4×10−52) (Mean-rank Gene Set Test).
Figure 5:
Figure 5:. Intra-tumoral production of glucocorticoid affects tumor progression
A) Pregnenolone levels in the indicated tissues were quantified by ELISA (n=5). B) qPCR analysis of Cyp11a1 mRNA expression in the indicated cells. Data are pooled from 2 independent experiments (n= 5–6). C) MC38-Ovadim was implanted in LysMCre Cyp11a1fl/fl and LysMCre+Cyp11a1fl/fl mice (n=5). Mean tumor growth is shown, ***p<0.001, linear mixed model. Data are representative of 2 independent experiments. D) Analysis of CD8+TILs at early stage of tumor development (tumor size 40–60 mm2) (n=5) E) Corticosterone levels were quantified by ELISA (n=5). F) LinCD45+CD24 monocyte-macrophage lineage cells were isolated from MC38-Ovadim tumors and cultured in the presence or absence of Metyrapone. At 24hrs corticosterone levels were quantified by ELISA (n=5). G) MC38-Ovadim was implanted in WT mice (n=5). Metyrapone or vehicle control was administered intra-tumorally on Days 5,6,7 and 9 post-tumor implantation. Mean tumor growth is shown ***p< 0.001, linear mixed model. Data are representative of 2 independent experiments. H) MC38-Ovadim was implanted in WT mice (n=5). Metyrapone or vehicle control was administered intra-tumorally on Days 5 and 6 post-tumor implantation. 24hrs later, TILs were harvested (tumor size 55–65 mm2 in both groups) and analyzed by flow cytometry. Summary plots show the frequency of the indicated populations. ND, not detected, NS, not significant *p<0.05 **p<0.01, ***p<0.001, ****p<0.0001, unpaired Student’s t-test or One-way ANOVA (Tukey’s multiple comparisons test). Data are mean ± SEM.
Figure 6:
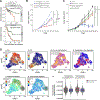
Figure 6:. Glucocorticoid signaling in CD8+ T cells affects responses to immunotherapy
A) Correlation of Cyp11a1 mRNA expression with survival in patients with colon adenocarcinoma (COAD) and stomach adenocarcinoma (STAD) using TIMER. B) MC38-Ovadim was implanted into WT (E8i-CreNr3c1fl/fl) and E8i-Cre+Nr3c1fl/fl mice (n=7–8). Anti-PD1 was administered i.p on Days 5,8 and 11. Mean tumor growth is shown. NS, not significant, ****p< 0.0001, linear mixed model. C) MC38 was implanted into WT mice. On Day 7 post-tumor implantation, mice were treated with GC (Dex) or anti-PD1+anti-CTLA-4 or both. Antibody was administered bi-weekly for a total of 5 treatments (n=6–10). GC was administered for 10 consecutive days. NS, not significant, *p<0.05, ***p<0.001, linear mixed model. D) tSNE plot of single-cell TILs data from melanoma patients treated with anti-PD-1, anti-CTLA-4, or anti-CTLA-4 + anti-PD-1(Sade-Feldman et al., 2018). I) CD8 expression, II) CD4 expression, III) pre- (orange) versus post- (purple) treatment samples, IV) Responder (red) versus non-responder (blue), V) Projection of CD8+ TILs dysfunction signature, VI) Projection of the GC signature. VII) Box plots show the GC signature score in responder versus non-responders in pre- (p=3.246×10⁻¹³) and post- (p <2.2×10⁻¹⁶) treatment samples (Welch Two Sample t-test). The lower and upper hinges correspond to the first and third quartiles. The upper and lower whiskers extend from the hinge to the largest and smallest value no further than 1.5 times the distance between the first and third quartiles, respectively. Data beyond the end of the whiskers are outlying points and are not plotted individually.
Figure 7:
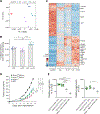
Figure 7:. Glucocorticoid and IL-27 signaling co-operate to regulate CD8+ T cell phenotype in the TME
A-C) Naïve CD8+ T cells were cultured in vitro with anti CD3/28 and GC (dexamethasone), IL-27, or GC+IL-27. Cells were harvested on Day 9 and gene expression analyzed by RNA sequencing. A) Principle component analysis (PCA) of Ctrl, GC, IL-27, and GC+IL-27 treated CD8+ T cells. The percentage of explained variance for each principal component is indicated. B) Mean delta Euclidean distance between the GC, IL-27, or GC+IL-27-treated groups to thecontrol group, adjusted p-values were calculated using one-way ANOVA (p=9.89×10−09), followed by Tukey’s multiple comparisons test, *p<0.05, ****p<0.001. C) Heatmap of DE genes between Ctrl and GC + IL-27 treatment. Tick marks indicateselected genes associated with CD8+ T cell dysfunction. D) CD8+ T cells from either WT (E8i-Cre-Nr3c1fl/fl), E8i-Cre+Nr3c1fl/fl, WSX1−/− or and E8i-Cre+Nr3c1fl/fl WSX1−/− (DKO) mice and CD4+ T cells from WT mice were transferred to Rag−/−mice (n=5–6/group), MC38-Ovadim cells were implanted two days post T cell transfer. Mean tumor growth is shown. *p<0.05, ***p< 0.001, linear mixed model. Data are representative of 2 independent experiments. E) qRT-PCR analysis of IL-27 (p28 and Ebi3) mRNA expression in the indicated cells. Dataare pooled from 2 independent experiments. **p<0.01, ***p<0.001, ****p<0.0001. One-way ANOVA (Tukey’s multiple comparisons test). Data are mean ± SEM.

Comment in

References

    1. Abbaszade IG, Clarke TR, Park CH, and Payne AH (1995). The mouse 3 beta-hydroxysteroid dehydrogenase multigene family includes two functionally distinct groups of proteins. Mol Endocrinol 9, 1214–1222. - PubMed
    1. Anders S, and Huber W. (2010). Differential expression analysis for sequence count data. Genome biology 11, R106. - PMC - PubMed
    1. Arbour KC, Mezquita L, Long N, Rizvi H, Auclin E, Ni A, Martinez-Bernal G, Ferrara R, Lai WV, Hendriks LEL, et al. (2018). Impact of Baseline Steroids on Efficacy of Programmed Cell Death-1 and Programmed Death-Ligand 1 Blockade in Patients With Non-Small-Cell Lung Cancer. J Clin Oncol 36, 2872–2878. - PubMed
    1. Arriza JL, Weinberger C, Cerelli G, Glaser TM, Handelin BL, Housman DE, and Evans RM (1987). Cloning of human mineralocorticoid receptor complementary DNA: structural and functional kinship with the glucocorticoid receptor. Science 237, 268–275. - PubMed
    1. Auphan N, DiDonato JA, Rosette C, Helmberg A, and Karin M. (1995). Immunosuppression by glucocorticoids: inhibition of NF-kappa B activity through induction of I kappa B synthesis. Science 270, 286–290. - PubMed

Publication types

MeSH terms