

Glucagon acutely regulates hepatic amino acid catabolism and the effect may be disturbed by steatosis
- PMID: 32937194
- PMCID: PMC7560169
- DOI: 10.1016/j.molmet.2020.101080
Glucagon acutely regulates hepatic amino acid catabolism and the effect may be disturbed by steatosis
Abstract
Objective: Glucagon is well known to regulate blood glucose but may be equally important for amino acid metabolism. Plasma levels of amino acids are regulated by glucagon-dependent mechanism(s), while amino acids stimulate glucagon secretion from alpha cells, completing the recently described liver-alpha cell axis. The mechanisms underlying the cycle and the possible impact of hepatic steatosis are unclear.
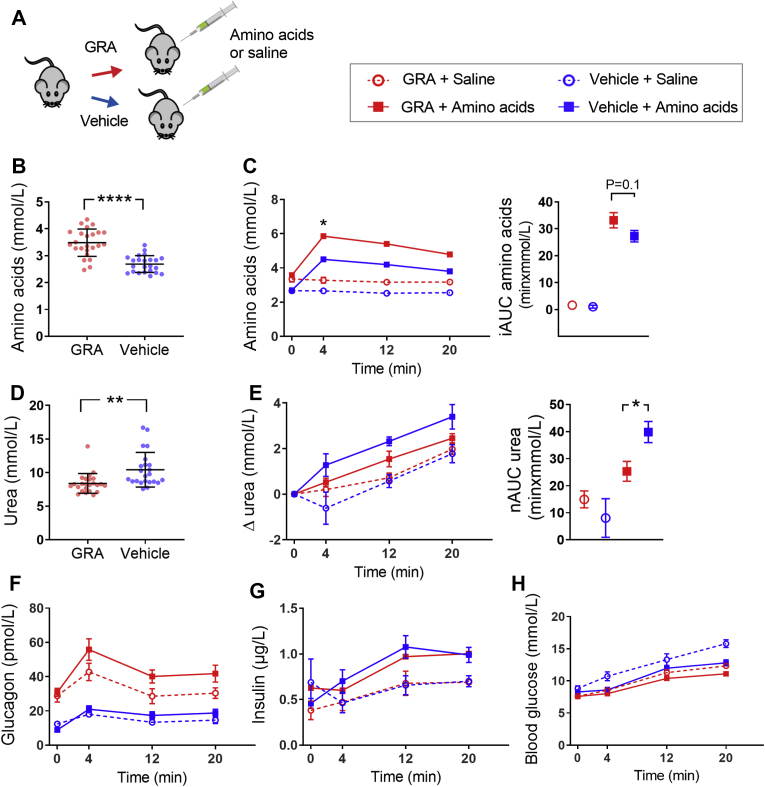
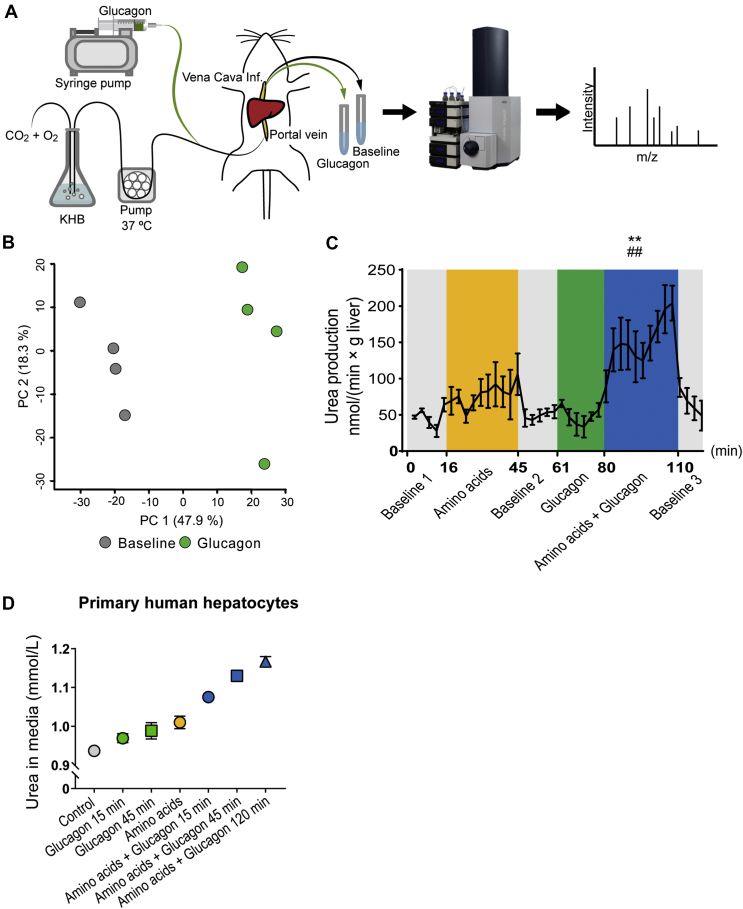
Methods: We assessed amino acid clearance in vivo in mice treated with a glucagon receptor antagonist (GRA), transgenic mice with 95% reduction in alpha cells, and mice with hepatic steatosis. In addition, we evaluated urea formation in primary hepatocytes from ob/ob mice and humans, and we studied acute metabolic effects of glucagon in perfused rat livers. We also performed RNA sequencing on livers from glucagon receptor knock-out mice and mice with hepatic steatosis. Finally, we measured individual plasma amino acids and glucagon in healthy controls and in two independent cohorts of patients with biopsy-verified non-alcoholic fatty liver disease (NAFLD).
Results: Amino acid clearance was reduced in mice treated with GRA and mice lacking endogenous glucagon (loss of alpha cells) concomitantly with reduced production of urea. Glucagon administration markedly changed the secretion of rat liver metabolites and within minutes increased urea formation in mice, in perfused rat liver, and in primary human hepatocytes. Transcriptomic analyses revealed that three genes responsible for amino acid catabolism (Cps1, Slc7a2, and Slc38a2) were downregulated both in mice with hepatic steatosis and in mice with deletion of the glucagon receptor. Cultured ob/ob hepatocytes produced less urea upon stimulation with mixed amino acids, and amino acid clearance was lower in mice with hepatic steatosis. Glucagon-induced ureagenesis was impaired in perfused rat livers with hepatic steatosis. Patients with NAFLD had hyperglucagonemia and increased levels of glucagonotropic amino acids, including alanine in particular. Both glucagon and alanine levels were reduced after diet-induced reduction in Homeostatic Model Assessment for Insulin Resistance (HOMA-IR, a marker of hepatic steatosis).
Conclusions: Glucagon regulates amino acid metabolism both non-transcriptionally and transcriptionally. Hepatic steatosis may impair glucagon-dependent enhancement of amino acid catabolism.
Keywords: Amino acids; Glucagon; Liver-alpha cell axis; Non-alcoholic fatty liver disease.
Copyright © 2020 The Author(s). Published by Elsevier GmbH.. All rights reserved.
Figures


Similar articles
-
Arginine-induced glucagon secretion and glucagon-induced enhancement of amino acid catabolism are not influenced by ambient glucose levels in mice.Am J Physiol Endocrinol Metab. 2022 Sep 1;323(3):E207-E214. doi: 10.1152/ajpendo.00122.2022. Epub 2022 Jul 13. Am J Physiol Endocrinol Metab. 2022. PMID: 35830690
-
Hyperglucagonemia correlates with plasma levels of non-branched-chain amino acids in patients with liver disease independent of type 2 diabetes.Am J Physiol Gastrointest Liver Physiol. 2018 Jan 1;314(1):G91-G96. doi: 10.1152/ajpgi.00216.2017. Epub 2017 Sep 28. Am J Physiol Gastrointest Liver Physiol. 2018. PMID: 28971838
-
Evidence of a liver-alpha cell axis in humans: hepatic insulin resistance attenuates relationship between fasting plasma glucagon and glucagonotropic amino acids.Diabetologia. 2018 Mar;61(3):671-680. doi: 10.1007/s00125-017-4535-5. Epub 2018 Jan 5. Diabetologia. 2018. PMID: 29305624
-
The Liver-α-Cell Axis and Type 2 Diabetes.Endocr Rev. 2019 Oct 1;40(5):1353-1366. doi: 10.1210/er.2018-00251. Endocr Rev. 2019. PMID: 30920583 Review.
-
The Liver-α-Cell Axis in Health and in Disease.Diabetes. 2022 Sep 1;71(9):1852-1861. doi: 10.2337/dbi22-0004. Diabetes. 2022. PMID: 35657688 Free PMC article. Review.
Cited by
-
Deleterious mutation V369M in the mouse GCGR gene causes abnormal plasma amino acid levels indicative of a possible liver-α-cell axis.Biosci Rep. 2021 Jun 25;41(6):BSR20210758. doi: 10.1042/BSR20210758. Biosci Rep. 2021. PMID: 34002801 Free PMC article.
-
Nrf2a dependent and independent effects of early life exposure to 3,3'-dichlorobiphenyl (PCB-11) in zebrafish (Danio rerio).Aquat Toxicol. 2022 Aug;249:106219. doi: 10.1016/j.aquatox.2022.106219. Epub 2022 Jun 9. Aquat Toxicol. 2022. PMID: 35700651 Free PMC article.
-
The neglected PCK1/glucagon (inter)action in nutrient homeostasis beyond gluconeogenesis: Disease pathogenesis and treatment.Mol Metab. 2025 Apr;94:102112. doi: 10.1016/j.molmet.2025.102112. Epub 2025 Feb 13. Mol Metab. 2025. PMID: 39954782 Free PMC article. Review.
-
Female glucagon receptor knockout mice are prone to steatosis but resistant to weight gain when fed a MASH-promoting GAN diet and a high-fat diet.Physiol Rep. 2025 Feb;13(4):e70235. doi: 10.14814/phy2.70235. Physiol Rep. 2025. PMID: 39985139 Free PMC article.
-
Markers of Glucagon Resistance Improve With Reductions in Hepatic Steatosis and Body Weight in Type 2 Diabetes.J Endocr Soc. 2023 Sep 21;7(11):bvad122. doi: 10.1210/jendso/bvad122. eCollection 2023 Oct 9. J Endocr Soc. 2023. PMID: 37818402 Free PMC article.
References
-
- Kimball C.P., Murlin J.R. Aqueous extracts of pancreas: III. Some precipitation reactions of insulin. Journal of Biological Chemistry. 1923;58:337–348.
-
- Hamberg O., Vilstrup H. Regulation of urea synthesis by glucose and glucagon in normal man. Clinical Nutrition. 1994;13(3):183–191. - PubMed
-
- Assan R., Attali J.R., Ballerio G., Boillot J., Girard J.R. Glucagon secretion induced by natural and artificial amino acids in the perfused rat pancreas. Diabetes. 1977;26(4):300–307. - PubMed
-
- Solloway M.J., Madjidi A., Gu C., Eastham-Anderson J., Clarke H.J., Kljavin N. Glucagon couples hepatic amino acid catabolism to mTOR-dependent regulation of alpha-cell mass. Cell Reports. 2015;12(3):495–510. - PubMed
Publication types
MeSH terms
Substances
LinkOut - more resources
Full Text Sources
Molecular Biology Databases
Miscellaneous
