

Balloon-based drug coating delivery to the artery wall is dictated by coating micro-morphology and angioplasty pressure gradients
- PMID: 32937269
- PMCID: PMC7530113
- DOI: 10.1016/j.biomaterials.2020.120337
Balloon-based drug coating delivery to the artery wall is dictated by coating micro-morphology and angioplasty pressure gradients
Abstract
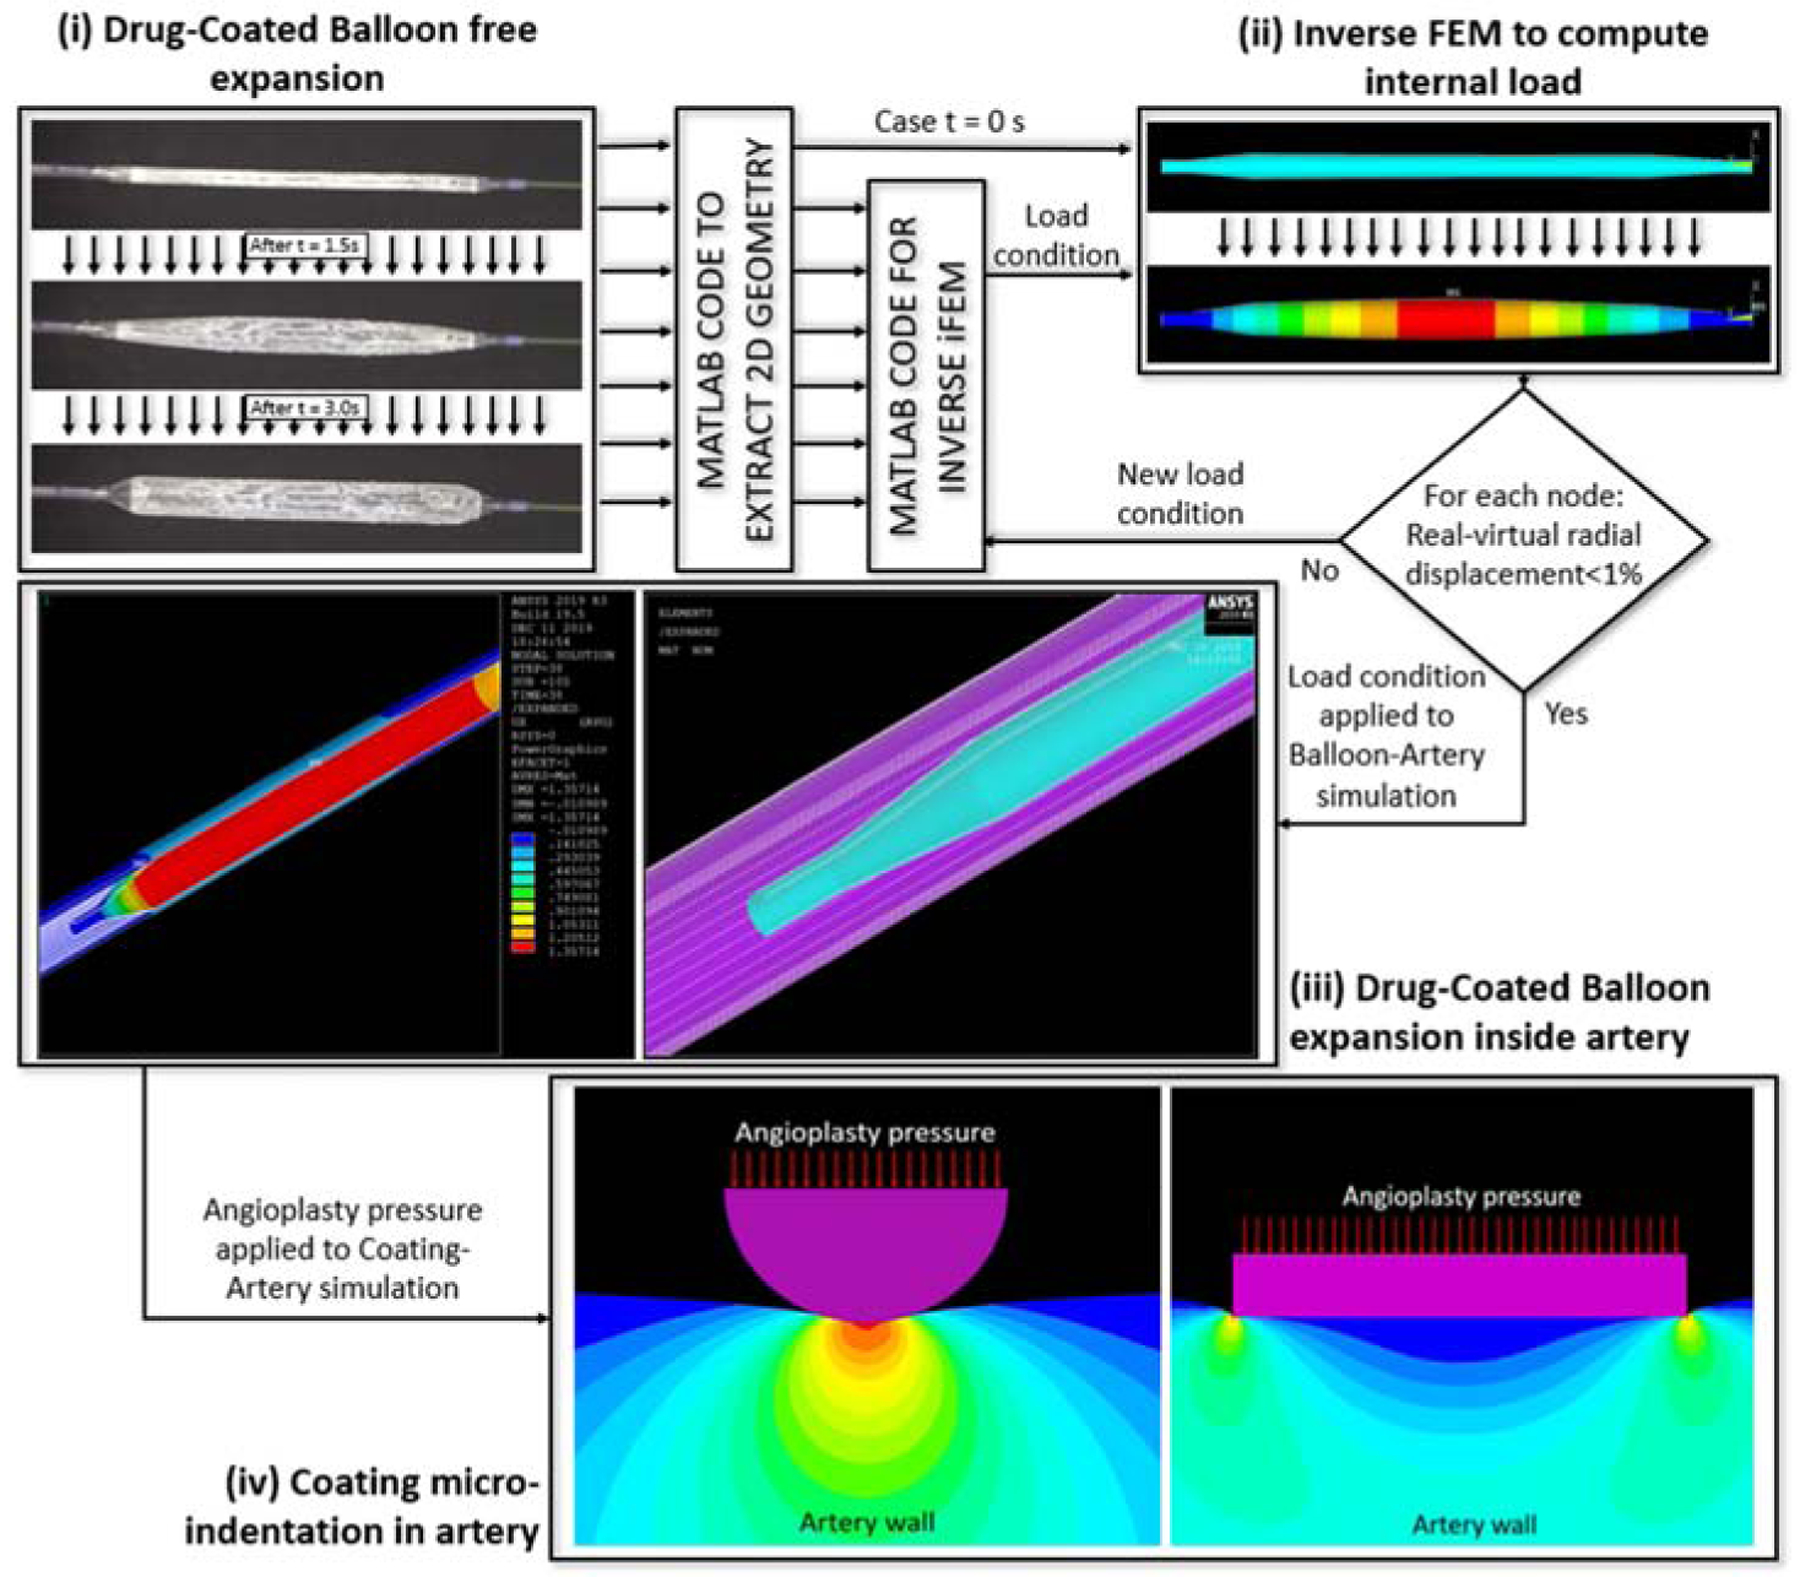
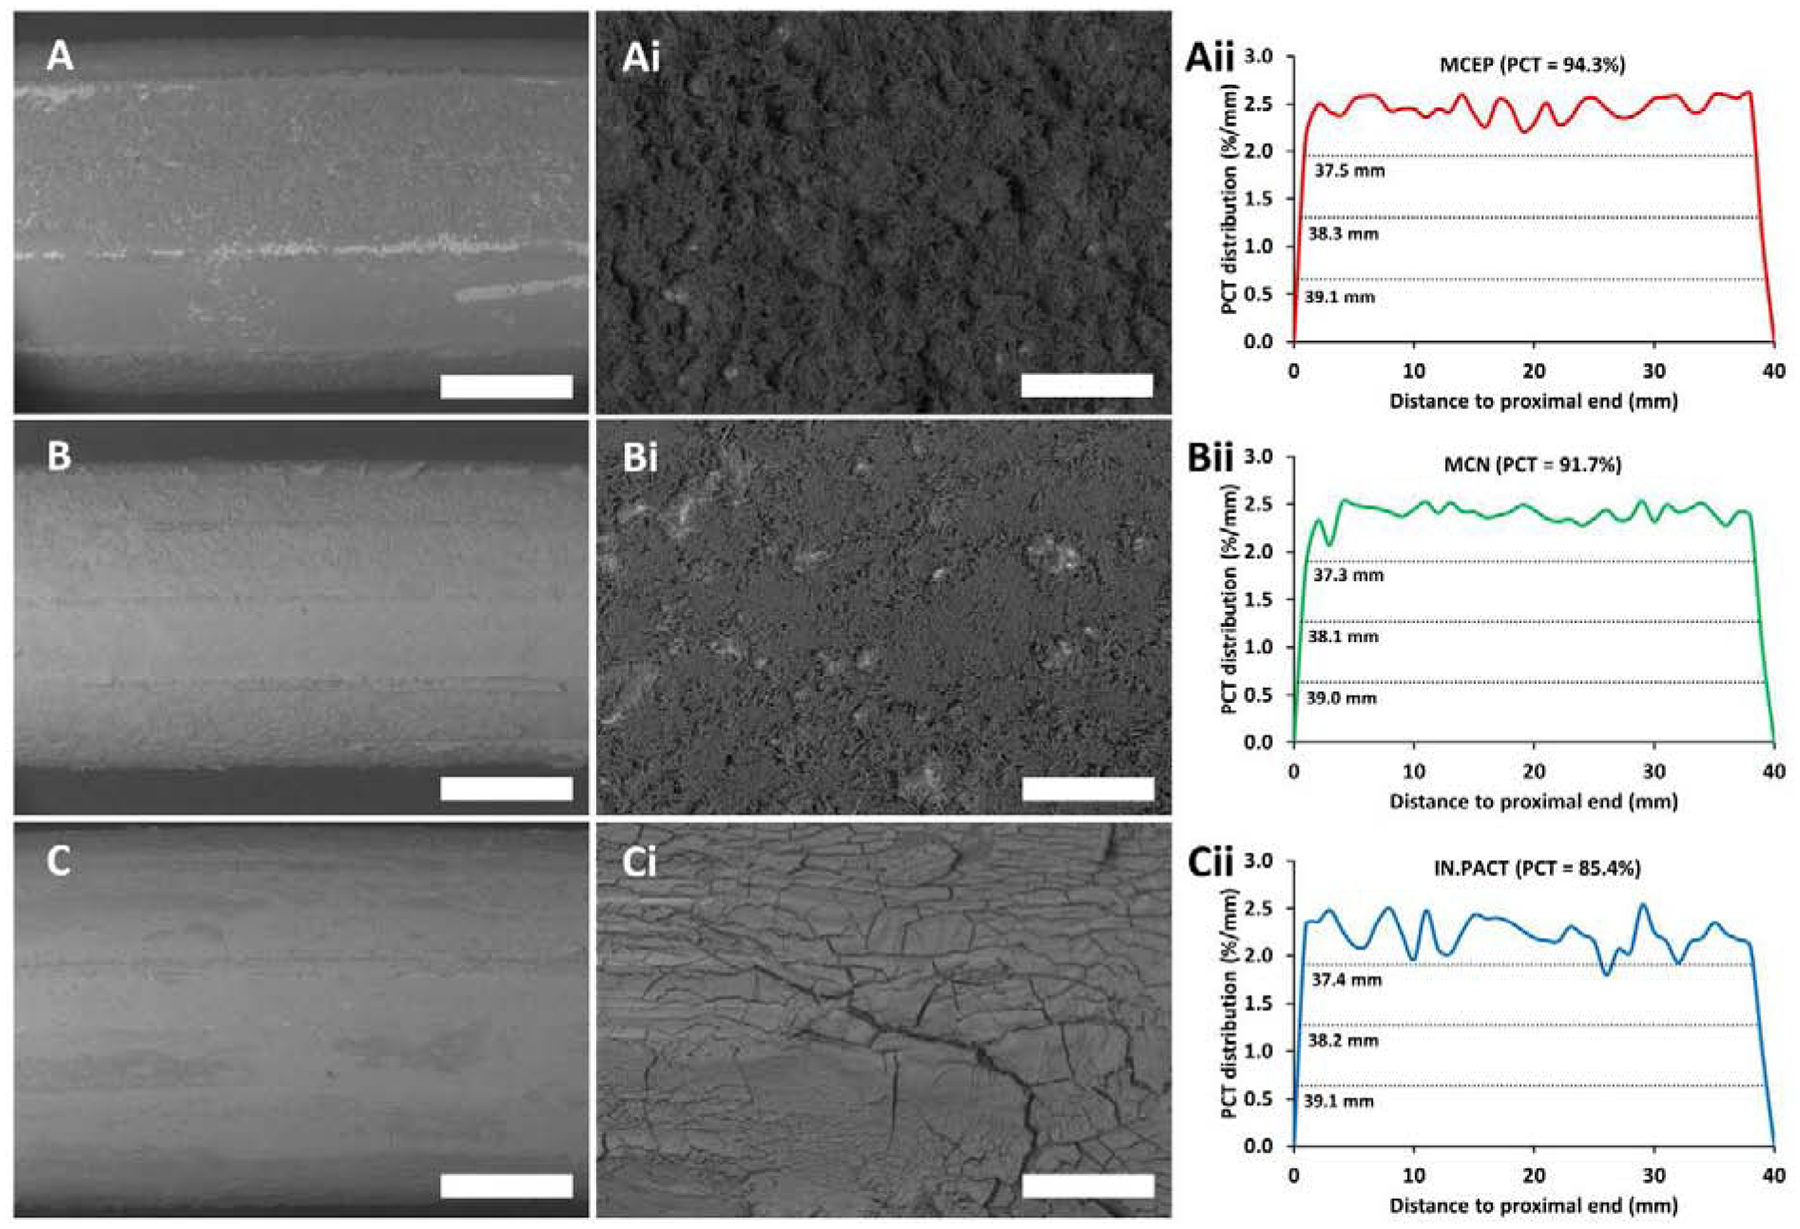
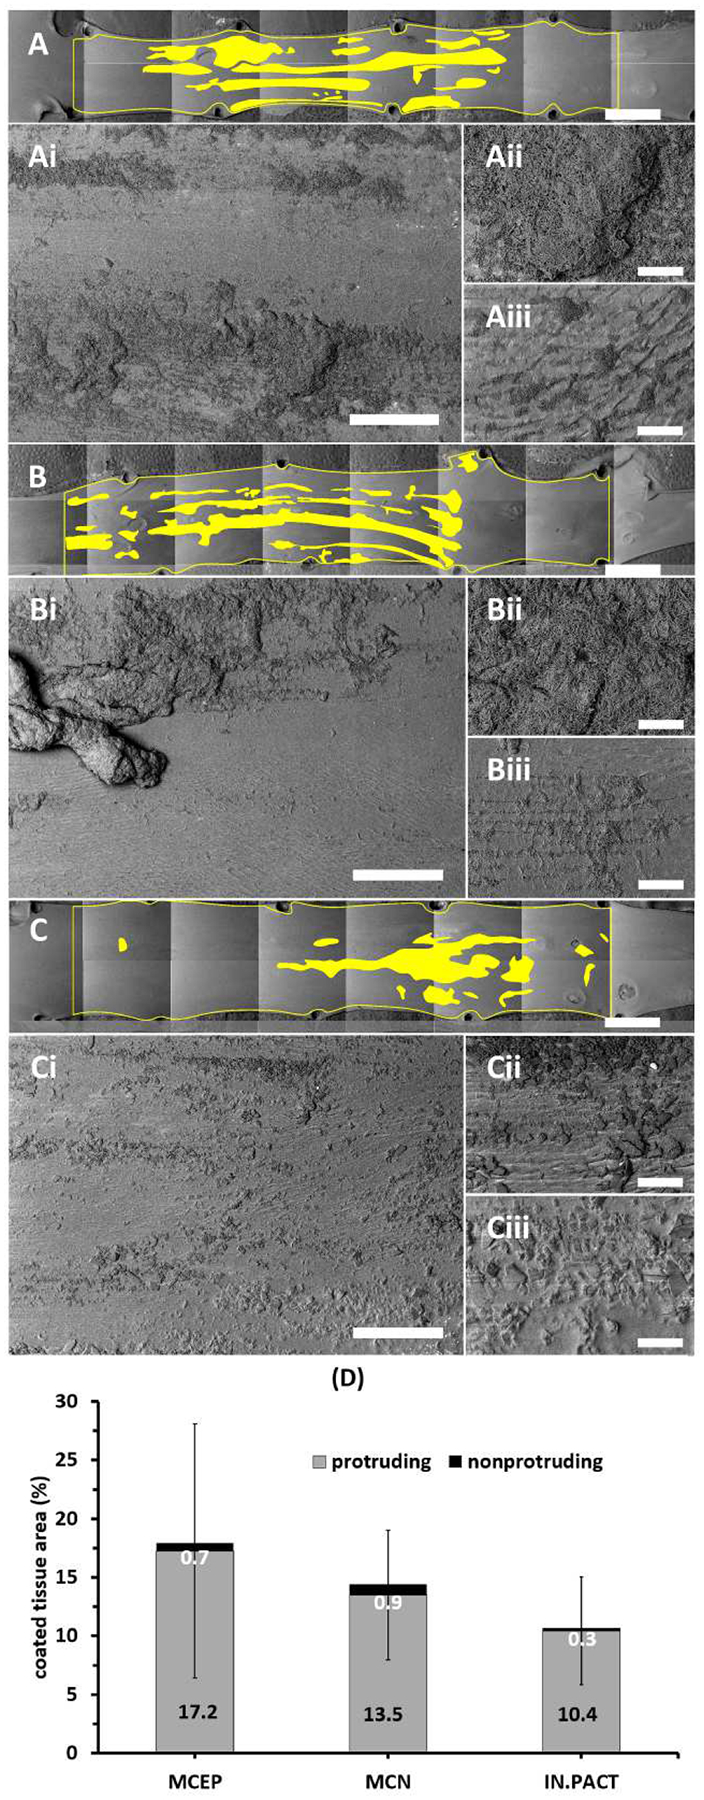
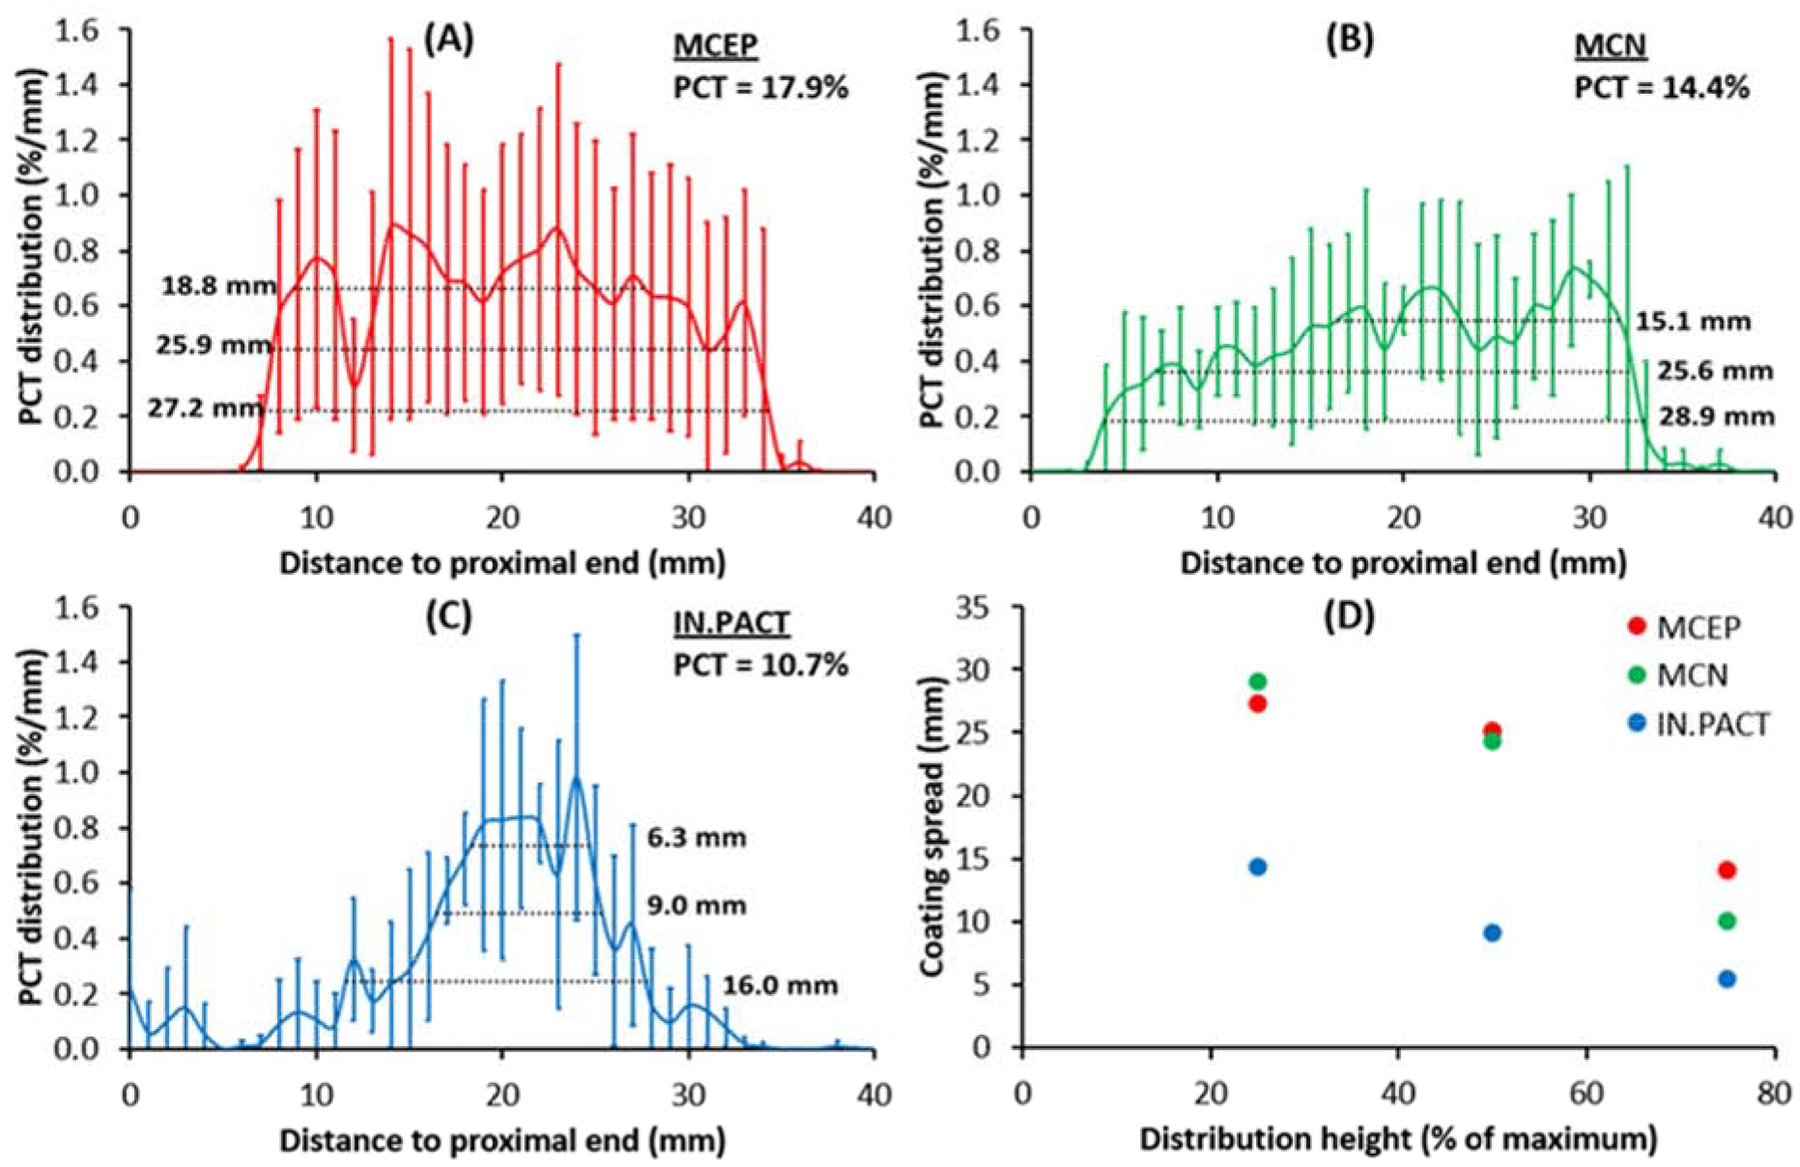
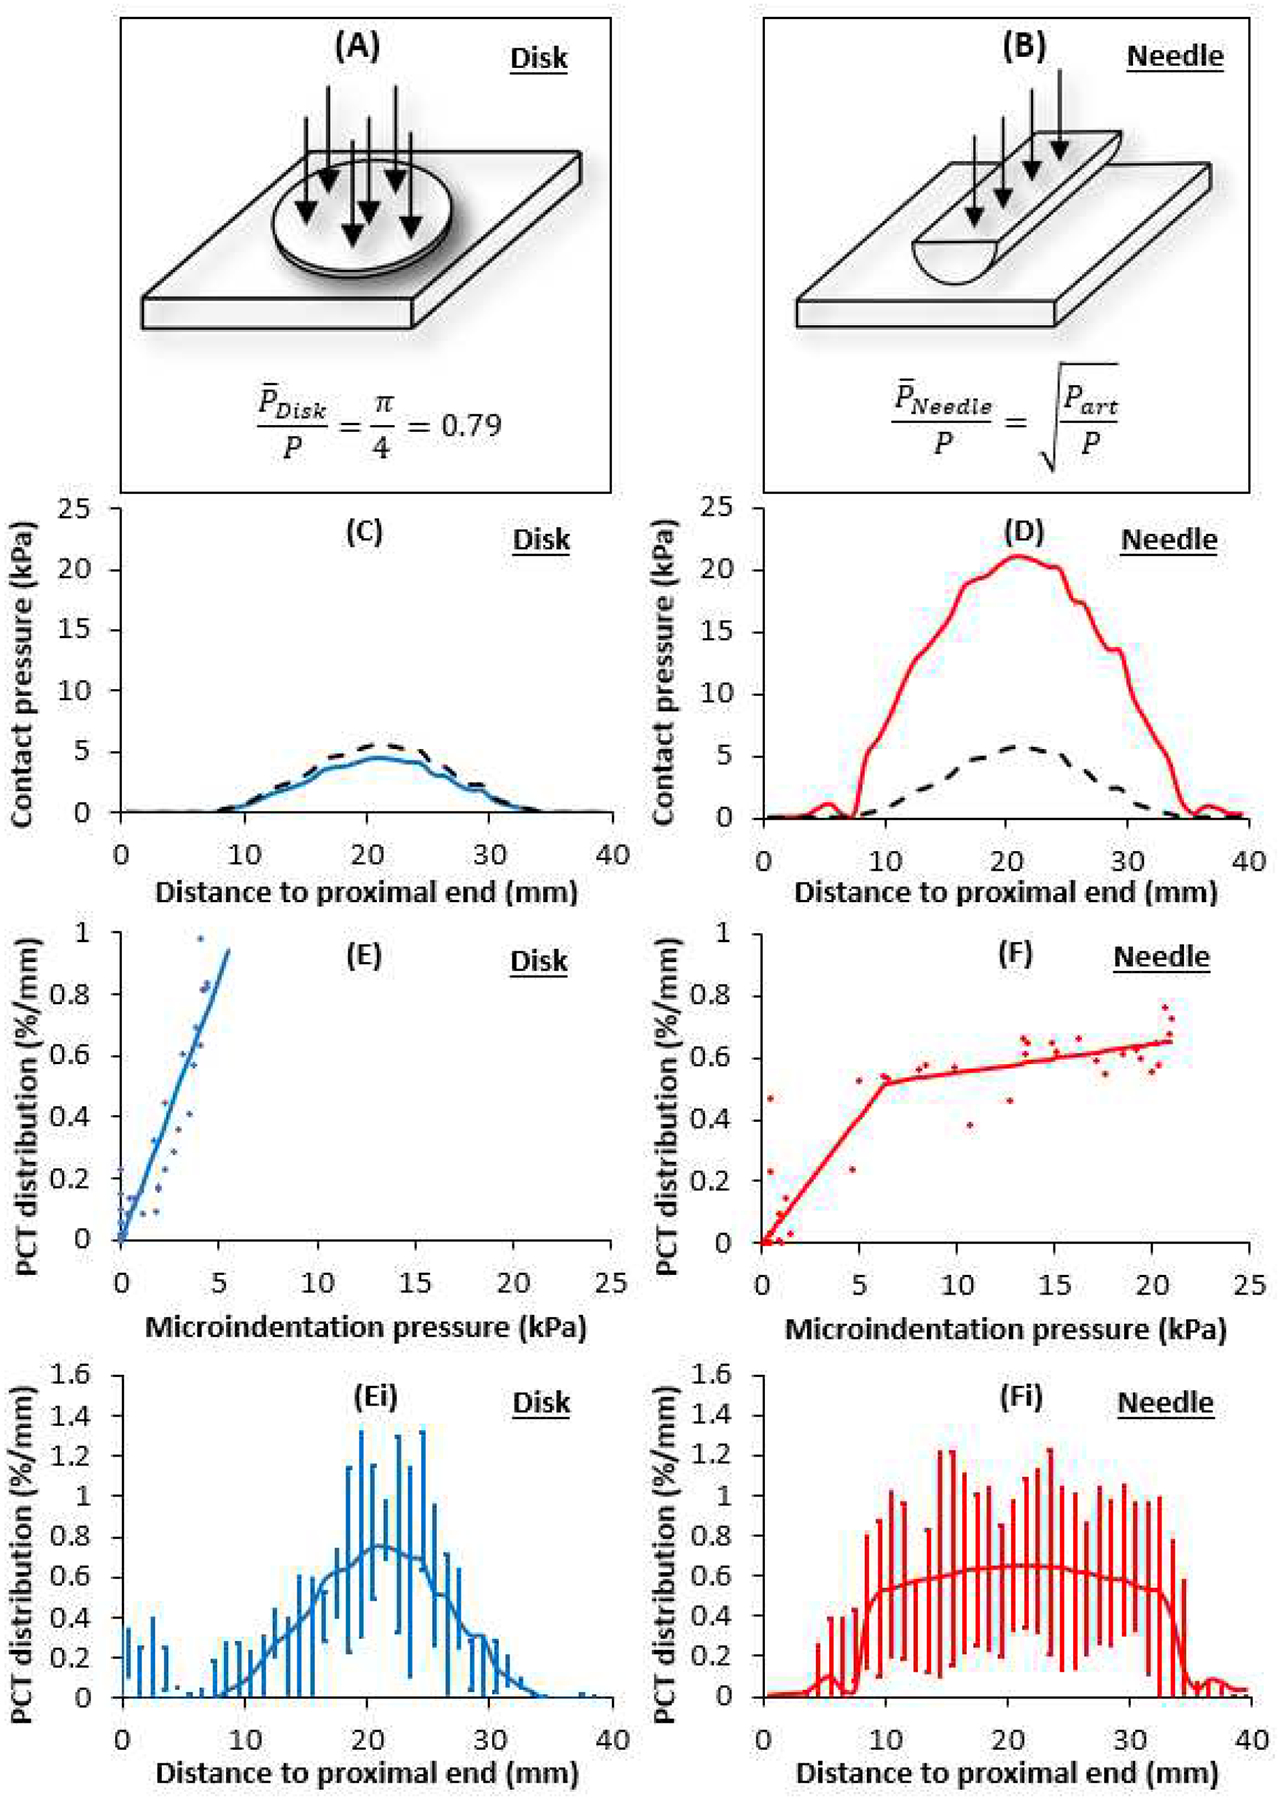
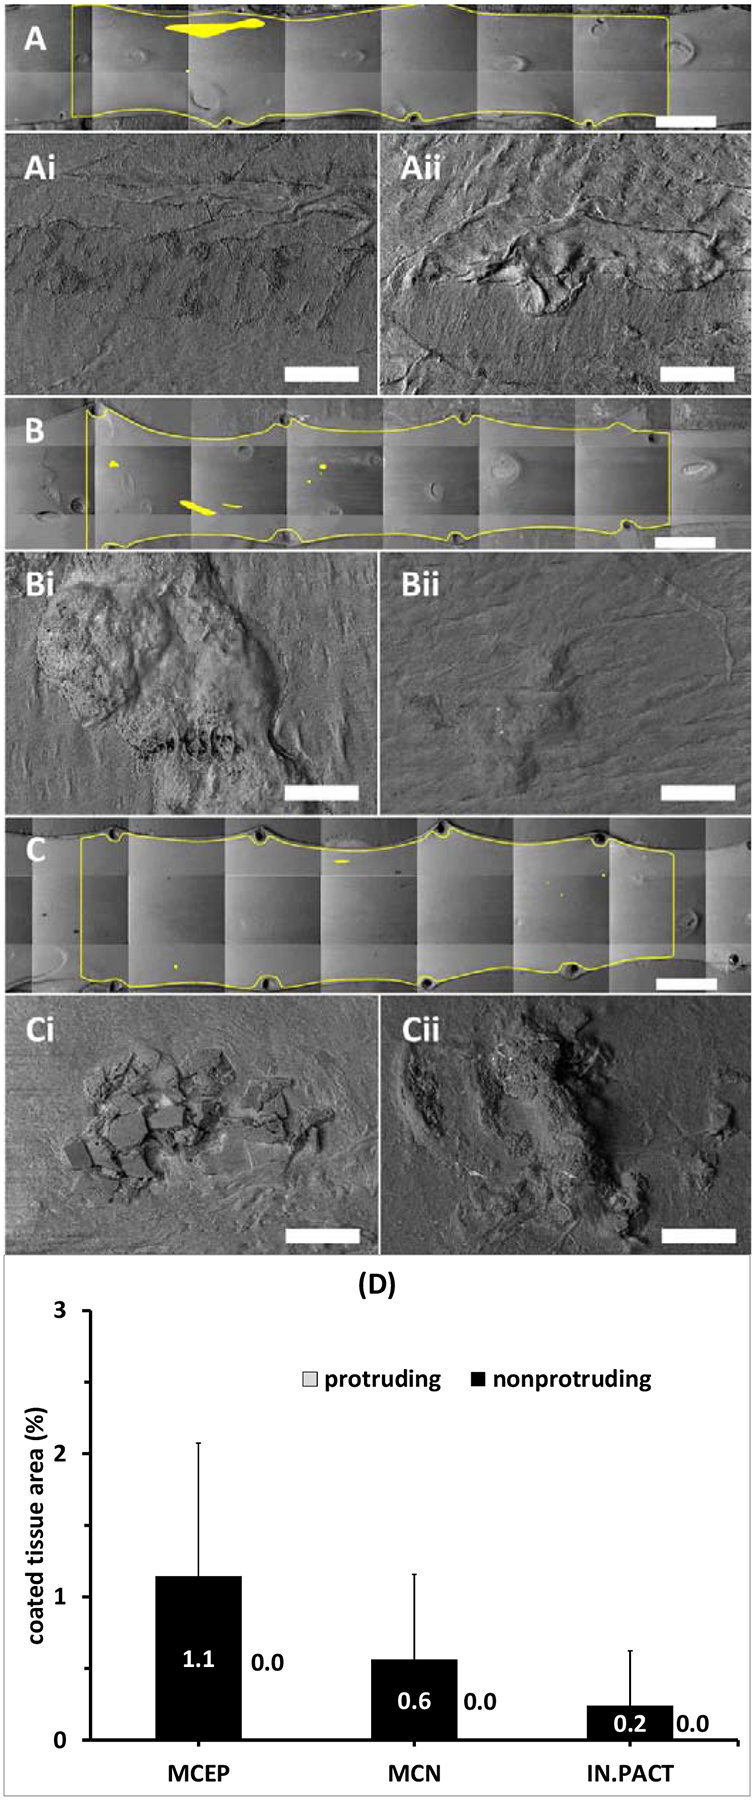
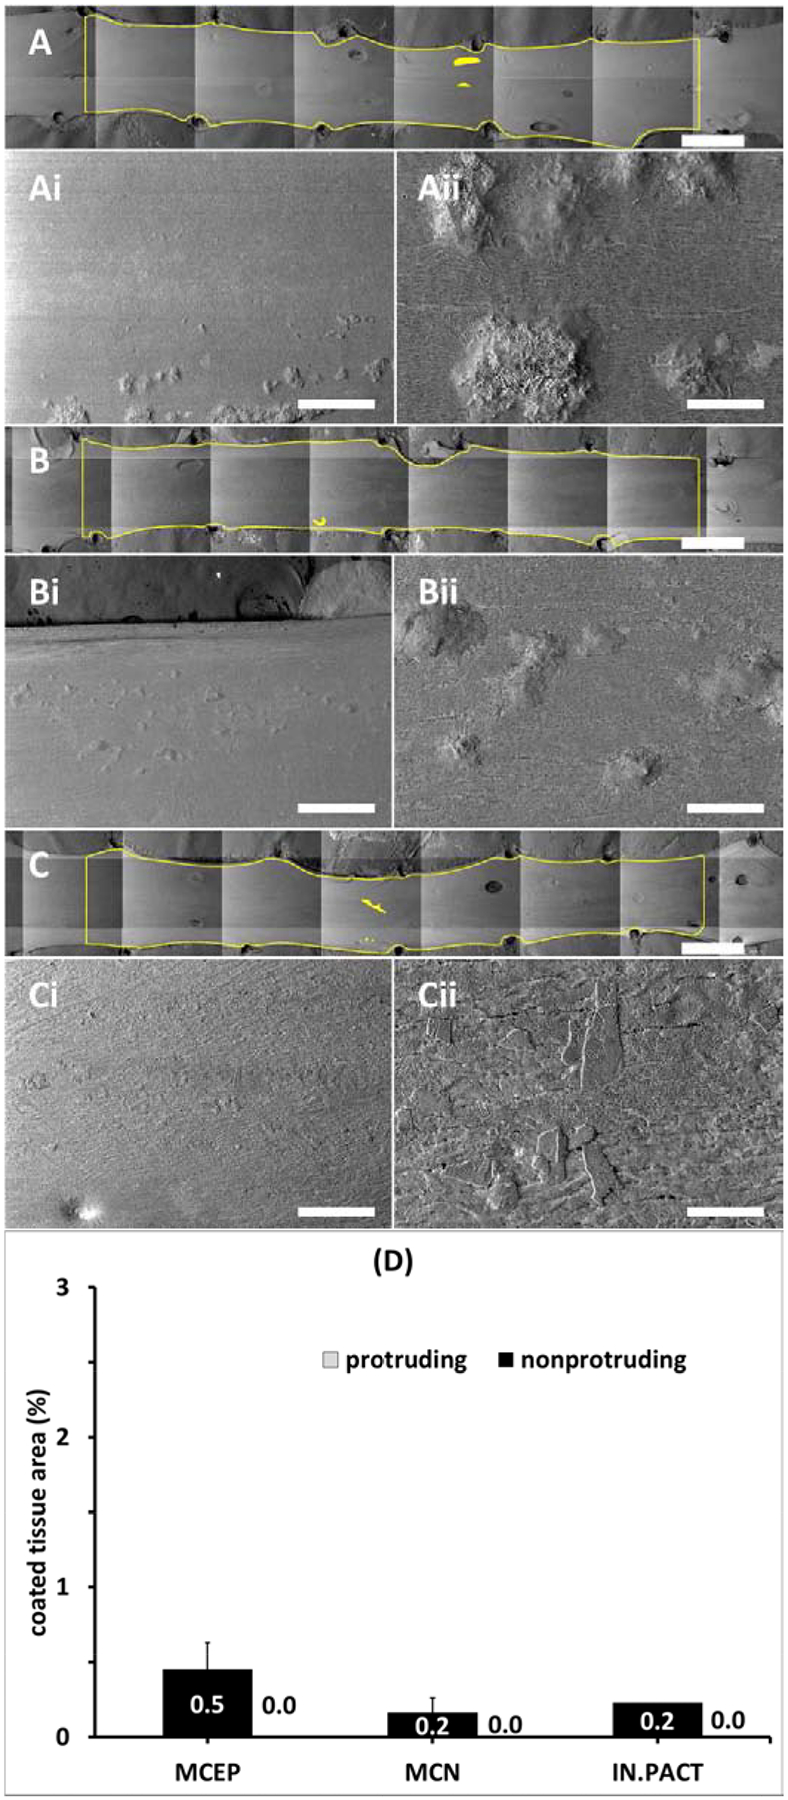
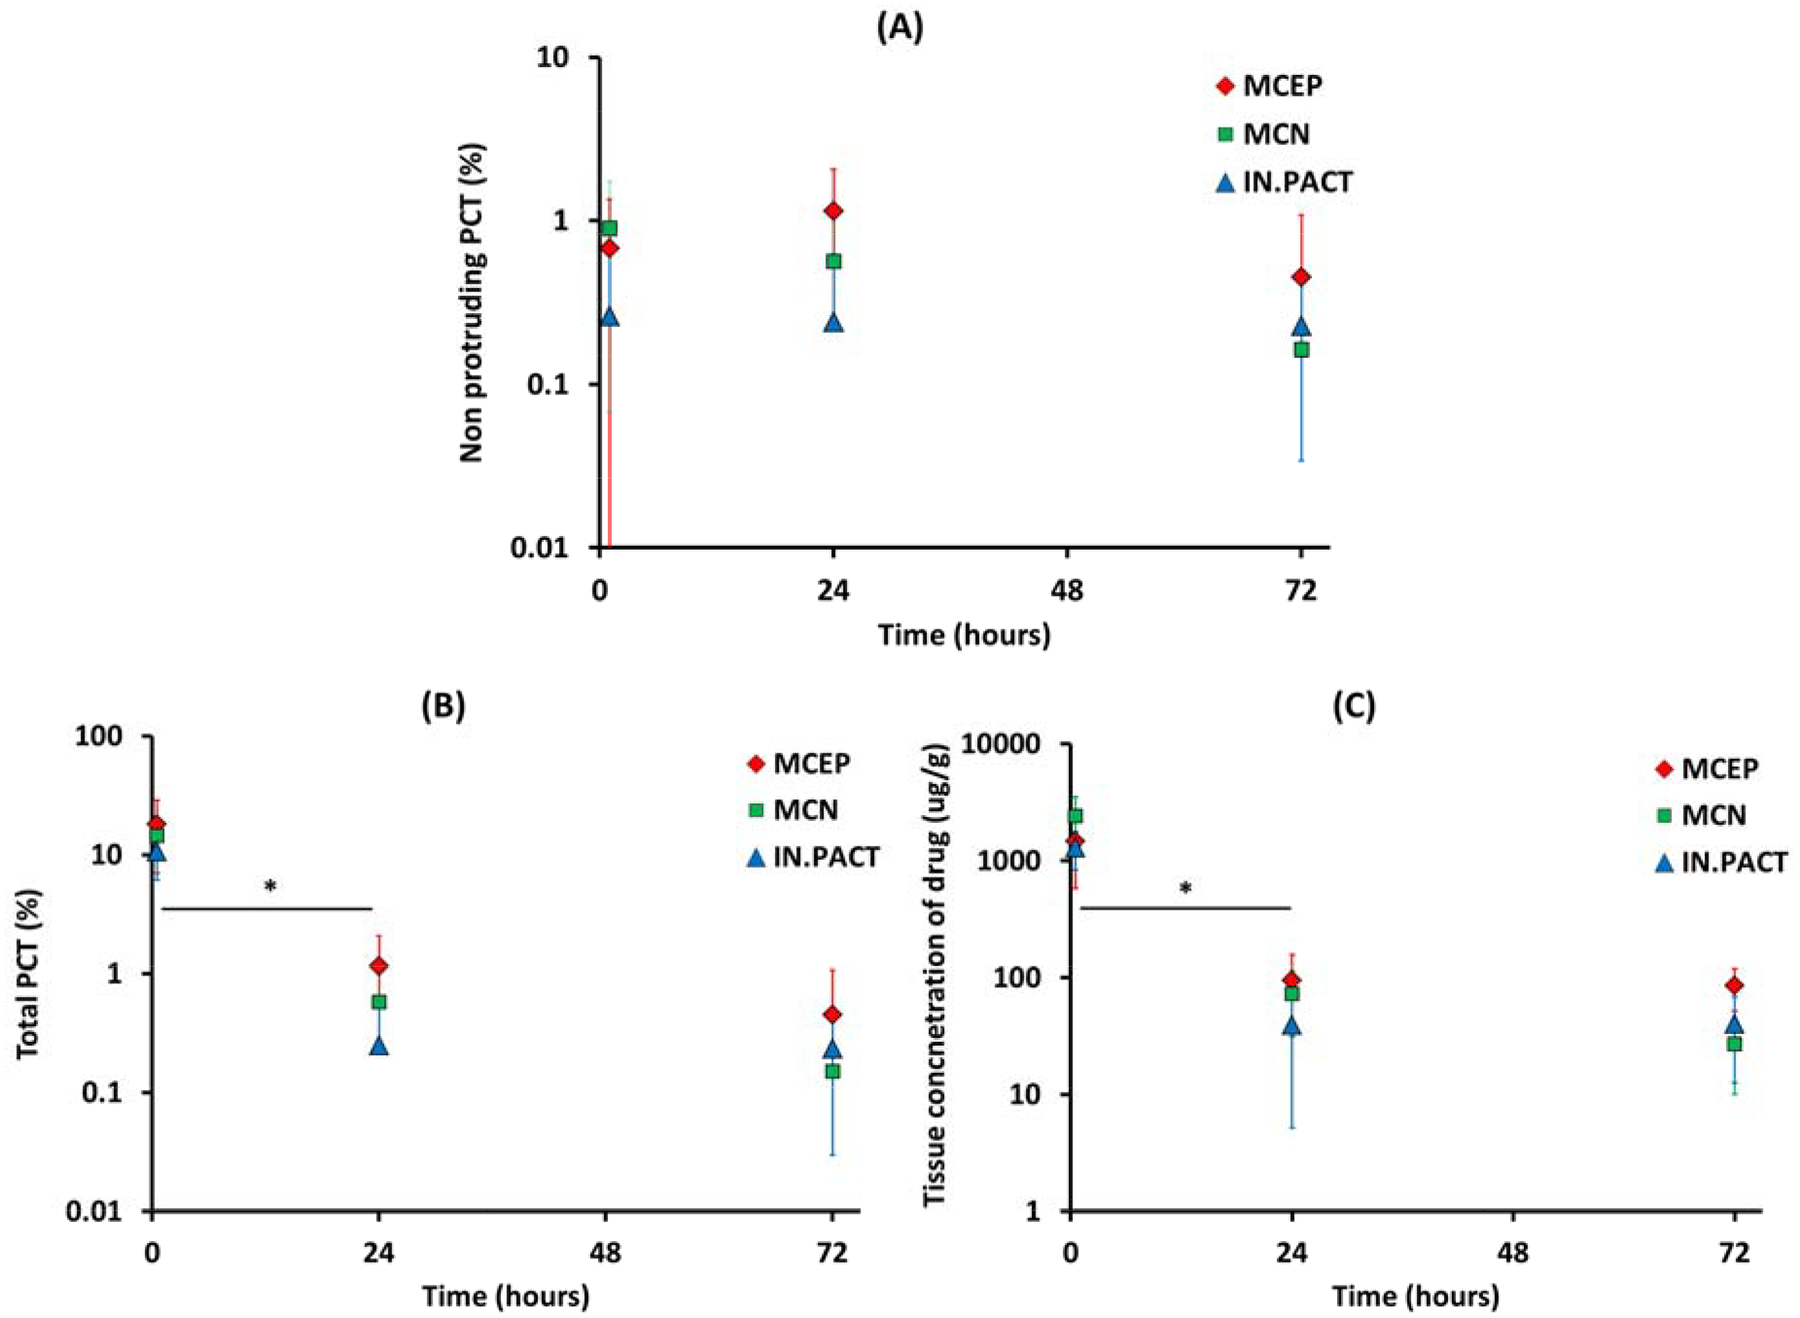
Paclitaxel coated balloon catheters (PCB) were developed as a polymer-free non-implantable alternative to drug eluting stents, delivering similar drug payloads in a matter of minutes. While PCB have shown efficacy in treating peripheral arterial disease in certain patient groups, restenosis rates remain high and there is no class effect. To help further optimize these devices, we developed a scanning electron microscopy (SEM) imaging technique and computational modeling approach that provide insights into the coating micromorphology dependence of in vivo drug transfer and retention. PCBs coated with amorphous/flaky or microneedle coatings were inflated for 60 sec in porcine femoral arteries. Animals were euthanized at 0.5, 24 and 72 h and treated arteries processed for SEM to image endoluminal coating distribution followed by paclitaxel quantification by mass spectrometry (MS). Endoluminal surfaces exhibited sparse coating patches at 0.5 h, predominantly protruding (13.71 vs 0.59%, P < 0.001), with similar micro-morphologies to nominal PCB surfaces. Microneedle coating covered a 1.5-fold endoluminal area (16.1 vs 10.7%, P = 0.0035) owing to higher proximal and distal delivery, and achieved 1.5-fold tissue concentrations by MS (1933 vs 1298 μg/g, P = 0.1745) compared to amorphous/flaky coating. Acute longitudinal coating distribution tracked computationally predicted microindentation pressure gradients (r = 0.9, P < 0.001), with superior transfer of the microneedle coatings attributed to their amplification of angioplasty contact pressures. By 24 h, paclitaxel concentration and coated tissue areas both declined by >93% even as nonprotruding coating levels were stable between 0.5 and 72 h, and 2.7-fold higher for microneedle vs flaky coating (0.64 vs 0.24%, P = 0.0195). Tissue retained paclitaxel concentrations at 24-72 h trended 1.7-fold higher post treatment with microneedle coating compared to the amorphous/flaky coating (69.9 vs 39.9 μg/g, P = 0.066). Thus, balloon based drug delivery is critically dependent on coating micromorphologies, with superior performance exhibited by micromorphologies that amplify angioplasty pressures.
Keywords: Coronary artery disease; Drug coated balloons; Paclitaxel; Peripheral artery disease.
Copyright © 2020 Elsevier Ltd. All rights reserved.
Conflict of interest statement
Declaration of interests
The authors declare that they have no known competing financial interests or personal relationships that could have appeared to influence the work reported in this paper.
Figures
Similar articles
-
Long-Term Outcomes After Treatment With a Paclitaxel-Coated Balloon Versus Balloon Angioplasty: Insights From the PEPCAD-DES Study (Treatment of Drug-eluting Stent [DES] In-Stent Restenosis With SeQuent Please Paclitaxel-Coated Percutaneous Transluminal Coronary Angioplasty [PTCA] Catheter).JACC Cardiovasc Interv. 2015 Nov;8(13):1695-700. doi: 10.1016/j.jcin.2015.07.023. JACC Cardiovasc Interv. 2015. PMID: 26476609 Clinical Trial.
-
Tissue uptake, distribution, and healing response after delivery of paclitaxel via second-generation iopromide-based balloon coating: a comparison with the first-generation technology in the iliofemoral porcine model.JACC Cardiovasc Interv. 2013 Aug;6(8):883-90. doi: 10.1016/j.jcin.2013.04.013. JACC Cardiovasc Interv. 2013. PMID: 23968706
-
Experimental evaluation of pharmacokinetic profile and biological effect of a novel paclitaxel microcrystalline balloon coating in the iliofemoral territory of swine.Catheter Cardiovasc Interv. 2014 Feb;83(2):325-33. doi: 10.1002/ccd.24982. Epub 2013 Oct 23. Catheter Cardiovasc Interv. 2014. PMID: 23703720
-
Paclitaxel-Coated Balloon for Femoropopliteal Artery Disease.Curr Cardiol Rep. 2017 Feb;19(2):10. doi: 10.1007/s11886-017-0823-4. Curr Cardiol Rep. 2017. PMID: 28185166 Review.
-
Drug-coated balloons for coronary and peripheral interventional procedures.Curr Cardiol Rep. 2012 Oct;14(5):635-41. doi: 10.1007/s11886-012-0290-x. Curr Cardiol Rep. 2012. PMID: 22825918 Review.
Cited by
-
Drug-loaded balloon with built-in NIR controlled tip-separable microneedles for long-effective arteriosclerosis treatment.Bioact Mater. 2022 Dec 6;23:526-538. doi: 10.1016/j.bioactmat.2022.11.015. eCollection 2023 May. Bioact Mater. 2022. PMID: 36514389 Free PMC article.
-
Drug-Coated Balloon in Acute Coronary Syndromes: Ready for the Prime Time?Curr Cardiol Rep. 2024 May;26(5):359-372. doi: 10.1007/s11886-024-02037-2. Epub 2024 Apr 15. Curr Cardiol Rep. 2024. PMID: 38619711 Review.
-
Endovascular Drug Delivery.Life (Basel). 2024 Mar 28;14(4):451. doi: 10.3390/life14040451. Life (Basel). 2024. PMID: 38672722 Free PMC article. Review.
-
Cardiovascular Tissue Engineering Models for Atherosclerosis Treatment Development.Bioengineering (Basel). 2023 Nov 29;10(12):1373. doi: 10.3390/bioengineering10121373. Bioengineering (Basel). 2023. PMID: 38135964 Free PMC article. Review.
-
Plaque heterogeneity and the spatial distributions of its components dictate drug-coated balloon therapy.Sci Rep. 2024 Feb 22;14(1):4412. doi: 10.1038/s41598-024-54756-9. Sci Rep. 2024. PMID: 38388639 Free PMC article.
References
-
- Drachman DE, Edelman ER, Seifert P, Groothuis AR, Bornstein DA, Kamath KR, Palasis M, Yang D, Nott SH, Rogers C. Neointimal thickening after stent delivery of paclitaxel: Change in composition and arrest of growth over six months. Journal of the American College of Cardiology. 2000;36:2325–2332 - PubMed
-
- Creel CJ, Lovich MA, Edelman ER. Arterial paclitaxel distribution and deposition. Circ Res. 2000;86:879–884 - PubMed
-
- Axel DI, Kunert W, Goggelmann C, Oberhoff M, Herdeg C, Kuttner A, Wild DH, Brehm BR, Riessen R, Koveker G, Karsch KR. Paclitaxel inhibits arterial smooth muscle cell proliferation and migration in vitro and in vivo using local drug delivery. Circulation. 1997;96:636–645 - PubMed
Publication types
MeSH terms
Substances
Grants and funding
LinkOut - more resources
Full Text Sources
