. 2020 Oct 15;5(20):e142167.
doi: 10.1172/jci.insight.142167.

High levels of SARS-CoV-2-specific T cells with restricted functionality in severe courses of COVID-19

Affiliations

High levels of SARS-CoV-2-specific T cells with restricted functionality in severe courses of COVID-19

David Schub et al. JCI Insight. .

Abstract

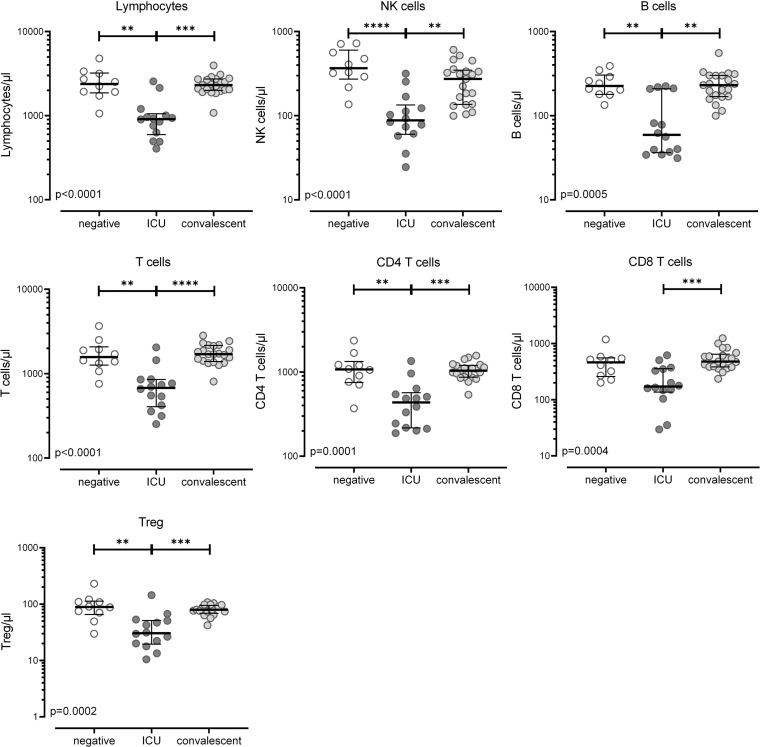
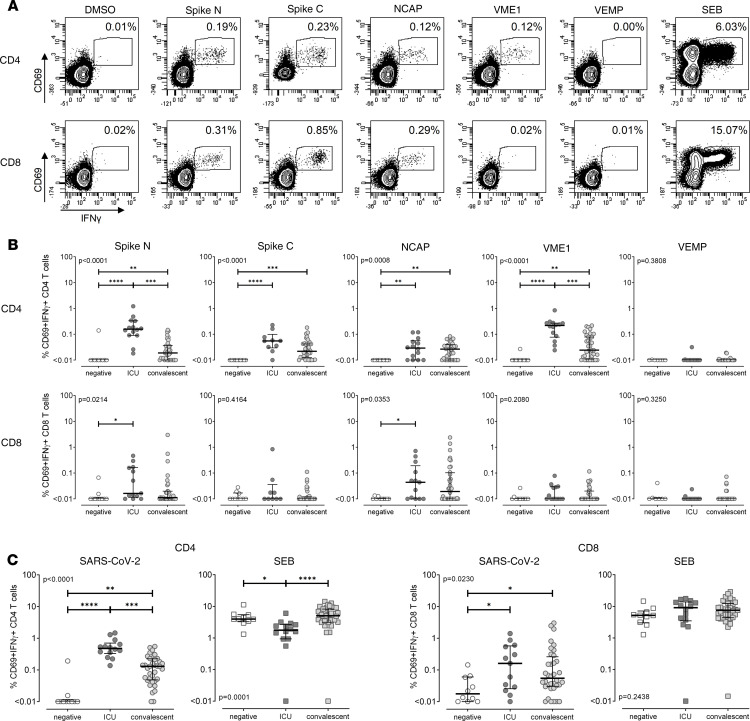
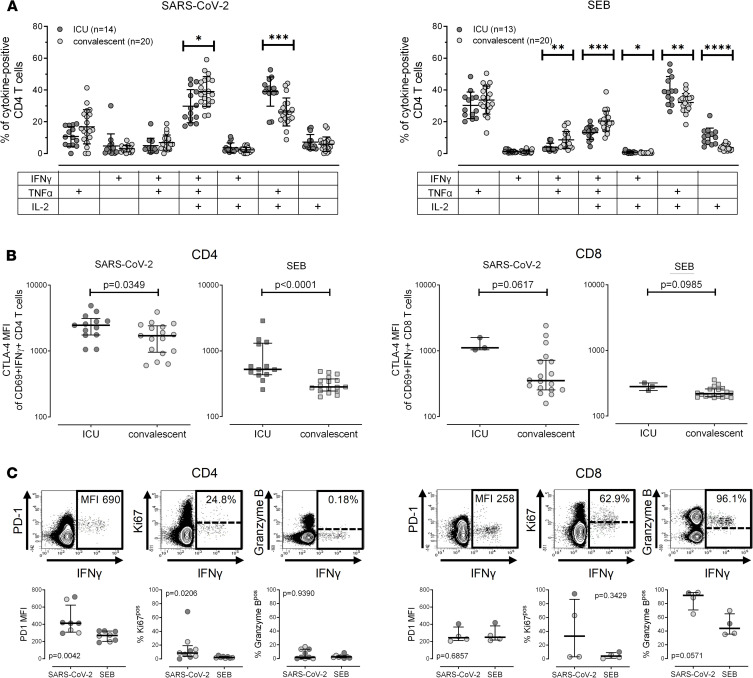
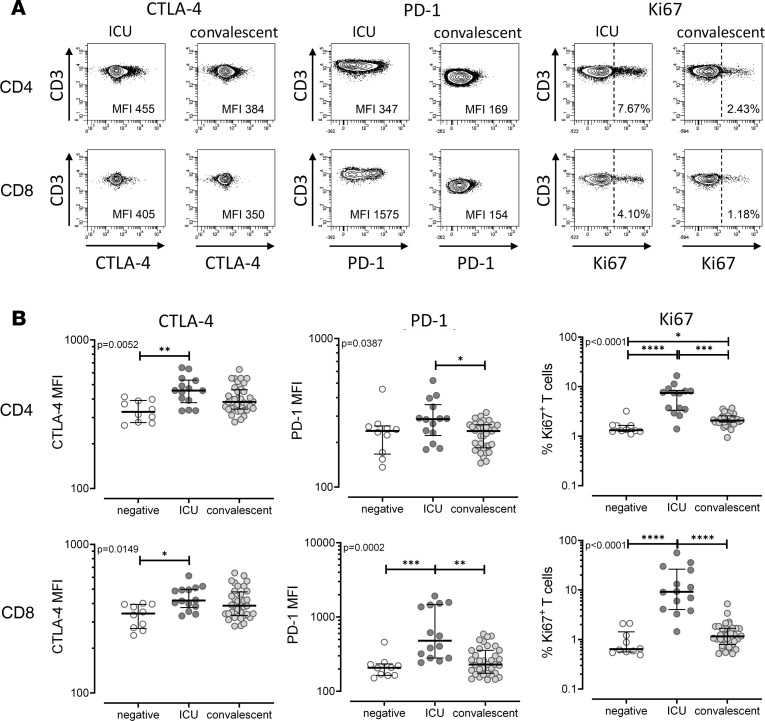
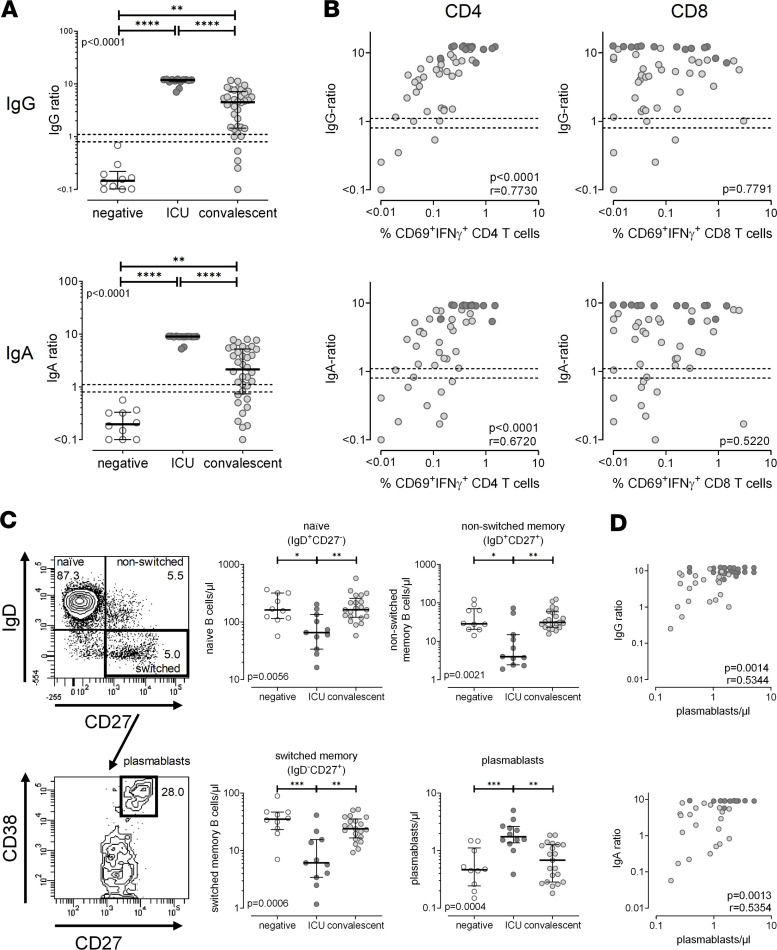
BACKGROUNDPatients infected with severe acute respiratory syndrome coronavirus 2 (SARS-CoV-2) differ in the severity of disease. We hypothesized that characteristics of SARS-CoV-2-specific immunity correlate with disease severity.METHODSIn this study, SARS-CoV-2-specific T cells and antibodies were characterized in uninfected controls and patients with different coronavirus disease 2019 (COVID-19) disease severity. SARS-CoV-2-specific T cells were flow cytometrically quantified after stimulation with SARS-CoV-2 peptide pools and analyzed for expression of cytokines (IFN-γ, IL-2, and TNF-α) and markers for activation, proliferation, and functional anergy. SARS-CoV-2-specific IgG and IgA antibodies were quantified using ELISA. Moreover, global characteristics of lymphocyte subpopulations were compared between patient groups and uninfected controls.RESULTSDespite severe lymphopenia affecting all major lymphocyte subpopulations, patients with severe disease mounted significantly higher levels of SARS-CoV-2-specific T cells as compared with convalescent individuals. SARS-CoV-2-specific CD4+ T cells dominated over CD8+ T cells and closely correlated with the number of plasmablasts and SARS-CoV-2-specific IgA and IgG levels. Unlike in convalescent patients, SARS-CoV-2-specific T cells in patients with severe disease showed marked alterations in phenotypical and functional properties, which also extended to CD4+ and CD8+ T cells in general.CONCLUSIONGiven the strong induction of specific immunity to control viral replication in patients with severe disease, the functionally altered characteristics may result from the need for contraction of specific and general immunity to counteract excessive immunopathology in the lung.FUNDINGThe study was supported by institutional funds to MS and in part by grants of Saarland University, the State of Saarland, and the Rolf M. Schwiete Stiftung.

Keywords: COVID-19; Cellular immune response; Immunoglobulins; T cells.


Conflict of interest statement

Conflict of interest: The authors have declared that no conflict of interest exists.

Figures

Figure 1
Figure 1. Reduced counts of lymphocytes and lymphocyte subpopulations in patients with severe COVID-19.
Absolute cell numbers per microliter whole blood of lymphocytes and lymphocyte subpopulations were calculated in SARS-CoV-2–negative individuals (n = 10), patients with severe COVID-19 (n = 14), and convalescent patients (n = 21) based on flow cytometry and differential blood counts. Flow cytometry data were obtained from all convalescent patients, but 15/36 had to be excluded because no differential blood count was available. Natural killer (NK) cells were defined as CD3CD16+/CD56+, B cells as CD19+, T cells as CD3+, CD4+ and CD8+ T cells as CD4+CD8 and CD8+CD4 T cells, and regulatory T cells (Tregs) as CD4+CD25hiCD127lo within lymphocytes, respectively. Bars represent medians with IQRs. Differences between the groups were calculated using Kruskal-Wallis test and Dunn’s posttest. **P < 0.01, ***P < 0.001, ****P < 0.0001.
Figure 2
Figure 2. Increased percentages of SARS-CoV-2–specific T cells in patients with severe COVID-19.
Whole-blood samples were stimulated with overlapping peptide pools spanning the SARS-CoV-2 spike protein (spike N, N-terminal; spike C, C-terminal), the NCAP protein, the membrane protein VME1, and the envelope small membrane protein VEMP. Stimulations with DMSO and SEB served as negative controls and polyclonal stimulus, respectively. (A) Contour plots illustrating specific immunity from a 56-year-old hospitalized patient are shown. Numbers indicate percentage of reactive (CD69+IFN-γ+) cells within total CD4+ and CD8+ T cells. (B) Percentages of CD4+ and CD8+ T cells specific for the different SARS-CoV-2 antigens were compared between SARS-CoV-2–negative individuals (negative, n = 10), patients with severe COVID-19 (ICU, n = 14), and convalescent patients (n = 36). (C) Total percentages of SARS-CoV-2–specific (CD69+IFN-γ+) T cells, determined by the sum of frequencies toward the individual peptide pools for each individual, and SEB-reactive T cell frequencies are compared between the 3 groups. Bars represent medians with IQRs. Differences between the groups were calculated using Kruskal-Wallis test and Dunn’s posttest. *P < 0.05, **P < 0.01, ***P < 0.001, ****P < 0.0001.
Figure 3
Figure 3. Altered cytokine profiles and characteristics of SARS-CoV-2–specific T cells in patients with a severe course of COVID-19.
Expression patterns of SARS-CoV-2–specific T cells were determined from combined T cells reacting to the individual peptide pools for each individual. (A) SARS-CoV-2–specific and SEB-reactive CD4+ T cells were divided into 7 subpopulations according to their expression of the cytokines IFN-γ, IL-2, and TNF-α. Distribution of these subgroups was compared between ICU patients and convalescent patients. To ensure robust statistical analysis, cytokine profiling was restricted to CD4+ T cells and to all samples with at least 35 measurable CD69+IFN-γ+ cells (all ICU patients and 20 convalescent patients). (B) CTLA-4 expression of SARS-CoV-2–specific and SEB-reactive CD4+ and CD8+ T cells was compared between ICU patients and convalescent patients. Analysis was restricted to individuals with sufficient SARS-CoV-2–specific immunity, i.e., where the total number of measurable CD69+IFN-γ+ cells reached at least 20 cells (n = 13 and 3 ICU patients and 17 and 18 convalescent patients for CD4+ and CD8+ T cells, respectively). (C) In a subgroup of 10 patient samples (5 ICU patients and 5 convalescent patients), where a larger sample volume for in vitro stimulations was available, expression of PD-1, Ki67, and granzyme B of SARS-CoV-2–specific and SEB-reactive CD4+ and CD8+ T cells was analyzed. Overlaid contour plots (built using BD FACSDiva 8) of samples from a 31-year-old convalescent patient stimulated with SARS-CoV-2 antigens are shown in the upper panel. PD-1 MFI was analyzed from all stimulatory reactions with at least 20 CD69+IFN-γ+ cells (n = 8 and 4 for CD4+ and CD8+ T cells, respectively). Analysis of intranuclear presence of Ki67 (%Ki67+) and expression of granzyme B (%granzyme B+) was restricted to samples with at least 20 specific CD4+ (n = 8 for SARS-CoV-2 and n = 7 for SEB) or CD8+ T cells (n = 4), respectively. ICU patients are depicted by dark symbols and convalescent patients by light symbols. Bar charts in A represent mean and SD, and differences between the 2 groups were assessed using unpaired 2-tailed t test. Bars in B and C represent medians with IQRs. Differences between the groups were calculated using Mann-Whitney U test. *P < 0.05, **P < 0.01, ***P < 0.001, ****P < 0.0001. MFI, median fluorescence intensity.
Figure 4
Figure 4. Altered characteristics of global CD4+ and CD8+ T cells in patients with severe COVID-19.
(A) Representative contour plots showing expression of CTLA-4 and PD-1 and intranuclear Ki67 expression of unstimulated total CD4+ and CD8+ T cells from an ICU patient and a convalescent individual. Because cells showed a continuum in the expression of CTLA-4 and PD-1, cell surface expression levels of CTLA-4 and PD-1 were expressed as MFI. Numbers indicate expression levels (MFI) of CTLA-4 and PD-1 and percentage of Ki67+ cells among total CD4+ and CD8+ T cells. (B) Results were compared among SARS-CoV-2–negative individuals (negative, n = 10), patients with severe COVID-19 (ICU, n = 14), and convalescent patients (n = 36). Bars represent medians with IQRs. Differences between the groups were calculated using Kruskal-Wallis test and Dunn’s posttest. *P < 0.05, **P < 0.01, ***P < 0.001, ****P < 0.0001.
Figure 5
Figure 5. Strong correlation of SARS-CoV-2–specific CD4+ T cell levels with specific IgG and IgA antibodies and plasmablasts.
(A) Levels of SARS-CoV-2–specific IgG and IgA were compared among SARS-CoV-2–negative individuals (negative, n = 10), patients with severe COVID-19 (ICU, n = 14), and convalescent patients (n = 36). (B) Correlation between levels of SARS-CoV-2–specific IgG or IgA with frequencies of SARS-CoV-2–specific CD69+IFN-γ+ CD4+ or CD8+ T cells expressed in patients with SARS-CoV-2. (C) Representative contour plots of a 64-year-old hospitalized patient showing the differentiation status of B cells characterized by surface expression of IgD and CD27, with plasmablasts identified among switched memory B cells by additional staining of CD38. Numbers of B cell subpopulations and plasmablasts were compared between groups, and (D) plasmablasts were correlated with levels of SARS-CoV-2–specific IgG and IgA. Antibody levels were determined semiquantitatively by dividing the optical density of an individual sample by that of a positive control serum. Bars in A and C represent medians with IQRs. Differences between the groups were calculated using Kruskal-Wallis test and Dunn’s posttest. *P < 0.05, **P < 0.01, ***P < 0.001, ****P < 0.0001. Correlations in B and D were analyzed according to Spearman. Dotted lines indicate detection limits for IgG and IgA, indicating negative, intermediate, and positive levels, respectively, as per manufacturer’s instructions.

Similar articles

Cited by

References

    1. Huang C, et al. Clinical features of patients infected with 2019 novel coronavirus in Wuhan, China. Lancet. 2020;395(10223):497–506. doi: 10.1016/S0140-6736(20)30183-5. - DOI - PMC - PubMed
    1. Guan WJ, et al. Clinical characteristics of coronavirus disease 2019 in China. N Engl J Med. 2020;382(18):1708–1720. doi: 10.1056/NEJMoa2002032. - DOI - PMC - PubMed
    1. Wang F, et al. Characteristics of peripheral lymphocyte subset alteration in COVID-19 pneumonia. J Infect Dis. 2020;221(11):1762–1769. doi: 10.1093/infdis/jiaa150. - DOI - PMC - PubMed
    1. Chen G, et al. Clinical and immunological features of severe and moderate coronavirus disease 2019. J Clin Invest. 2020;130(5):2620–2629. doi: 10.1172/JCI137244. - DOI - PMC - PubMed
    1. Wang F, et al. The laboratory tests and host immunity of COVID-19 patients with different severity of illness. JCI Insight. 2020;5(10):137799. - PMC - PubMed

Publication types

MeSH terms