

Predictors of Death Rate during the COVID-19 Pandemic
- PMID: 32937804
- PMCID: PMC7551935
- DOI: 10.3390/healthcare8030339
Predictors of Death Rate during the COVID-19 Pandemic
Abstract
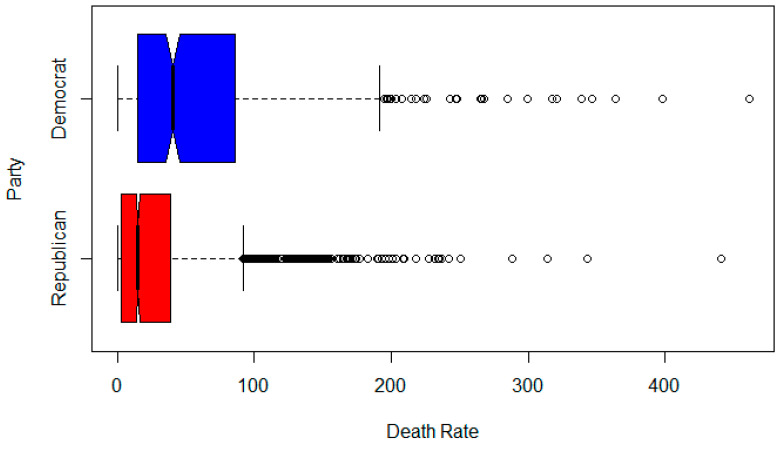
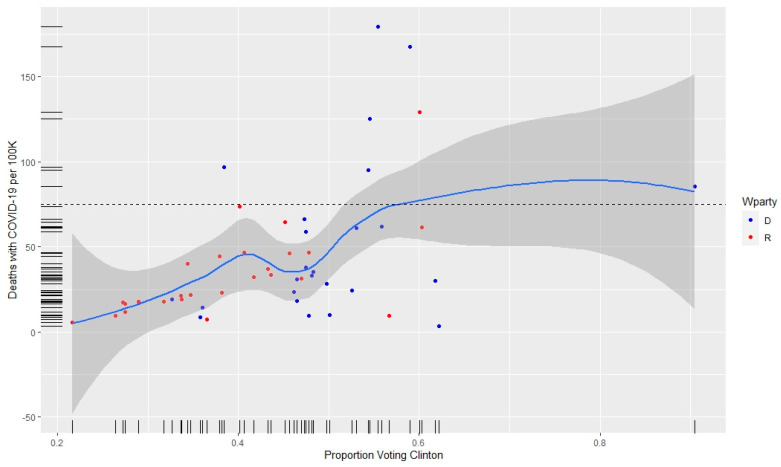
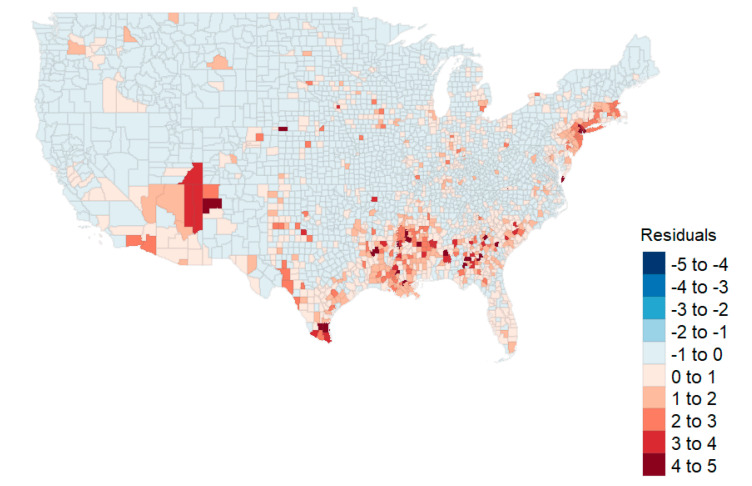
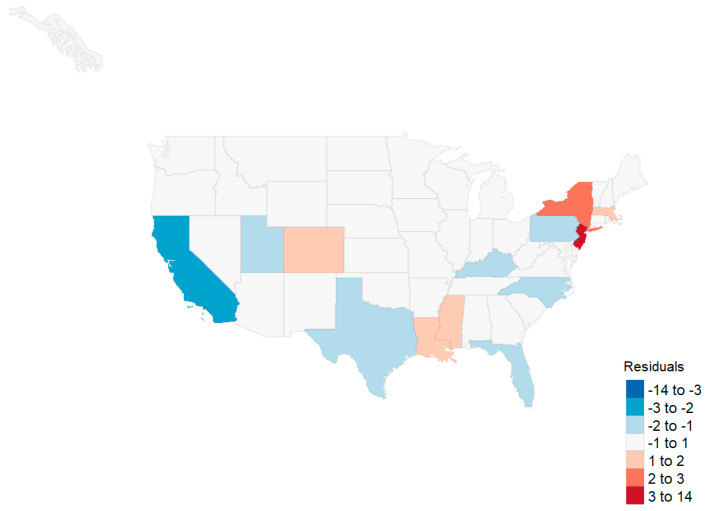
Coronavirus (COVID-19) is a potentially fatal viral infection. This study investigates geography, demography, socioeconomics, health conditions, hospital characteristics, and politics as potential explanatory variables for death rates at the state and county levels. Data from the Centers for Disease Control and Prevention, the Census Bureau, Centers for Medicare and Medicaid, Definitive Healthcare, and USAfacts.org were used to evaluate regression models. Yearly pneumonia and flu death rates (state level, 2014-2018) were evaluated as a function of the governors' political party using a repeated measures analysis. At the state and county level, spatial regression models were evaluated. At the county level, we discovered a statistically significant model that included geography, population density, racial and ethnic status, three health status variables along with a political factor. A state level analysis identified health status, minority status, and the interaction between governors' parties and health status as important variables. The political factor, however, did not appear in a subsequent analysis of 2014-2018 pneumonia and flu death rates. The pathogenesis of COVID-19 has a greater and disproportionate effect within racial and ethnic minority groups, and the political influence on the reporting of COVID-19 mortality was statistically relevant at the county level and as an interaction term only at the state level.
Keywords: COVID-19; geospatial regression; health disparities; public health.
Conflict of interest statement
The authors declare no conflict of interest.
Figures
References
-
- USAFacts Nonpartisan Government Data. [(accessed on 7 August 2020)]; Available online: https://usafacts.org/
-
- JohnsHopkins COVID-19 Map. [(accessed on 4 August 2020)]; Available online: https://coronavirus.jhu.edu/map.html.
-
- Weller M.W., Wheat A.D., Fleischmann J.F. COVID-19 Will Reshape the 2020 Presidential Campaign. [(accessed on 31 August 2020)]; Available online: https://www.natlawreview.com/article/covid-19-will-reshape-2020-presiden....
-
- Newall M. Most Americans Support Single, National Strategy to Combat COVID-19. [(accessed on 7 August 2020)]; Available online: https://www.ipsos.com/en-us/news-polls/npr-covid-19-strategy-and-immigra....
-
- Patino M. Coronavirus Data in the U.S. Is Terrible, and Here’s Why. [(accessed on 4 August 2020)]; Available online: https://www.bloomberg.com/news/articles/2020-05-01/why-coronavirus-repor....
LinkOut - more resources
Full Text Sources
