. 2020 Sep 14;8(9):350.
doi: 10.3390/biomedicines8090350.

Mitochondrial Transfer by Human Mesenchymal Stromal Cells Ameliorates Hepatocyte Lipid Load in a Mouse Model of NASH

Affiliations

Mitochondrial Transfer by Human Mesenchymal Stromal Cells Ameliorates Hepatocyte Lipid Load in a Mouse Model of NASH

Mei-Ju Hsu et al. Biomedicines. .

Abstract

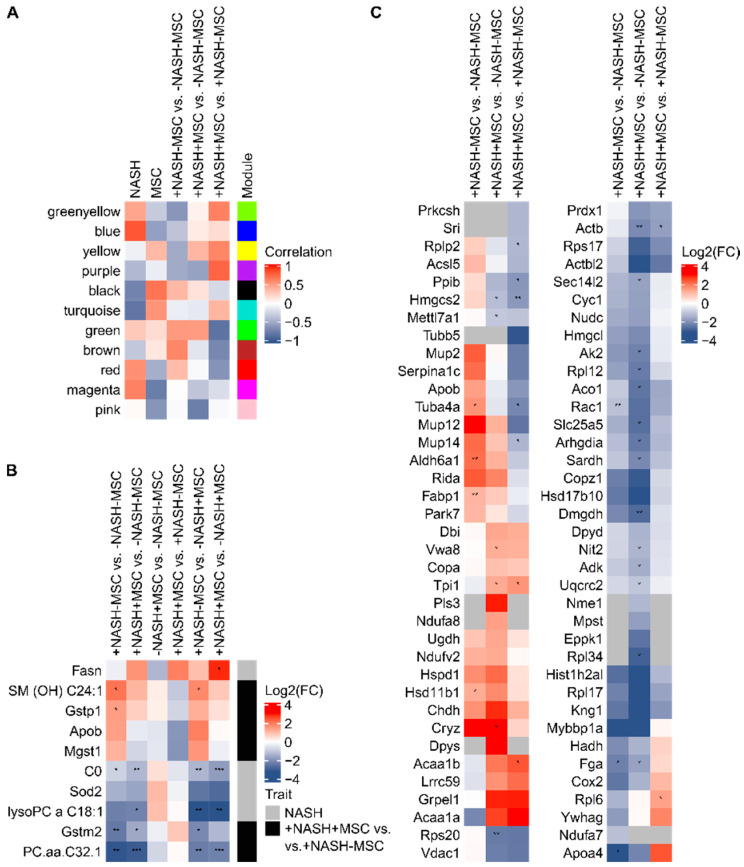
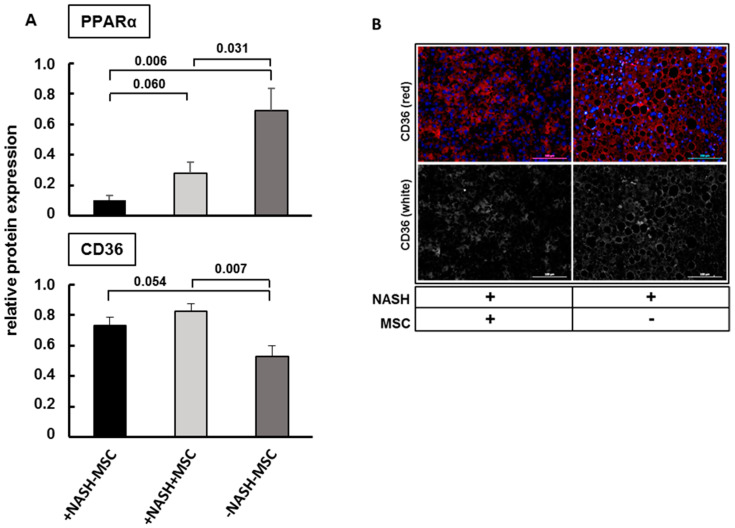
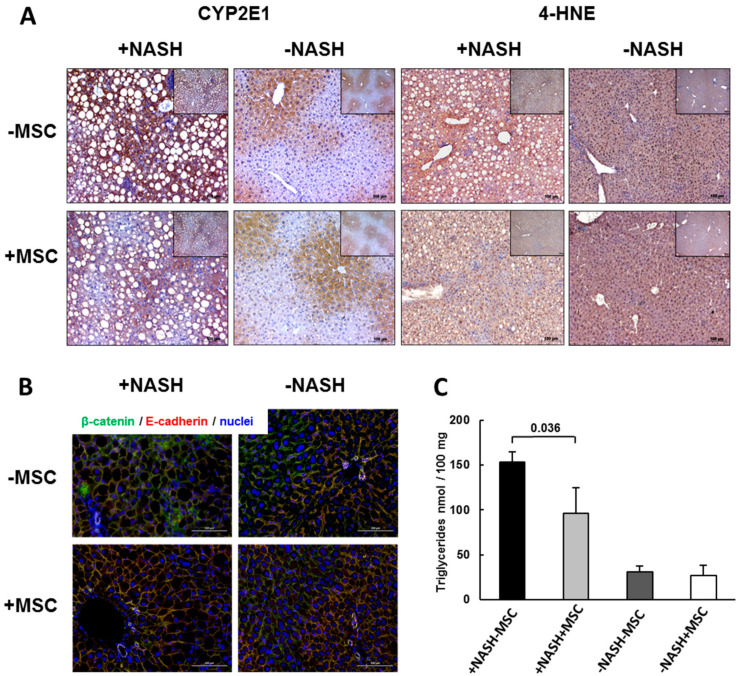
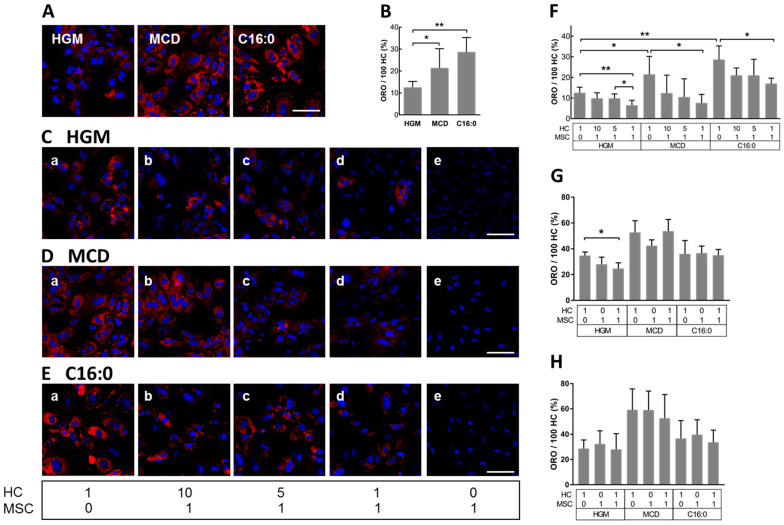
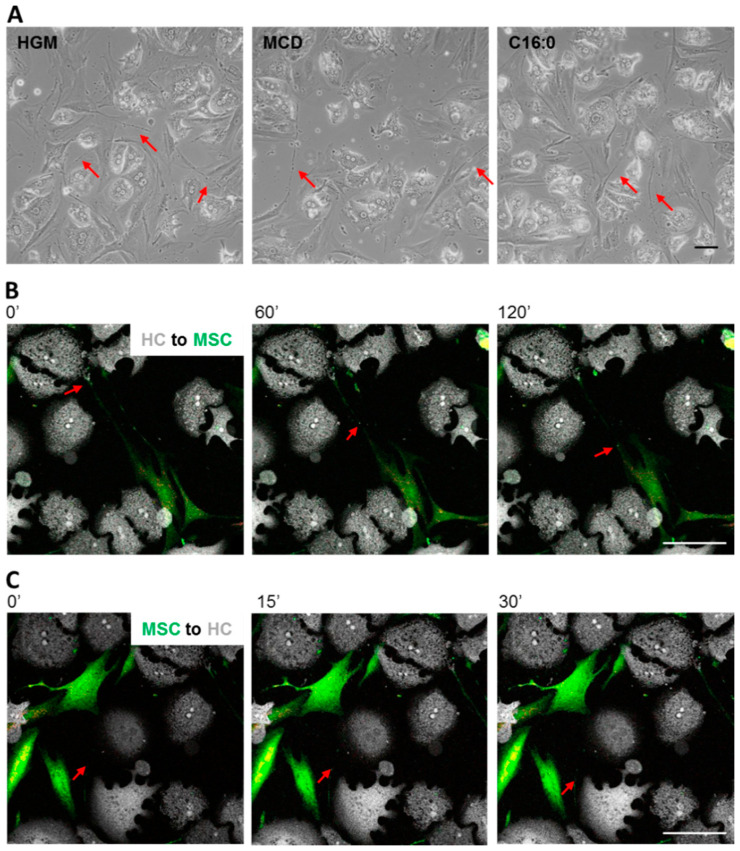
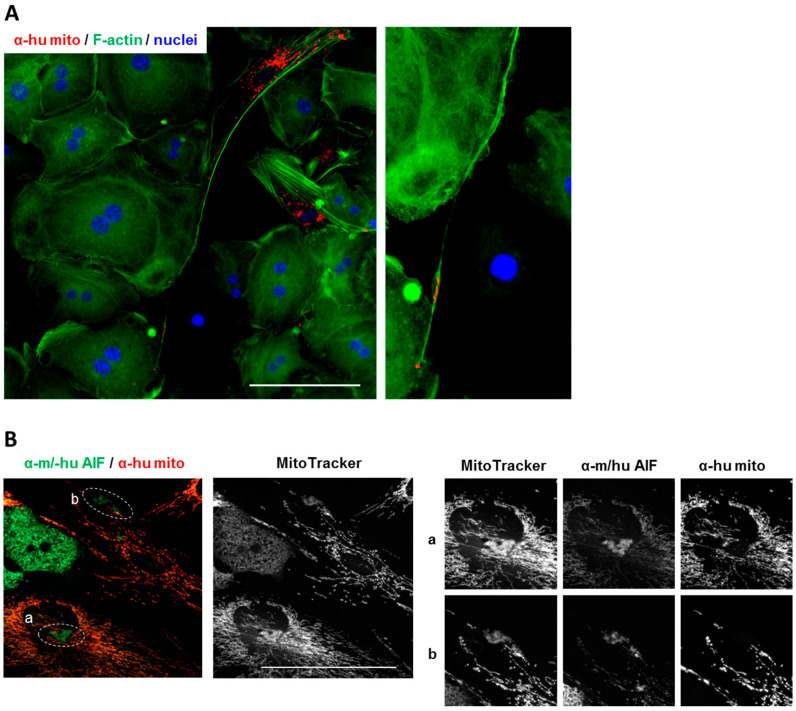
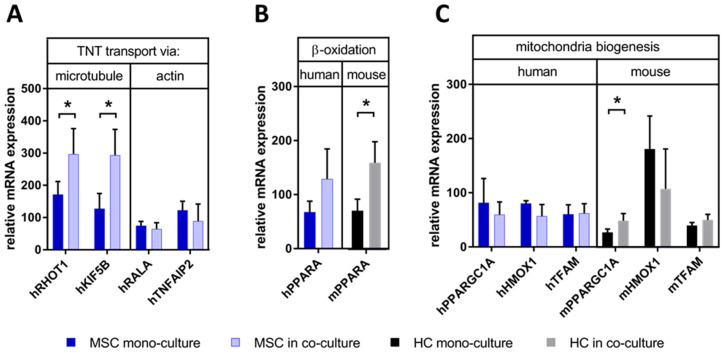
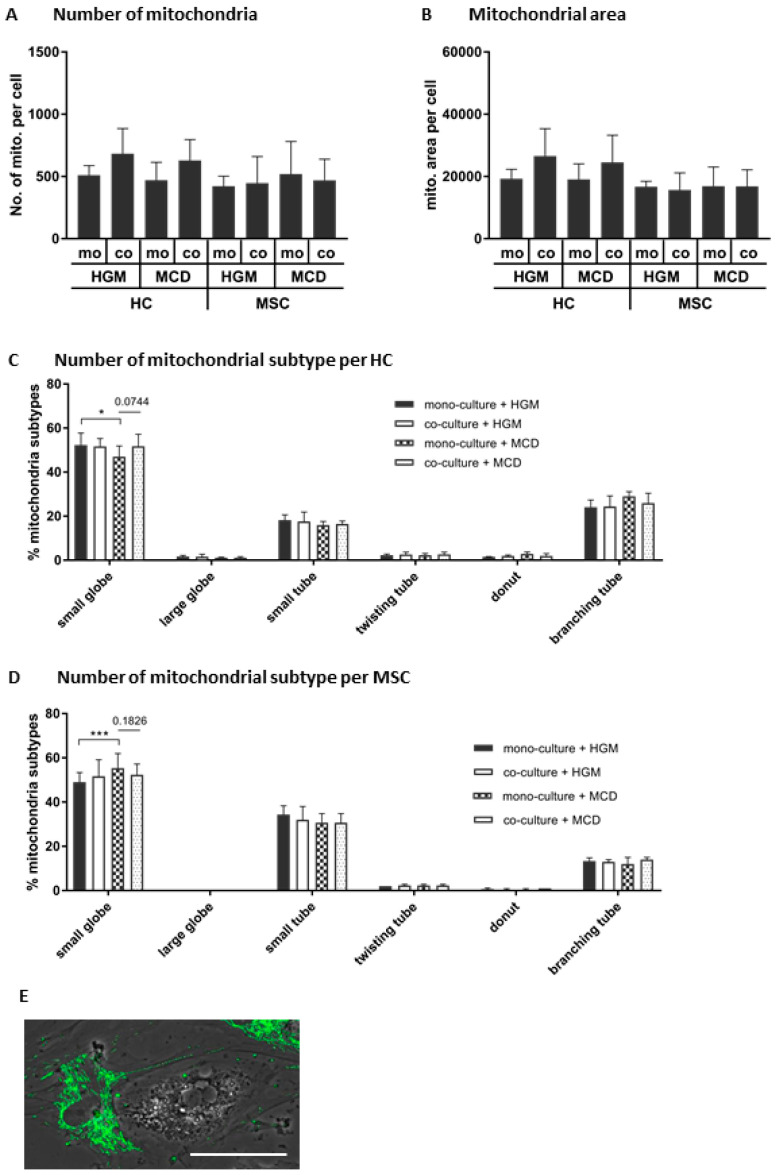
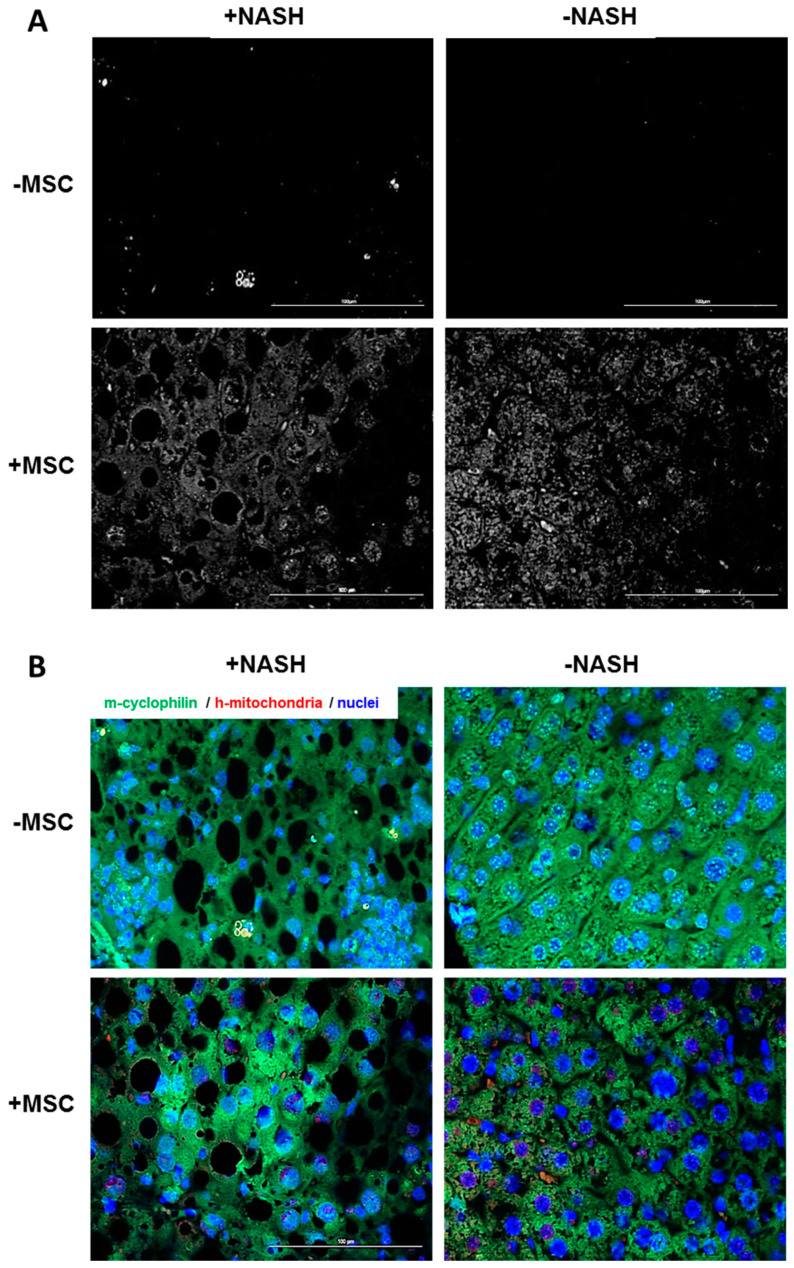
Mesenchymal stromal cell (MSC) transplantation ameliorated hepatic lipid load; tissue inflammation; and fibrosis in rodent animal models of non-alcoholic steatohepatitis (NASH) by as yet largely unknown mechanism(s). In a mouse model of NASH; we transplanted bone marrow-derived MSCs into the livers; which were analyzed one week thereafter. Combined metabolomic and proteomic data were applied to weighted gene correlation network analysis (WGCNA) and subsequent identification of key drivers. Livers were analyzed histologically and biochemically. The mechanisms of MSC action on hepatocyte lipid accumulation were studied in co-cultures of hepatocytes and MSCs by quantitative image analysis and immunocytochemistry. WGCNA and key driver analysis revealed that NASH caused the impairment of central carbon; amino acid; and lipid metabolism associated with mitochondrial and peroxisomal dysfunction; which was reversed by MSC treatment. MSC improved hepatic lipid metabolism and tissue homeostasis. In co-cultures of hepatocytes and MSCs; the decrease of lipid load was associated with the transfer of mitochondria from the MSCs to the hepatocytes via tunneling nanotubes (TNTs). Hence; MSCs may ameliorate lipid load and tissue perturbance by the donation of mitochondria to the hepatocytes. Thereby; they may provide oxidative capacity for lipid breakdown and thus promote recovery from NASH-induced metabolic impairment and tissue injury.

Keywords: mesenchymal stromal cells; non-alcoholic steatohepatitis (NASH); organelle transfer; primary hepatocytes; tunneling nanotubes (TNTs).


Conflict of interest statement

The authors declare no conflict of interest. The funders had no role in the design of the study; in the collection, analyses, or interpretation of data; in the writing of the manuscript, or in the decision to publish the results.

Figures

Figure 1
Figure 1
Integrative analysis of proteome and metabolome. (A) Correlations of WGCNA-created modules with relevant traits. Based on this, key drivers for the traits NASH and +NASH+MSC vs. +NASH-MSC were identified; (B) Log2(FCs) and p-values for selected key drivers; (C) Log2(FCs) and p-values are presented for selected candidates, which showed differences, albeit not significant throughout, between +NASH-MSC and +NASH+MSC. Significances are indicated with asterisks (p-value ≤ 0.05: *, p-value ≤ 0.01: **, p-value ≤ 0.001: ***). Euclidean clustering was applied to all heatmaps shown.
Figure 2
Figure 2
Expression of CD36 and PPARα in MCD-treated mice with and without MSC application. (A) Upregulation of CD36 expression and downregulation of PPARα in NASH livers and partial reversal by MSCs as shown by semiquantitative Western blot analysis of liver cytosolic extracts from 6 different animals in each group. Vinculin was used for normalization. Values represent means ± SEM and significant differences as indicated by the p-values over the horizontal lines were identified by applying the Student’s t-test for unpaired values; (B) fluorescent immunohistochemical detection of CD36 in representative liver slices of +NASH-MSC livers and after treatment with MSC (+NASH+MSC). Scale bar 100 µm.
Figure 3
Figure 3
Liver tissue deterioration in MCD-treated mice and reversal by MSCs. (A) Immunohistochemical detection of Cyp2e1 and 4-HNE reveals an increase in perivenous localization in NASH livers, and restoration of zonation to nearly normal by MSC treatment. Pictures are representative for 3 different animals out of each group. White “holes” represent lipid droplets in NASH livers (original magnification 10×). The insets show lower magnifications for an overview impression (original magnification 5×). (B) Fluorescent immunohistochemical detection of adherens junction proteins β-catenin (green fluorescence) and E-cadherin (red, yellow in the overlay) indicates periportal zonation of E-cadherin, which is lost in NASH livers and restored by treatment with MSCs. Pictures are representative for 3 different animals out of each group. Scale bar 100 µm. (C) Hepatic triglycerides in control (-NASH) and in MCD diet-fed (+NASH) mice either treated without (-MSC) or with (+MSC) human bone marrow-derived MSCs. Values are means ± SD from 5 animals in each group. The horizontal line indicates the significant difference between the +NASH-MSC and the +NASH+MSC group at p = 0.036. In addition to Johnson transformation, an ANOVA was performed p = 0.0001, post-hoc Dunett T p = 0.024.
Figure 4
Figure 4
Induction of lipid droplet formation in cultured hepatocytes (HCs) by steatosis-inducing medium and reversal by MSCs in co-culture. Primary HCs were either cultured in HGM medium or treated with steatosis-inducing MCD medium or HGM supplemented with 0.5 mM palmitic acid (C16:0) for 3 days. (A) Visualization of hepatocyte lipids with Oil red O (red) and (B) quantification. HCs cultured (a) alone or together with MSCs at ratios of HCs to MSCs of (b) 10:1, (c) 5:1, (d) 1:1, or (e) 0:1 were grown for 3 days either in (C) HGM, or in (D) MCD, or in (E) HGM supplemented with C16:0. (C–E) lipid stain and (F) quantification. Nuclei were counterstained with DAPI (blue). Conditioned media were collected from either HC (1:0) or MSC (0:1) mono-cultures, or co-culture (ratio 1:1) and transferred to HCs grown for an additional (G) 1 or (H) 2 days in either HGM, MCD medium, or HGM supplemented with C16:0. The lipid stain with Oil red O was quantified by image analysis and the results from 3 independent cell cultures were normalized as the percentage amount of stain/100 hepatocytes and expressed as mean ± SD. Statistical comparisons were made using unpaired t-tests, and differences between groups were considered significant if the p-value was ≤0.05. *: p ≤ 0.05; **: p ≤ 0.01. Scale bar 100 μm. MSCs: human bone marrow-derived mesenchymal stromal cells; HCs: mouse primary hepatocytes; HGM: hepatocyte growth medium; MCD: methionine-choline-deficient medium.
Figure 5
Figure 5
TNT-mediated cargo exchange between HCs and MSCs. (A) On day 1 of co-culture, the TNT structures (red arrows) derived from MSCs were readily detectable by phase contrast microscopy in cultures grown under all tested conditions. Scale bar 100 µm. Corresponding movies may be opened in Supplementary Material file 3; (B) The delivery of cargos from HCs to MSCs and (C) from MSCs to HCs was monitored by co-culture of HCs and MSCs pre-labeled with CellTrace™ Yellow and MitoTracker™ Deep Red FM (pseudo-colored green and red, respectively). The whole culture was stained with CellTrace™ CFSE (pseudo-colored white) and the pictures were captured using time-lapse confocal imaging. When the first picture was taken, this time point was designated as time 0, to which the other time points refer. The direction of movement of cargos in the TNTs is indicated by the red arrows. Scale bar 100 µm. Higher magnification images are available in Supplementary Material file 2, Figure S6A–C. Corresponding movies may be opened in Supplementary Material file 4.
Figure 6
Figure 6
TNTs between HCs and MSCs are used to transport mitochondria. (A) Human MSC-derived mitochondria, stained in red with the anti-human-specific antibody against human mitochondria, are delivered to co-cultured mouse hepatocytes (mostly bi-nucleated). F-actin was stained with Phalloidin-iFluor 488 (green), nuclei with DAPI. Scale bar; 100 µm. Right panel: Computational enlargement of an area as shown on the left panel; (B) Mouse and human mitochondrial apoptosis-inducing factor (AIF) (green) and human mitochondria (red) were detected by fluorescent immunocytochemistry using species-specific antibodies, and cells were further stained with MitoTracker™ Deep Red FM (white). (a) and (b) show higher magnification pictures (computational enlargements) of circled areas shown in the panels on the left. Scale bar 100 μm.
Figure 7
Figure 7
Expression of factors involved in (A) microtubule- and actin-based tubular transport, (B) hepatocyte lipid utilization, and (C) mitochondria biogenesis. Expression levels were analyzed by RT-PCR using species-specific primer pairs (blue/light blue columns for the use of human (h) primers, black/grey columns for the use of mouse (m) primers) and mRNA levels normalized with beta-2-microglobulin. Results are expressed as mean ± SD. Statistical comparisons from 3-5 independent cell cultures were made using the 2-way ANOVA test after log transformation, and differences between groups were considered significant if the p value was ≤0.05 (*). h: human; m: mouse; RHOT: Ras Homolog Family Member T1, also known as mitochondrial Rho GTPase 1 (MIRO1); KIF5B: kinesin family member 5B; RALA: RAS like proto-oncogene A; TNFAIP2: TNFα-induced protein 2; PPARGC1A: PPARα coactivator 1α, also known as PGC1α; HMOX1: heme oxygenase-1; TFAM: mitochondrial transcription factor A; PPARA: peroxisome proliferator-activated receptor α.
Figure 8
Figure 8
Profiling of cell-type-specific mitochondria in co-cultures of mouse hepatocytes and human MSCs. On day 1 of co-culture, fluorescence images of cells stained with MitoTracker Red CMXRos were analyzed for the (A) number and (B) area of mitochondria and percentages of mitochondria subtypes (C) in HCs and (D) in MSCs using the software MicroP. The statistical comparisons from 4 independent cell cultures were made using the 2-way ANOVA test. Results are expressed as mean ± SD. Statistical comparisons were made using unpaired t-tests, and differences between groups were considered significant for the p-values *: p ≤ 0.05; ***: p ≤ 0.001. (E) The globular morphology of MSC mitochondria was confirmed (cf. also Supplementary Material file 2, Figure S7) in MSCs co-cultured with HCs in HGM or MCD medium. The mitochondria were stained (pseudo-colored in green) and the picture was merged with the light microscopy image. Scale bar 50 µm. mo: mono-culture; co: co-culture.
Figure 9
Figure 9
Human MSC-derived mitochondria in mouse hepatocytes of animals receiving MSC transplants. Here, 2-µm slices of mouse livers either fed the control (-NASH) or the MCD diet (+NASH) and treated without (-MSC) or with (+MSC) human bone marrow-derived MSC were co-stained with the anti-mouse cyclophilin or the anti-human mitochondria antibody and images captured using the Zeiss Axio Observer.Z1 microscope equipped with ApoTome.2 with a 40× objective. (A) Black and white images of pictures shown in (B) indicate human mitochondria (lower panels) in livers, which were transplanted with human MSCs. Non-transplanted livers (upper panels) were void of signals; (B) Immuno-fluorescent co-stain of mouse cyclophilin (green channel), and human mitochondria (red channel) indicating human mitochondria in mouse hepatocytes; nuclei were stained with DAPI (blue).

References

    1. Younossi Z., Anstee Q.M., Marietti M., Hardy T., Henry L., Eslam M., George J., Bugianesi E. Global burden of nafld and nash: Trends, predictions, risk factors and prevention. Nat. Rev. Gastroenterol. Hepatol. 2018;15:11–20. doi: 10.1038/nrgastro.2017.109. - DOI - PubMed
    1. Tilg H., Moschen A.R. Mechanisms behind the link between obesity and gastrointestinal cancers. Best Pract. Res. Clin. Gastroenterol. 2014;28:599–610. doi: 10.1016/j.bpg.2014.07.006. - DOI - PubMed
    1. Calle E.E., Rodriguez C., Walker-Thurmond K., Thun M.J. Overweight, obesity, and mortality from cancer in a prospectively studied cohort of U.S. Adults. N. Engl. J. Med. 2003;348:1625–1638. doi: 10.1056/NEJMoa021423. - DOI - PubMed
    1. Singh R., Kaushik S., Wang Y., Xiang Y., Novak I., Komatsu M., Tanaka K., Cuervo A.M., Czaja M.J. Autophagy regulates lipid metabolism. Nature. 2009;458:1131–1135. doi: 10.1038/nature07976. - DOI - PMC - PubMed
    1. Park H.W., Park H., Semple I.A., Jang I., Ro S.H., Kim M., Cazares V.A., Stuenkel E.L., Kim J.J., Kim J.S., et al. Pharmacological correction of obesity-induced autophagy arrest using calcium channel blockers. Nat. Commun. 2014;5:4834. doi: 10.1038/ncomms5834. - DOI - PMC - PubMed

LinkOut - more resources