. 2020 Sep 17;127(11):1404-1418.
doi: 10.1161/CIRCRESAHA.120.317703. Online ahead of print.

Platelets Can Associate with SARS-Cov-2 RNA and Are Hyperactivated in COVID-19

Affiliations

Platelets Can Associate with SARS-Cov-2 RNA and Are Hyperactivated in COVID-19

Younes Zaid et al. Circ Res. .

Abstract

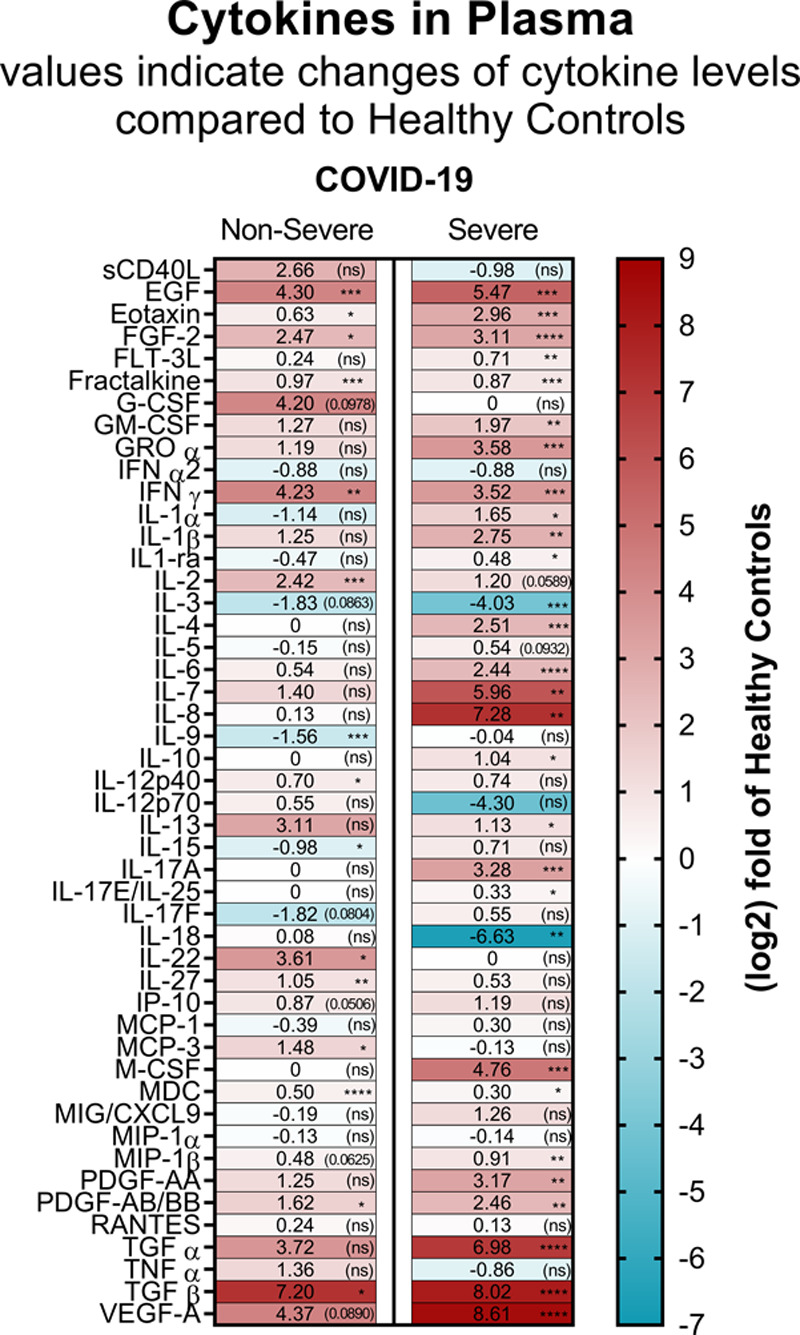
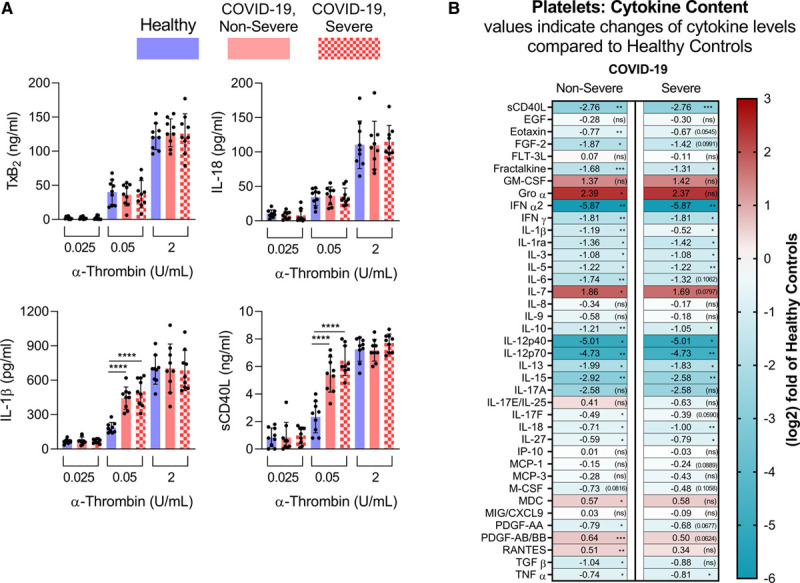
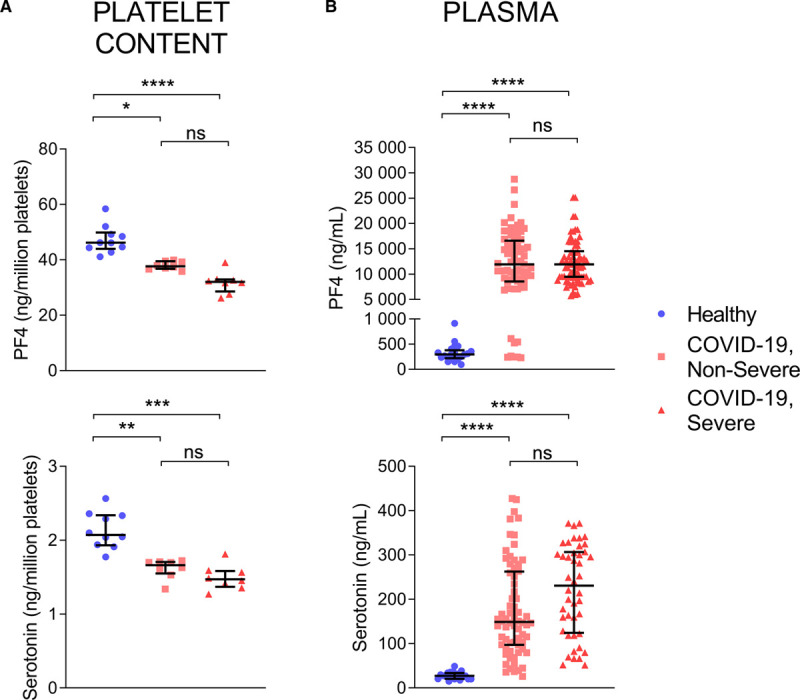
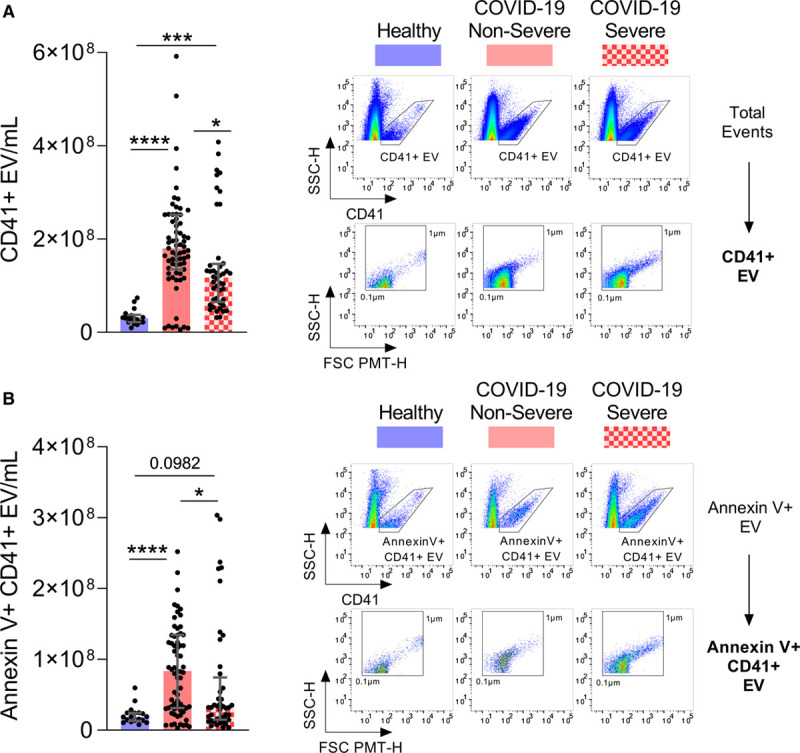
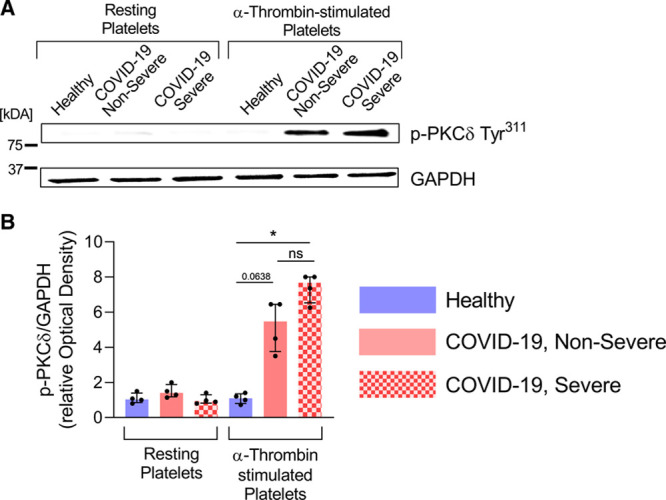
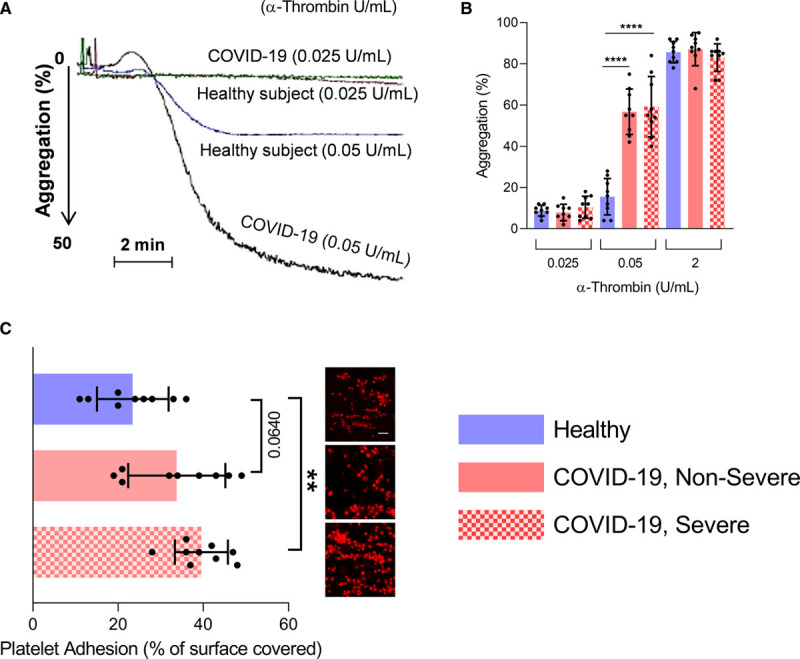
Rationale: In addition to the overwhelming lung inflammation that prevails in COVID-19, hypercoagulation and thrombosis contribute to the lethality of subjects infected with severe acute respiratory syndrome coronavirus 2 (SARS-CoV-2). Platelets are chiefly implicated in thrombosis. Moreover, they can interact with viruses and are an important source of inflammatory mediators. While a lower platelet count is associated with severity and mortality, little is known about platelet function during COVID-19. Objective: To evaluate the contribution of platelets to inflammation and thrombosis in COVID-19 patients. Methods and Results: Blood was collected from 115 consecutive COVID-19 patients presenting non-severe (n=71) and severe (n=44) respiratory symptoms. We document the presence of SARS-CoV-2 RNA associated with platelets of COVID-19 patients. Exhaustive assessment of cytokines in plasma and in platelets revealed the modulation of platelet-associated cytokine levels in both non-severe and severe COVID-19 patients, pointing to a direct contribution of platelets to the plasmatic cytokine load. Moreover, we demonstrate that platelets release their alpha- and dense-granule contents in both non-severe and severe forms of COVID-19. In comparison to concentrations measured in healthy volunteers, phosphatidylserine-exposing platelet extracellular vesicles were increased in non-severe, but not in severe cases of COVID-19. Levels of D-dimers, a marker of thrombosis, failed to correlate with any measured indicators of platelet activation. Functionally, platelets were hyperactivated in COVID-19 subjects presenting non-severe and severe symptoms, with aggregation occurring at suboptimal thrombin concentrations. Furthermore, platelets adhered more efficiently onto collagen-coated surfaces under flow conditions. Conclusions: Taken together, the data suggest that platelets are at the frontline of COVID-19 pathogenesis, as they release various sets of molecules through the different stages of the disease. Platelets may thus have the potential to contribute to the overwhelming thrombo-inflammation in COVID-19, and the inhibition of pathways related to platelet activation may improve the outcomes during COVID-19.

Keywords: SARS-CoV-2.


Conflict of interest statement

None.

Figures

Figure 1.
Figure 1.
Cytokine and chemokine levels in plasma from patients with coronavirus disease 2019 (COVID-19). Heat map visualization of 48 cytokine/chemokine expression profiles in plasma of patients with COVID-19 nonsevere (median of n=10) and severe (median of n=9) relatively to the healthy controls (median of n=10). Cytokine/chemokine expression is represented as a (log2) fold change relative to healthy controls. The numbers in each part represent the change and statistical significance (in brackets), and the color codes refer to red for increased expression and blue for decreased expression. Absolute cytokine/chemokine values (pg/mL) and details on the statistical analysis are shown in Figure VII in the Data Supplement. *P<0.05, **P<0.01, ***P<0.001, ****P<0.0001.
Figure 2.
Figure 2.
Platelets are prone to produce and release inflammatory molecules in patients with coronavirus disease 2019 (COVID-19). A, Platelets from healthy controls (n=9), COVID-19 nonsevere (n=9), and COVID-19 severe (n=9) patients were stimulated for 5 min at room-temperature with 0.025, 0.05, or 2 U/mL of α-thrombin. Thromboxane B2 (TxB2), IL (interleukin)-18, IL-1β, and soluble CD40 ligand (sCD40L) production was evaluated. Data are represented as mean±SD. Statistical analysis: Data were normally distributed (Shapiro-Wilk test). One-way ANOVA with subsequent Sidak multiple comparisons test. ***P<0.001 and ****P<0.0001. B, Heat map visualization of 39 cytokine/chemokine expression profiles in plasma of patients with COVID-19 nonsevere (median of n=10) and severe (median of n=9) relatively to the heathy controls (median of n=10). Cytokine/chemokine expression is represented as a (log2) fold change relative to healthy controls. The numbers in each part represent the change and statistical significance (in brackets) and the color codes refer to red for increased expression and blue for decreased expression. Absolute cytokine/chemokine values (pg/mL) and details on the statistical analysis are shown in Figure VII in the Data Supplement. *P<0.05, **P<0.01, ***P<0.001, ****P<0.0001.
Figure 3.
Figure 3.
Platelets are degranulated in patients with coronavirus disease 2019 (COVID-19). Markers of platelet degranulation (PF4 [platelet factor 4] for alpha granules and serotonin for dense granules) were evaluated in plasma of patients with COVID-19. Concentrations of PF4 (upper) and serotonin (lower) were measured in platelets (A) and plasma (B) from healthy controls, patients with COVID-19 nonsevere and COVID-19 severe. For platelet content, values were expressed as ng per million platelets. Data are represented as median with interquartile range (IQR). Statistical analysis: ROUT method identified three outliers for PF4 and serotonin (platelet content), which were thus excluded from the analysis. Data were not normally distributed (Shapiro-Wilk test). Kruskal-Wallis test with subsequent Dunn multiple comparisons test. **P<0.01, ***P<0.001 ****P<0.0001, ns (nonsignificant). PF4: healthy controls (n=18 for plasma, n=10 for platelet content), COVID-19 nonsevere (n=71 for plasma, n=10 for platelet content), COVID-19 severe (plasma n=44, platelet content n=9). Serotonin: healthy controls (n=10 for plasma, n=10 for platelet content), COVID-19 nonsevere (n=18 for plasma, n=9 for platelet content), COVID-19 severe (plasma n=14, platelet content n=8).
Figure 4.
Figure 4.
Platelet extracellular vesicles are released in patients with coronavirus disease 2019 (COVID-19). Circulating platelet extracellular vesicles (CD41+ extracellular vesicle [EV]) expressing phosphatidylserine or not were analyzed in plasma from healthy controls (n=18), patients with nonsevere (n=71) and severe COVID-19 (n=44). A, Total CD41+ EV were quantified (left) and representative scatter plots of CD41+ EV relative size and inner complexity are illustrated (right). B, Annexin V+ CD41+ EV were quantified (left) and representative scatter plots of AnV+CD41+ EV relative size are illustrated (right). The gating strategy is illustrated in Figure VIII in the Data Supplement. Samples with EV-concentrations close to the median of the whole population for each group were selected for representation. Data are represented as median with interquartile range (IQR). Statistical analysis: Data were not normally distributed (Shapiro-Wilk test). Kruskal-Wallis test with subsequent Dunn multiple comparisons test. FSC indicates forward scatter; and SSC, sideward scatter. *P<0.05, **P<0.01, ***P<0.001, and ****P<0.0001.
Figure 5.
Figure 5.
PKCδ (protein kinase C) phosphorylation is increased in platelets of patients with coronavirus disease 2019 (COVID-19). PKCδ phosphorylation on Tyr311 residue is increased in response to α-thrombin in patients with severe and nonsevere COVID-19. Platelets were stimulated (or not) with 0.05 U/mL of α-thrombin for 5 min at room temperature. Platelet lysates were analyzed by SDS-PAGE for P-PKCδ Tyr311. GAPDH was evaluated in each condition. A, Immunoblot representative of 4 donors. B, Densitometric analysis of P-PKCδ Tyr311 normalized to GAPDH was performed, data were expressed as relative Optical Density (n=4). Data are represented as median with interquartile range (IQR). Statistical analysis: Kruskal-Wallis test with subsequent Dunn multiple comparisons test. *P<0.05.
Figure 6.
Figure 6.
Platelets are prone to aggregation in patients with coronavirus disease 2019 (COVID-19). Platelet aggregation and adhesion were evaluated in healthy donors, patients with nonsevere and severe COVID-19 (n=9). A and B, Platelets were stimulated with 0.025, 0.05, or 2 U/mL α-thrombin. A, Representation of light transmission curve of platelets aggregation from healthy controls and patients with COVID-19. B, Quantification (%) of maximal platelet aggregation in healthy controls (n=9), patients with COVID-19 nonsevere (n=9) or COVID-19 severe (n=9). C, Platelet adhesion on collagen was evaluated under flow condition after 5 min. Data are presented as percentage of surface covered by platelets. A representative image for each condition is illustrated (Scale bar=50 µm). Data points close to the mean of each population for each group were selected for representative images. Data are represented as mean±SD. Statistical analysis: Data were normally distributed (Shapiro-Wilk test). One-way ANOVA with subsequent Sidak multiple comparisons test. **P<0.001, ****P<0.0001

Comment in

References

    1. Tay MZ, Poh CM, Rénia L, MacAry PA, Ng LFP. The trinity of COVID-19: immunity, inflammation and intervention. Nat Rev Immunol. 2020;20:363–374. doi: 10.1038/s41577-020-0311-8 - PMC - PubMed
    1. Guan WJ, Ni ZY, Hu Y, Liang WH, Ou CQ, He JX, Liu L, Shan H, Lei CL, Hui DSC, et al. ; China Medical Treatment Expert Group for Covid-19. Clinical characteristics of coronavirus disease 2019 in China. N Engl J Med. 2020;382:1708–1720. doi: 10.1056/NEJMoa2002032 - PMC - PubMed
    1. World Health Organization. WHO Coronavirus Disease (COVID-19) Dashboard. 2020https://covid19.who.int CdC-WhOpoM. Accessed September 14, 2020
    1. Fehr AR, Perlman S. Coronaviruses: an overview of their replication and pathogenesis. Methods Mol Biol. 2015;1282:1–23. doi: 10.1007/978-1-4939-2438-7_1 - PMC - PubMed
    1. Coronaviridae Study Group of the International Committee on Taxonomy of Viruses. The species severe acute respiratory syndrome-related coronavirus: classifying 2019-nCoV and naming it SARS-CoV-2. Nat Microbiol. 2020;5:536–544. doi: 10.1038/s41564-020-0695-z - PMC - PubMed