

Estimate of the sequenced proportion of the global prokaryotic genome
- PMID: 32938501
- PMCID: PMC7496214
- DOI: 10.1186/s40168-020-00903-z
Estimate of the sequenced proportion of the global prokaryotic genome
Abstract
Background: Sequencing prokaryotic genomes has revolutionized our understanding of the many roles played by microorganisms. However, the cell and taxon proportions of genome-sequenced bacteria or archaea on earth remain unknown. This study aimed to explore this basic question using large-scale alignment between the sequences released by the Earth Microbiome Project and 155,810 prokaryotic genomes from public databases.
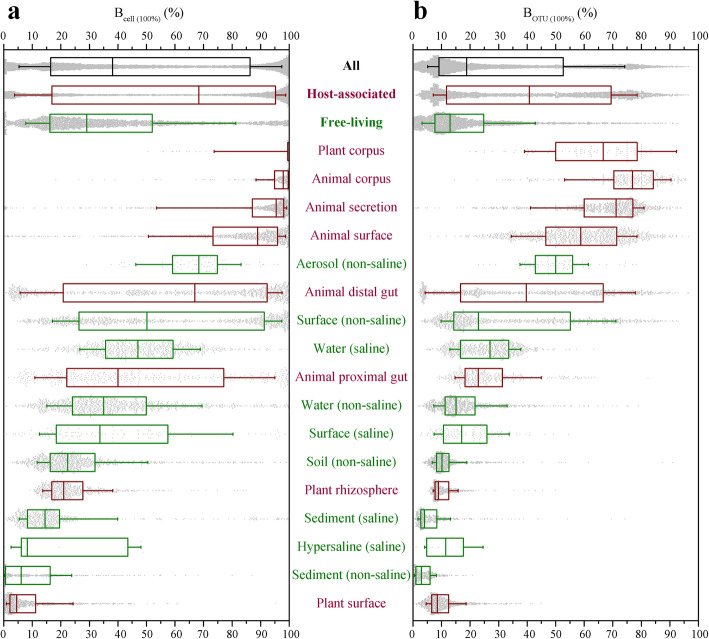
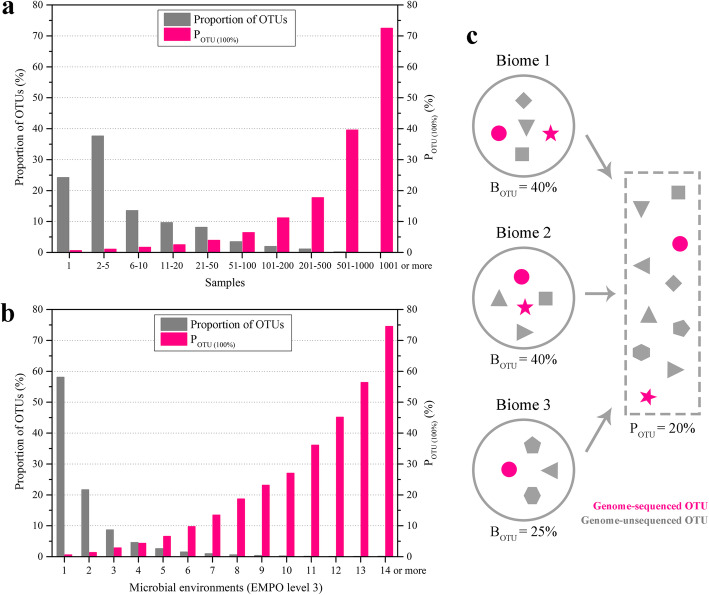
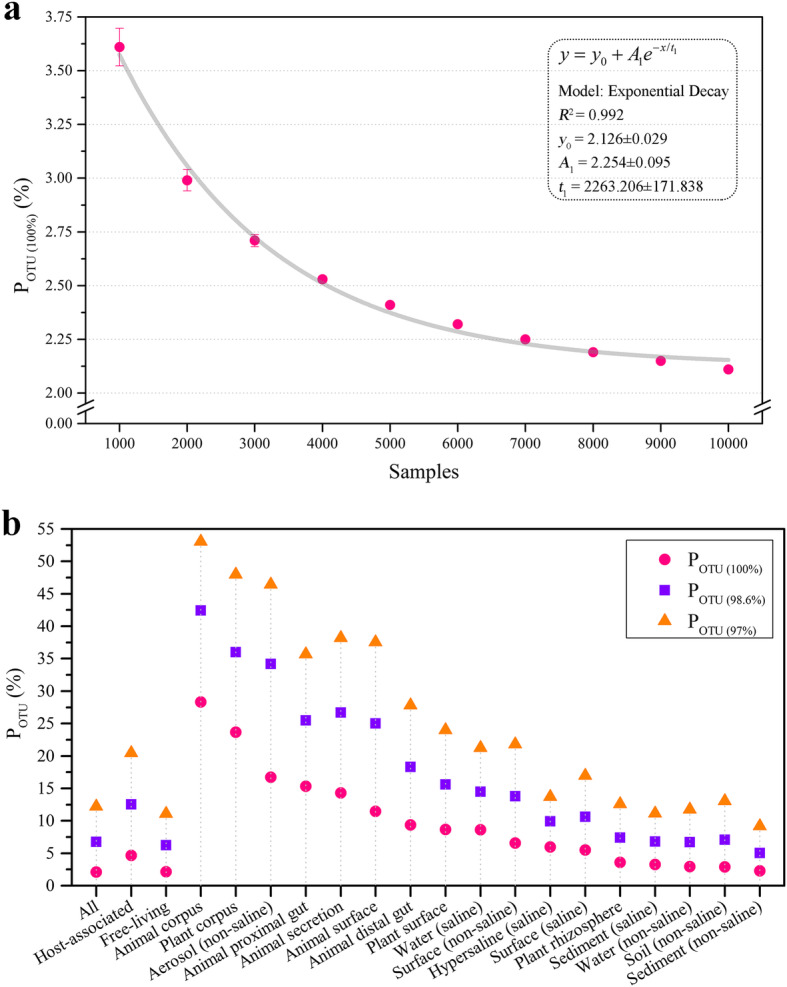
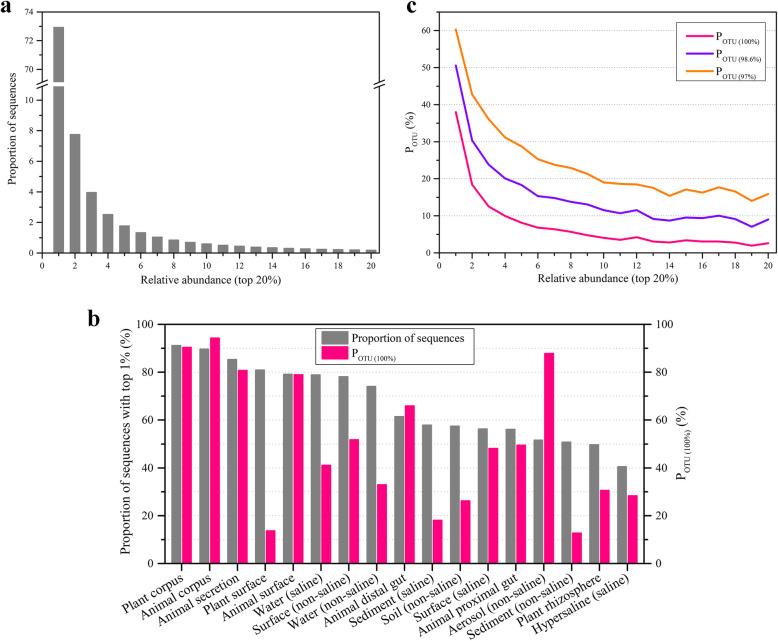
Results: Our results showed that the median proportions of the genome-sequenced cells and taxa (at 100% identities in the 16S-V4 region) in different biomes reached 38.1% (16.4-86.3%) and 18.8% (9.1-52.6%), respectively. The sequenced proportions of the prokaryotic genomes in biomes were significantly negatively correlated with the alpha diversity indices, and the proportions sequenced in host-associated biomes were significantly higher than those in free-living biomes. Due to a set of cosmopolitan OTUs that are found in multiple samples and preferentially sequenced, only 2.1% of the global prokaryotic taxa are represented by sequenced genomes. Most of the biomes were occupied by a few predominant taxa with a high relative abundance and much higher genome-sequenced proportions than numerous rare taxa.
Conclusions: These results reveal the current situation of prokaryotic genome sequencing for earth biomes, provide a more reasonable and efficient exploration of prokaryotic genomes, and promote our understanding of microbial ecological functions. Video Abstract.
Keywords: Earth microbiome project; Genome sequencing; Microbiome; Predominant taxa; Prokaryotic biome.
Conflict of interest statement
The authors declare no competing interests.
Figures
Similar articles
-
A census-based estimate of Earth's bacterial and archaeal diversity.PLoS Biol. 2019 Feb 4;17(2):e3000106. doi: 10.1371/journal.pbio.3000106. eCollection 2019 Feb. PLoS Biol. 2019. PMID: 30716065 Free PMC article.
-
Correcting for 16S rRNA gene copy numbers in microbiome surveys remains an unsolved problem.Microbiome. 2018 Feb 26;6(1):41. doi: 10.1186/s40168-018-0420-9. Microbiome. 2018. PMID: 29482646 Free PMC article.
-
The microbial dark matter and "wanted list" in worldwide wastewater treatment plants.Microbiome. 2023 Mar 28;11(1):59. doi: 10.1186/s40168-023-01503-3. Microbiome. 2023. PMID: 36973807 Free PMC article.
-
En route to a genome-based classification of Archaea and Bacteria?Syst Appl Microbiol. 2010 Jun;33(4):175-82. doi: 10.1016/j.syapm.2010.03.003. Epub 2010 Apr 20. Syst Appl Microbiol. 2010. PMID: 20409658 Review.
-
Roadmap for naming uncultivated Archaea and Bacteria.Nat Microbiol. 2020 Aug;5(8):987-994. doi: 10.1038/s41564-020-0733-x. Epub 2020 Jun 8. Nat Microbiol. 2020. PMID: 32514073 Free PMC article. Review.
Cited by
-
New Insights Into the Threshold Values of Multi-Locus Sequence Analysis, Average Nucleotide Identity and Digital DNA-DNA Hybridization in Delineating Streptomyces Species.Front Microbiol. 2022 May 31;13:910277. doi: 10.3389/fmicb.2022.910277. eCollection 2022. Front Microbiol. 2022. PMID: 35711787 Free PMC article.
-
Epigenomic Landscape of Lyme Disease Spirochetes Reveals Novel Motifs.mBio. 2021 Jun 29;12(3):e0128821. doi: 10.1128/mBio.01288-21. Epub 2021 Jun 22. mBio. 2021. PMID: 34156261 Free PMC article.
-
Metagenomics: a path to understanding the gut microbiome.Mamm Genome. 2021 Aug;32(4):282-296. doi: 10.1007/s00335-021-09889-x. Epub 2021 Jul 14. Mamm Genome. 2021. PMID: 34259891 Free PMC article. Review.
-
Global assembly of microbial communities.mSystems. 2023 Jun 29;8(3):e0128922. doi: 10.1128/msystems.01289-22. Epub 2023 May 17. mSystems. 2023. PMID: 37195192 Free PMC article.
-
A genomic analysis reveals the diversity of cellulosome displaying bacteria.Front Microbiol. 2024 Oct 30;15:1473396. doi: 10.3389/fmicb.2024.1473396. eCollection 2024. Front Microbiol. 2024. PMID: 39539715 Free PMC article.
References
-
- Fuhrman JA, Cram JA, Needham DM. Marine microbial community dynamics and their ecological interpretation. Nat Rev Microbiol. 2015;13(3):133–146. - PubMed
-
- Fierer N. Embracing the unknown: disentangling the complexities of the soil microbiome. Nat Rev Microbiol. 2017;15(10):579–590. - PubMed
-
- Loman NJ, Pallen MJ. Twenty years of bacterial genome sequencing. Nat Rev Microbiol. 2015;13(12):787–794. - PubMed
Publication types
MeSH terms
LinkOut - more resources
Full Text Sources
