. 2020 Dec;10(12):1872-1893.
doi: 10.1158/2159-8290.CD-20-0402. Epub 2020 Sep 16.

Pharmacologic Suppression of B7-H4 Glycosylation Restores Antitumor Immunity in Immune-Cold Breast Cancers

Affiliations

Pharmacologic Suppression of B7-H4 Glycosylation Restores Antitumor Immunity in Immune-Cold Breast Cancers

Xinxin Song et al. Cancer Discov. 2020 Dec.

Abstract

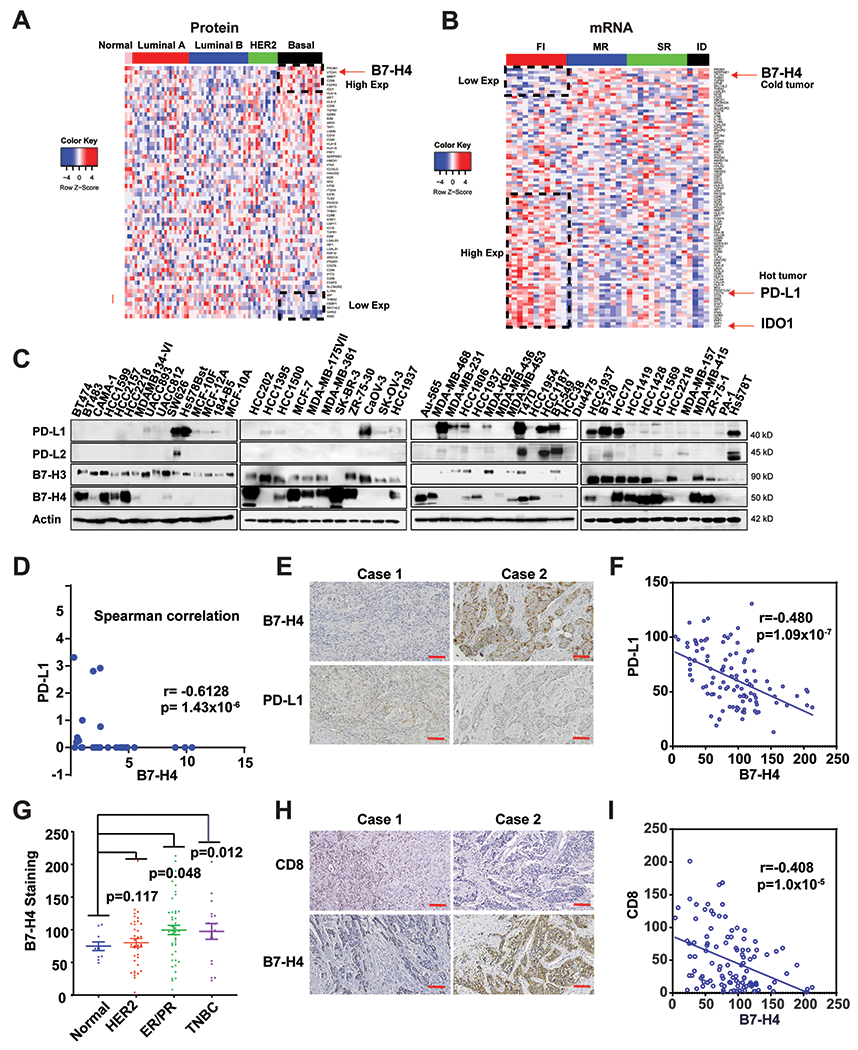
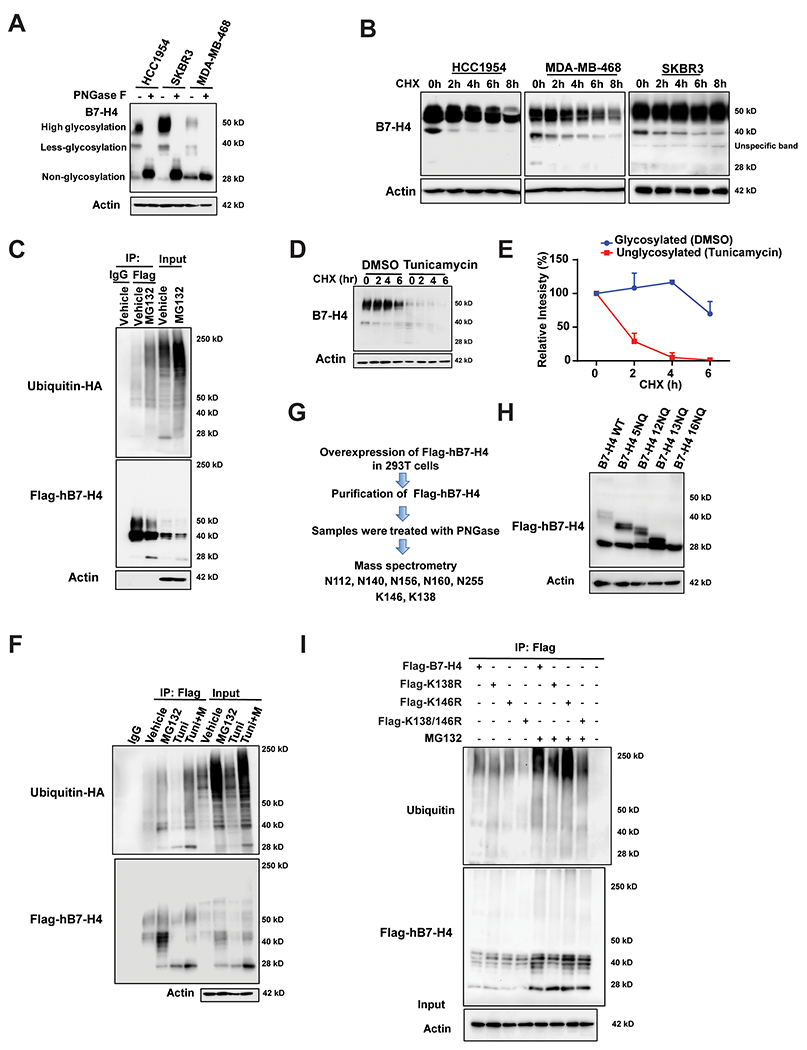
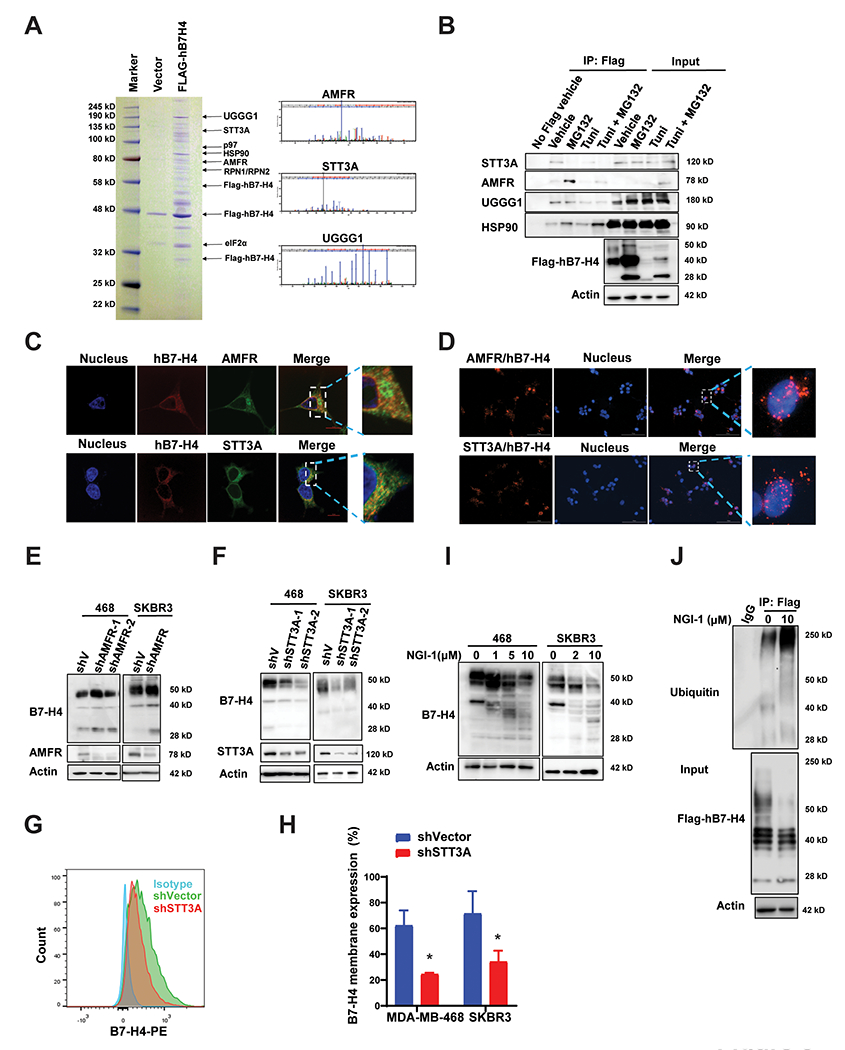
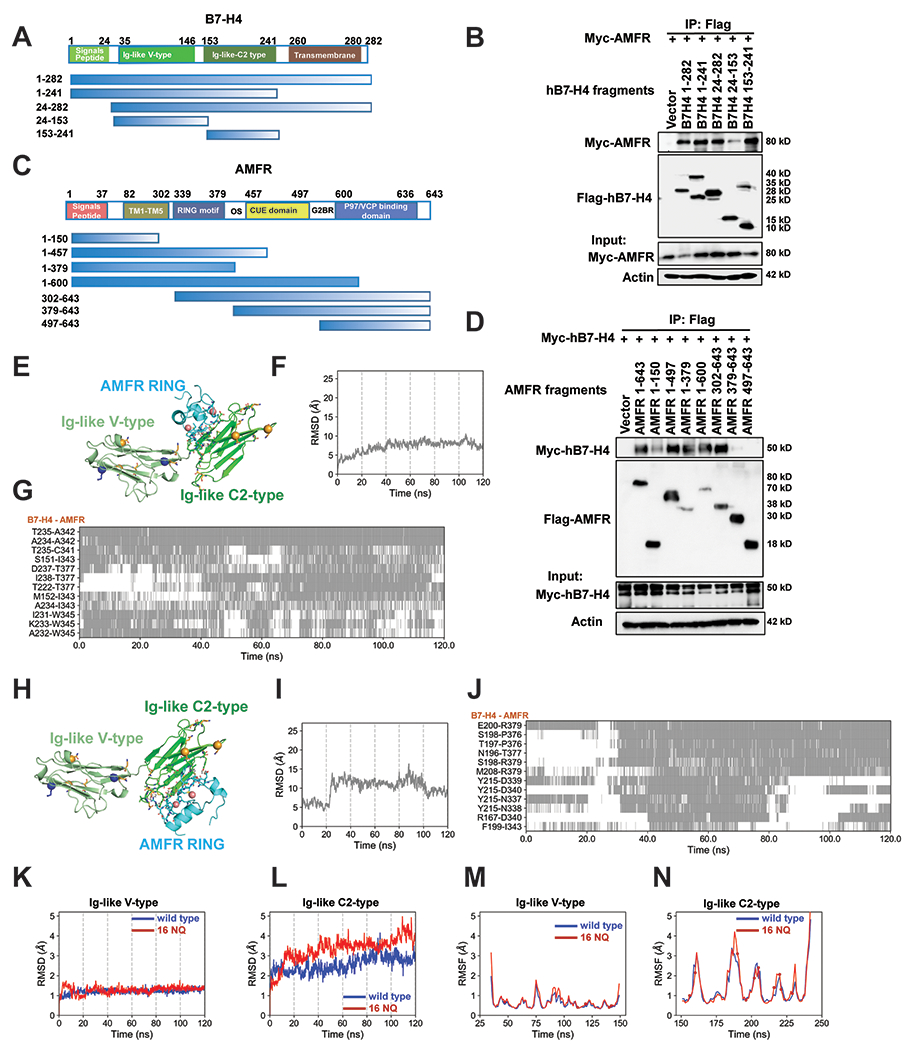
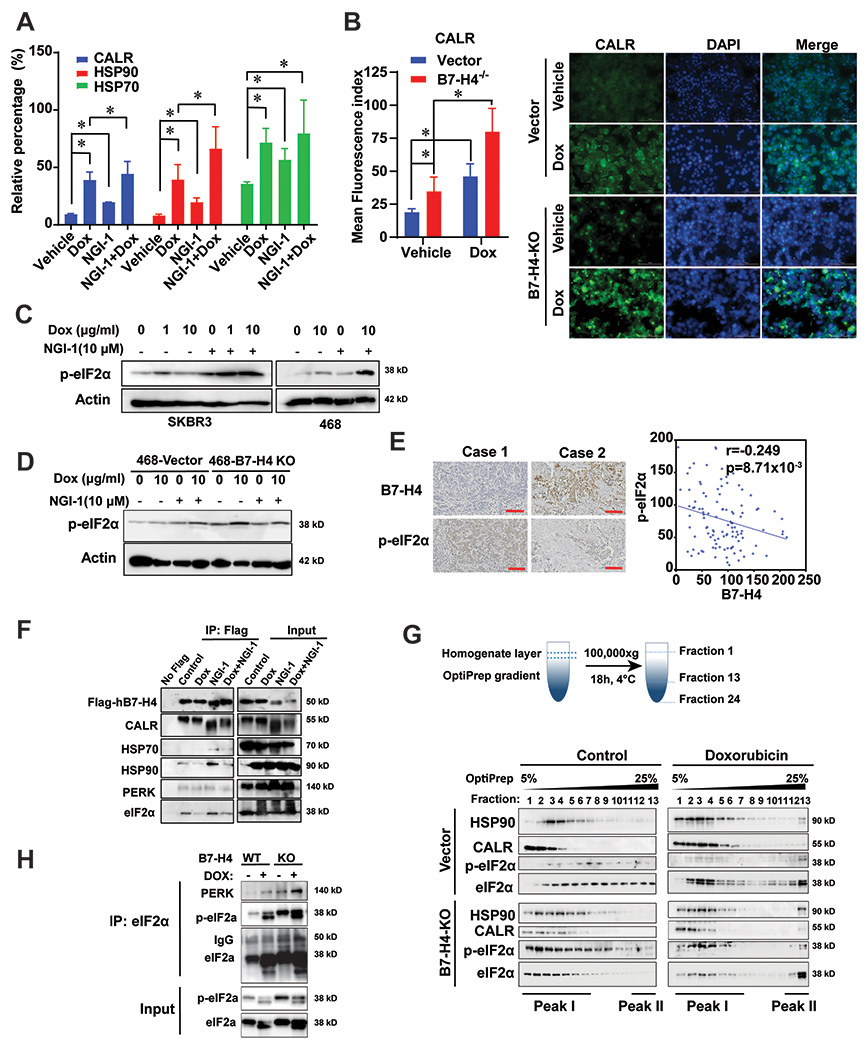
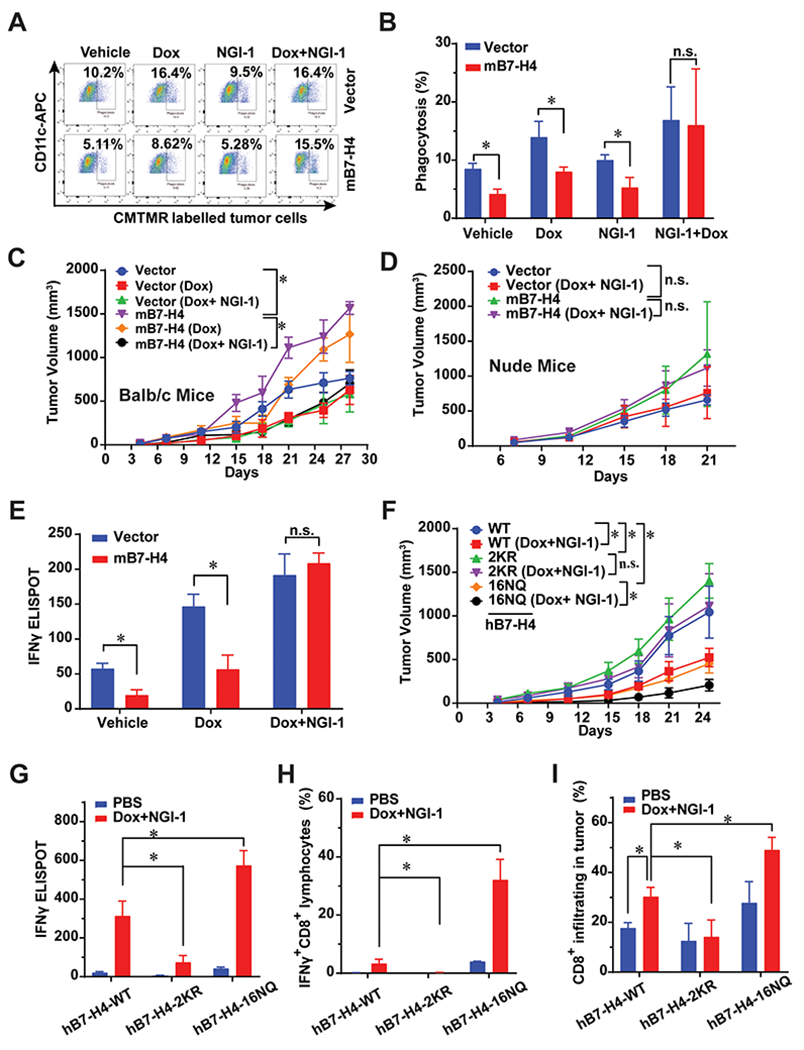
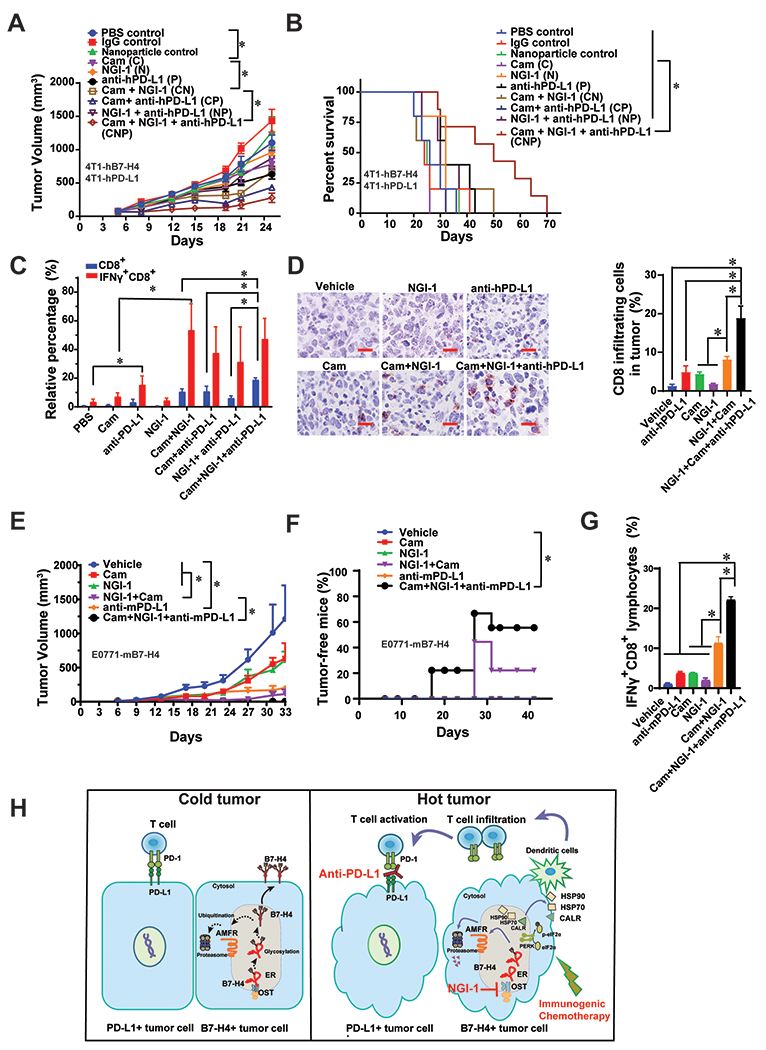
Despite widespread utilization of immunotherapy, treating immune-cold tumors has proved to be a challenge. Here, we report that expression of the immune checkpoint molecule B7-H4 is prevalent among immune-cold triple-negative breast cancers (TNBC), where its expression inversely correlates with that of PD-L1. Glycosylation of B7-H4 interferes with its interaction/ubiquitination by AMFR, resulting in B7-H4 stabilization. B7-H4 expression inhibits doxorubicin-induced cell death through the suppression of eIF2α phosphorylation required for calreticulin exposure vis-à-vis the cancer cells. NGI-1, which inhibits B7-H4 glycosylation causing its ubiquitination and subsequent degradation, improves the immunogenic properties of cancer cells treated with doxorubicin, enhancing their phagocytosis by dendritic cells and their capacity to elicit CD8+ IFNγ-producing T-cell responses. In preclinical models of TNBC, a triple combination of NGI-1, camsirubicin (a noncardiotoxic doxorubicin analogue) and PD-L1 blockade was effective in reducing tumor growth. Collectively, our findings uncover a strategy for targeting the immunosuppressive molecule B7-H4. SIGNIFICANCE: This work unravels the regulation of B7-H4 stability by ubiquitination and glycosylation, which affects tumor immunogenicity, particularly regarding immune-cold breast cancers. The inhibition of B7-H4 glycosylation can be favorably combined with immunogenic chemotherapy and PD-L1 blockade to achieve superior immuno-infiltration of cold tumors, as well as improved tumor growth control.See related commentary by Pearce and Läubli, p. 1789.This article is highlighted in the In This Issue feature, p. 1775.


Conflict of interest statement

Disclosure of Potential Conflicts of Interest

The authors declare no potential conflicts of interest.

Figures

Figure 1.
Figure 1.. Accumulation of B7-H4 is associated with immune-cold breast cancer and reduced PD-L1 expression.
(A) Proteomic analysis of 59 immune-relevant proteins in TCGA samples of PAM50-defined intrinsic subtypes including 25 basal-like, 29 luminal A, 33 luminal B, and 18 HER2-enriched tumors, along with three normal breast tissue samples. The genes (rows) are sorted according to the difference between the average proteomic level in basal subtype and the average proteomic in the other cancer types. (B) Heatmaps depicting expression of immune-relevant genes (mRNA) in the bulk tumor in FI (fully inflamed), SR (stroma restricted), MR (margin restricted) and ID (immune desert) TNBC (n=37). (C) The protein expression of PD-L1, PD-L2, B7-H3 and B7-H4 in 45 breast and 4 ovarian cancer cell lines were measured by immunoblot. (D) Expression of PD-L1 and B7-H4 in the indicated cell lines was quantified using ImageLab. Spearman correlation indicates B7-H4 expression is negatively correlated with PD-L1 expression in the test cancer lines (r = −0.6128, p =1.43x10⁻⁶). (E-I) Tissue array of 110 breast invasive ductal carcinoma (including 46 cases of ER/PR positive, 37 cases of Her2 positive and 17 cases of TNBC and 10 adjacent normal tissue specimens) were subjected to immunohistochemistry. (E) Representative paired immunohistochemical staining of B7-H4 and PD-L1. (F) Statistical analysis of immunohistochemical staining indicates B7-H4 expression is negatively correlated with PD-L1 expression in breast cancer tissues (r = −0.480, p =1.09x10⁻⁷). (G) The B7-H4 staining in the tissue array was quantified based on the subtypes including ER+/PR+, HER2+, TNBC and normal breast tissue samples. (H) Representative paired immunohistochemistry of B7-H4 and CD8. (I) Statistical analysis of immunohistochemically staining indicates that CD8 T cell number is negatively correlated with B7-H4 expression in breast cancer tissues (r = −0.408, p =1.00x10⁻⁵).
Figure 2.
Figure 2.. B7-H4 is tightly regulated by both glycosylation and ubiquitination.
(A) HCC1954, SKBR3 and MDA-MB-468 were treated with PNGase F followed by immunoblot analysis. (B) Pulse-chase analysis for HCC1954, SKBR3 and MDA-MB-468 cells. Cells were treated with 100 μg/ml cycloheximide at the indicated time point. B7-H4 levels were measured by immunoblotting. Actin was used as a loading control. (C) Ubiquitination assay. Flag-hB7-H4 were transfected into 293T cells in the presence or absence of proteasome inhibitor MG132. Then Flag-B7-H4 was immunoprecipitated by anti-Flag M2-beads followed by immunoblot using antibody against ubiquitin. (D) Deglycosylation of B7-H4 enhances its turnover. MDA-MB-468 were treated with 10 μg/ml N-glycosylation inhibitor tunicamycin for 24 h followed by pulse-chase with 100 μg/ml cycloheximide. B7-H4 protein levels at the indicated time points were monitored by immunoblot analysis. (E) The intensity of the 50 kDa form of B7-H4 in DMSO-group vs the 25 kDa form of B7-H4 in the tunicamycin group after the treatment with cycloheximide in MDA-MB-468 cells was quantified using ImageLab. (F) Glycosylation of hB7-H4 antagonizes its ubiquitination. 293T cells were transfected with Flag-hB7-H4 in the presence or absence of MG132 and/or tunicamycin. Flag-hB7-H4 was then immunoprecipitated followed by immunoblotting using anti-ubiquitin antibody. (G) The identification of glycosylation sites on hB7-H4. Flag-hB7-H4 was transfected into 293T cells followed by affinity capture purification in the absence or presence of PNGase F. The indicated glycosylation and ubiquitination sites have been identified by mass spectrometry analysis. (H) A series of glycosylation sites mutants were constructed and validated by sequencing followed by the transfection into 293T cells and immunoblotting. (I) Flag-tagged hB7-H4 wildtype and the mutants (K138R, K146R and K138/K146R (2KR)) were transfected into 293T cells. B7-H4 ubiquitination was conducted in the presence or absence of MG132.
Figure 3.
Figure 3.. Identification of the E3 ligase and glycosyltransferases of B7-H4 that govern B7-H4 protein stability and function
(A) Stable expression of Flag-hB7-H4 was engineered to MDA-MB-468 cells (MDA-MB-468-Flag-hB7-H4). B7-H4 complex was then purified followed by mass spectrometry analysis. Coomassie blue staining of the purified B7-H4 immunocomplex is shown. The ubiquitin E3 ligase AMFR and several glycosyltransferases including STT3A, RPN1, RPN2, and UGGG1 were identified, and the representative spectra of AMFR, STT3A and UGGG1 are shown. (B) Validation of biochemical interactions of B7-H4 with AMFR, STT3A, UGGG1 as well as HSP90. MDA-MB-468-Flag-hB7-H4 cells were utilized for immunoprecipitation using anti-Flag M2-beads in the presence or absence of MG132 and/or tunicamycin. The interactions of AMFR, STT3A, UGGG1 as well as HSP90 with B7-H4 were measured by immunoblot. (C) Double immunofluorescence staining hB7-H4-Flag with AMFR or STT3A in MDA-MB-468-Flag-hB7-H4 cells followed by the confocal microscope (Scale bar =10 μm). (D) MDA-MB-468-Flag-hB7-H4 cells were subjected to duolink in situ PLA assay with specific Flag mouse antibody and AMFR or STT3A rabbit antibody (Scale bar = 100 μm). Red dots indicate the binding of the indicated two proteins. (E) AMFR knockdown results in upregulation of B7-H4. Stable knockdown of AMFR in MDA-MB-468 and SKBR3 were established. The expression of AMFR and B7-H4 were examined by immunoblotting. (F) STT3A knockdown leads to downregulation of B7-H4. STT3A stable knockdowns in MDA-MB-468 cells were established. The expression of STT3A and B7-H4 were examined by immunoblotting. (G) Decreased membrane B7-H4 in STT3A knockdown cells. MDA-MB-468-shVector, MDA-MB-468-shSTT3A, SKBR3-shVector, and SKBR3-shSTT3A cells were stained with PE anti-human B7-H4 antibody followed by flow cytometry. Representative images are shown. (H) The quantification of membrane staining of B7-H4 in MDA-MB-468-shVector, MDA-MB-468-shSTT3A, SKBR3-shVector, and SKBR3-shSTT3A cells are shown. (I) MDA-MB-468 and SKBR3 cells were treated with 10 μM OST inhibitor NGI-1 for 24 h. The expression of B7-H4 was examined by immunoblotting. (J) Blockade of B7-H4 glycosylation by NGI-1 enhances B7-H4 ubiquitination. 293T cells were transfected with Flag-hB7-H4 in the presence or absence of 10 μM NGI-1 for 24 h. Then Flag-hB7-H4 was immunoprecipitated followed by immunoblotting using antibody against ubiquitin.
Figure 4.
Figure 4.. Mapping of molecular domains/motifs and structure-based modeling and simulations reveal critical regions and interfacial interactions involved in the complex formation between B7-H4 and E3 ligase AMFR
(A) Schematic diagram of human B7-H4 domains and strategy to engineer a series of B7-H4 deletion mutants. (B) Mapping of B7-H4 regions (sequence ranges) involved in interactions with AMFR. The interactions between Myc-AMFR and the displayed Flag-hB7-H4 fragments were examined by co-IP experiments in 293T cells. (C) Schematic diagram of human AMFR domains/motifs and strategy to engineer a series of AMFR deletion mutants. Abbreviations: TM (transmembrane domain), RING motif (E3 ligase activity), OS (Oligomerization domain), CUE domain (Couples Ubiquitin molecules to ER degradation), G2BR (Ube2G2 binding region), VIM (p97/VCP interacting motif). (D) Mapping of AMFR domains/motifs that interact with B7-H4. The interactions between Myc-hB7-H4 and the displayed Flag-AMFR fragments were examined by co-IP experiments in 293T cells. The representative structures of the top 1 cluster of the ZDOCK docking poses between B7-H4 and AMFR RING domain are shown in (E). AMFR RING, B7-H4 Ig-like V type and Ig-like C2-type domains are in cyan, pale green and green. Ubiquitination sites (K138 and K146) are shown as blue sticks with alpha-carbon atoms highlighted in blue spheres. All asparagines are shown as orange sticks, and the alpha-carbon atoms of five identified asparagines N112, N140, N156, N160, N255 (not shown in the structure) are highlighted in orange spheres. The two ZN2+ ions form coordination bonds are shown as salmon spheres. Residues in the binding interfaces from AMFR and B7-H4 are shown as cyan and green sticks, respectively. Time evolution of the RMSDs of AMFR RING domain in the 120 ns MD simulations of the complex formed with B7-H4 using the start points in (E) is shown in (F). The RMSD was evaluated after structurally aligning the conformers observed during MD trajectories with respect to the B7-H4 Ig-like C2-type domain. The corresponding time evolution of residue-residue interactions between B7-H4 and AMFR RING domain residues are shown in (G). Regions shaded in gray refer to time intervals during which the indicated atom pairs (ordinate) made interfacial contacts. The representative structures of the top 2 cluster of the ZDOCK docking poses between B7-H4 and AMFR RING domain are shown in (H). Time evolution of the RMSDs of AMFR RING domain in the 120 ns MD simulations of the complex formed with B7-H4 using the start points in (H) is shown in (I). The corresponding time evolution of residue-residue interactions between B7-H4 and AMFR RING domain residues are shown in (J).The RMSDs profiles of the B7-H4 Ig-like (K) V-type and (L) C2-type domains are shown in blue and red curves for B7-H4 wildtype and 16NQ mutant, respectively. The corresponding RMSFs values of residues in the two domains are shown in (M) and (N), respectively. The spheres on the red curves indicate the positions of the 16NQ mutations. The RMSDs and RMSFs values for the 16NQ mutant are slightly higher than those of the wildtype in the C2-type domain, though the difference is not statistically significant. Flexibilities (RMSDs and RMSFs) of the Ig-like V-type domain of B7-H4 wildtype and16NQ mutant are quite similar.
Figure 5.
Figure 5.. B7-H4 inhibits doxorubicin-induced ICD through regulating the PERK/eIF2a/CALR axis.
(A) SKBR3 cells were treated with 10 μM doxorubicin and/or 10 μM NGI-1 for 24 h. Membrane CALR, HSP70 and HSP90 were measured by flow cytometry. (B) MDA-MB-468-vector and MDA-MB-468-B7-H4 knockout cells were established and treated with 5 μM doxorubicin for 24 h. Immunofluorescence staining of the immunogenic cell death markers CALR on the cell surface was performed. Mean fluorescence index of CALR was quantified by ImageJ. Representative images are shown. (C-D) SKBR3, MDA-MB-468, MDA-MB-468-vector, MDA-MB-468-B7-H4 knockout cells were treated with 1 or 10 μM doxorubicin and/or 10 μM NGI-1 for 24 h. p-eIF2a and actin were examined by immunoblotting. Scale bar, 100 μm. (E) Representative paired immunohistochemistry staining of B7-H4 and phospho eIF2α (Ser51) in tissue array BC081120. Statistical analysis of immunohistochemical staining indicates B7-H4 expression is negatively correlated with p-eIF2α expression in breast cancer (r = −0.249, p =8.71x10⁻³). (F) MDA-MB-468-Flag-hB7-H4 were treated in the presence or absence of doxorubicin (10 μM) and/or NGI-1 (10 μM). Then Flag-hB7-H4 was immunoprecipitated followed by immunoblot. The indicated proteins were examined. (G) Schematic diagram of the procedure of OptiPrep density gradient assay with 24 collected fractions from low to high density is shown. MDA-MB-468-vector and MDA-MB-468-hB7-H4 knockout cells were treated with 10 μM doxorubicin for 24 hr followed by OptiPrep density gradient assay. HSP90, CALR, eIF2α and p-eIF2α in fraction 1 to 13 were examined by immunoblotting. (H) eIF2a was immunoprecipitated in fraction 13 in both MDA-MB-468-vector and MDA-MB-468-B7-H4 knockout cells followed by immunoblotting. PERK, eIF2α and p-eIF2α were examined.
Figure 6.
Figure 6.. B7-H4 and its ubiquitination or glycosylation-deficient mutants profoundly alter tumor growth and doxorubincin-induced immunogenic cell death
(A-B) In vitro phagocytosis of co-culture of mouse DCs and tumor cells. 4T1-vector and 4T1-B7-H4 cells were treated with doxorubicin (25 μM) or NGI-1 (10 μM) for 24 hour and co-cultured with the purified CD11c positive cells for 2 hours at a ratio of 1: 1, and then subjected to flow cytometry. n=3 mice per group. (C) In vivo vaccination assay. 4T1-vector or 4T1-B7-H4 cells were treated with doxorubincin (Dox, 25 μM) alone or in combination with NGI-1 (10 μM) for 24 h. Then these cells (106 per mice) were orthotopically injected into the right fourth mammary gland of the BALB/c mice (the vaccination step). PBS was used in the non-vaccinated group. One week later, all mice were rechallenged with live 4T1-vector or 4T1-B7-H4 cells (3 × 10⁵ per mouse) of the same kind as the vaccination step in the left fourth mammary gland (the challenge step). The tumor growth was monitored twice per week. n=8 mice per group. (D) Failure of nu/nu BALB/c to mount an immune response against Dox/NGI-1 treated 4T1-vector or 4T1-B7-H4 cells. Nude mice were inoculated with Dox/NGI-1 treated 4T1-V or B7-H4 cells 1-2 weeks before the injection of live 4T1-vector or B7-H4 cells into the opposite flank, the tumor growth was monitored. n=6 mice per group. (E) 4T1-vector or 4T1-B7-H4 cells were treated with doxorubincin (Dox, 25 μM) alone or in combination with NGI-1 (10 μM) for 24 h. These cells were then orthotopically injected into the right fourth mammary gland of the BALB/c mice (the vaccination step). PBS was used in non-vaccinated control group. One or two week later, all mice were challenged with injection of live 4T1-vector or 4T1-B7-H4 cells (the same kind cells as used in the vaccination step) in the left fourth mammary gland (the challenge step). On day 28, mouse spleens of BALB/C mice were harvested and followed by ELISPOT. Quantification of IFNγ ELISPOT is shown. n=3 mice per group. (F-I) In vivo vaccination assays were performed with 4T1-hB7-H4, 4T1-hB7-H4-2KR, and 4T1-hB7-H4-16NQ cells. BALB/c mice were inoculated with Dox/NGI-1-treated 4T1-hB7-H4, 4T1-hB7-H4-2KR, and 4T1-hB7-H4-16NQ cells 1-2 weeks (the vaccination step, PBS was used in the non-vaccinated group) before the injection of the live cells of the same kind (4T1-hB7-H4, 4T1-hB7-H4-2KR and 4T1-hB7-H4-16NQ cells) into the opposite mammary gland (the challenge step), (F) the tumor growth was monitored. n=10 mice per group. (G) On day 28, mouse spleens were harvested and followed by IFNγ ELISPOT. Quantification of IFNγ ELISPOT is shown. n=3 mice per group. PBS is used in non-vaccinated group. (H) On day 28, mouse spleens were harvested and followed by flow cytometry of staining IFNγ and CD8. Quantification of IFNγ+CD8+cells is shown. n=3 mice per group. PBS is used in non-vaccinated control group. (I) On day 28, mouse tumors in the mammary gland were harvested and digested followed by flow cytometry by detecting CD45 and CD8. n=3 mice per group. PBS is used in non-vaccinated control group. Quantification of CD8+ infiltrating cells is shown.
Figure 7.
Figure 7.. The anti-tumor efficacy of the combination of NGI-1 and a doxorubicin analog are enhanced by PD-L1 blockade
(A) 4T1-hPD-L, where the basal mouse PD-L1 was knocked out followed by adding back human PD-L1 gene, and 4T1-hB7-H4 cells were orthotopically injected into the left fourth mammary fat pad and allow to grow around 100 mm3, followed by injection of Cam (25 mg/kg, i.p.) for 4 times, NGI-1 nanoparticle (10 mg/kg, i.v.) as well as PD-L1 antibody durvalumab (5 mg/kg, i.p.) for 3 times. The tumor growth was monitored twice per week. n=8 mice per group. (B) Survival curve of the mice of the combination of Cam, NGI-1 nanoparticle and durvalumab. n=8 mice per group. (C) On day 18, mouse tumors were harvested, and digested followed by flow cytometry of staining IFNγ and CD8. Quantification of IFNγ+CD8+ or CD8+ cell in the tumor mass is shown. n=3 mice per group. (D) Tumor tissues were subjected to the immunohistochemically staining with anti-CD8 antibody. n=3 mice per group. The representative images are shown. Scale bar, 20 μm. Quantification of CD8+ infiltrating cells is shown. (E) E0771-mB7-H4 cells (1×10⁵) were orthotopically injected into the left fourth mammary fat pad. When the tumors were visible on day 6, Cam (5 mg/kg, i.p.) was injected on day 6, 8, 10, and 12; NGI-1 nanoparticles (10 mg/kg, i.v.) were injected on day 7, 9, 11, and 12; and the anti-mPD-L1 antibody (5 mg/kg, i.p.) was injected on day 8, 10, and 12. The tumor growth was monitored twice per week. n=9 mice per group. (F) The percentage of tumor free mice was evaluated every week for 42 days (n=9). Log-rank (Mantel-Cox) test was performed for statistical analysis. (G) On day 27, spleens were harvested followed by flow cytometry of staining IFNγ and CD8. Quantification of IFNγ+CD8+ or CD8+ cells in the spleens is shown. n=3-5 mice per group. (H) The proposed working model of the combination of immunogenic chemotherapy, NGI-1 and PD-L1 blockade.

Comment in

Similar articles

Cited by

References

    1. Marra A, Viale G, Curigliano G. Recent advances in triple negative breast cancer: the immunotherapy era. BMC medicine 2019;17(1):90 doi 10.1186/s12916-019-1326-5. - DOI - PMC - PubMed
    1. Bonaventura P, Shekarian T, Alcazer V, Valladeau-Guilemond J, Valsesia-Wittmann S, Amigorena S, et al. Cold Tumors: A Therapeutic Challenge for Immunotherapy. Front Immunol 2019;10:168 doi 10.3389/fimmu.2019.00168. - DOI - PMC - PubMed
    1. Sica GL, Choi IH, Zhu G, Tamada K, Wang SD, Tamura H, et al. B7-H4, a molecule of the B7 family, negatively regulates T cell immunity. Immunity 2003;18(6):849–61. - PubMed
    1. Prasad DV, Richards S, Mai XM, Dong C. B7S1, a novel B7 family member that negatively regulates T cell activation. Immunity 2003;18(6):863–73 doi 10.1016/s1074-7613(03)00147-x. - DOI - PubMed
    1. Zang X, Loke P, Kim J, Murphy K, Waitz R, Allison JP. B7x: a widely expressed B7 family member that inhibits T cell activation. Proc Natl Acad Sci U S A 2003;100(18):10388–92 doi 10.1073/pnas.1434299100. - DOI - PMC - PubMed

Publication types

MeSH terms