. 2020 Nov 15;80(22):5109-5120.
doi: 10.1158/0008-5472.CAN-20-1231. Epub 2020 Sep 16.

Integrating Mathematical Modeling with High-Throughput Imaging Explains How Polyploid Populations Behave in Nutrient-Sparse Environments

Affiliations

Integrating Mathematical Modeling with High-Throughput Imaging Explains How Polyploid Populations Behave in Nutrient-Sparse Environments

Gregory J Kimmel et al. Cancer Res. .

Abstract

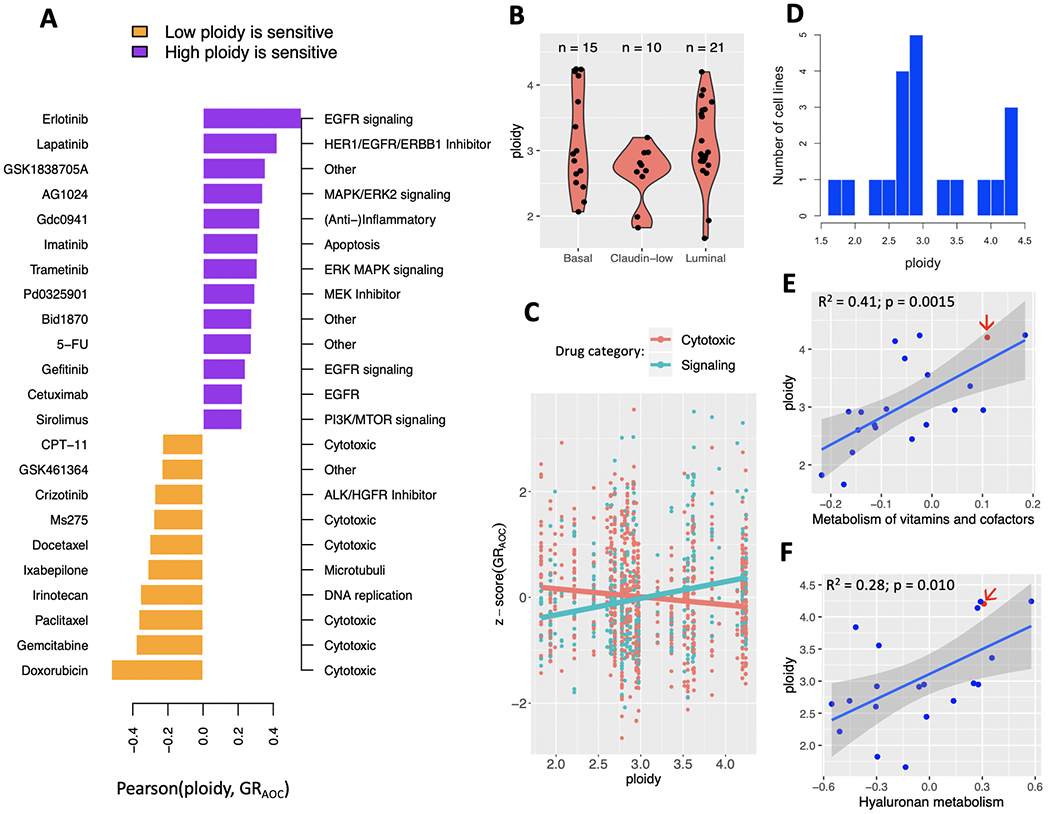
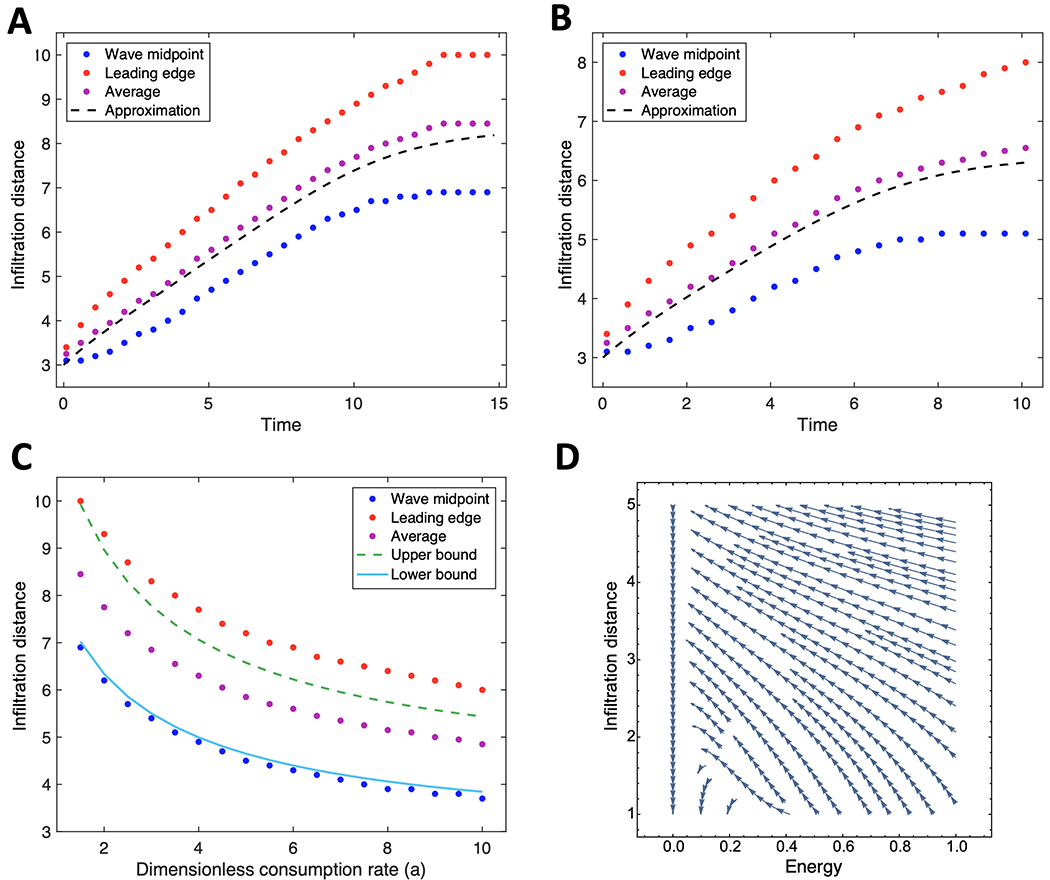
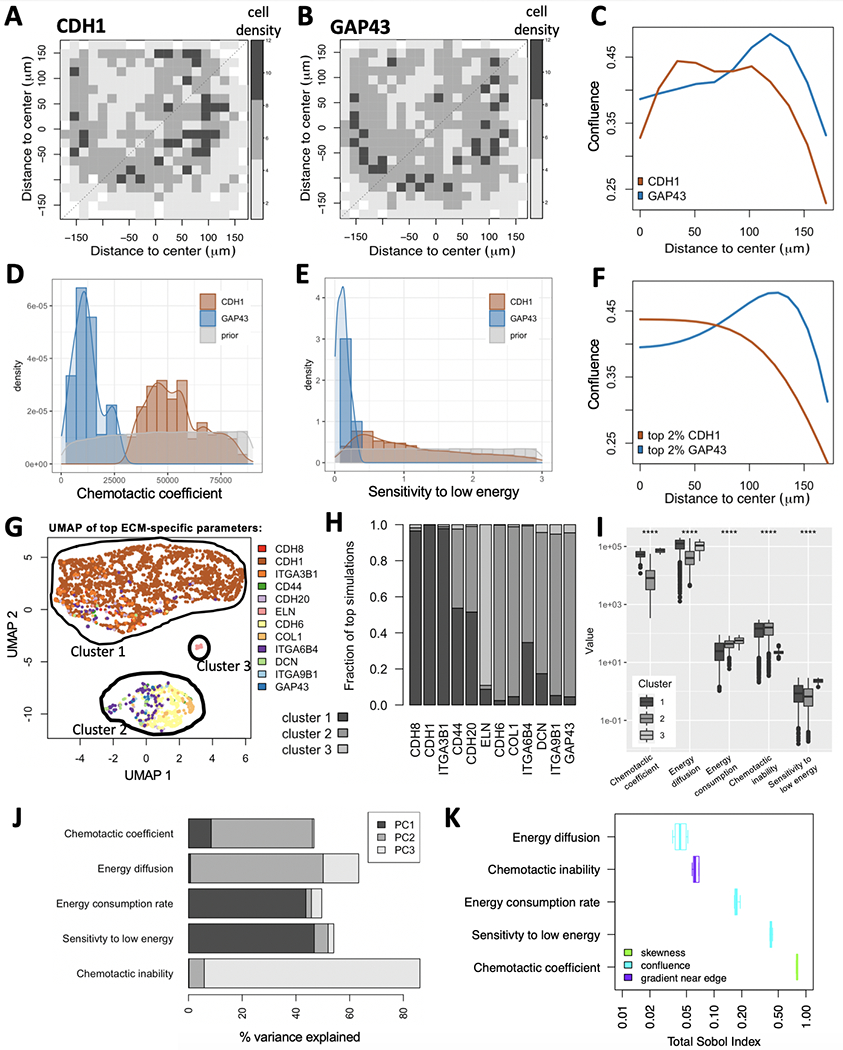
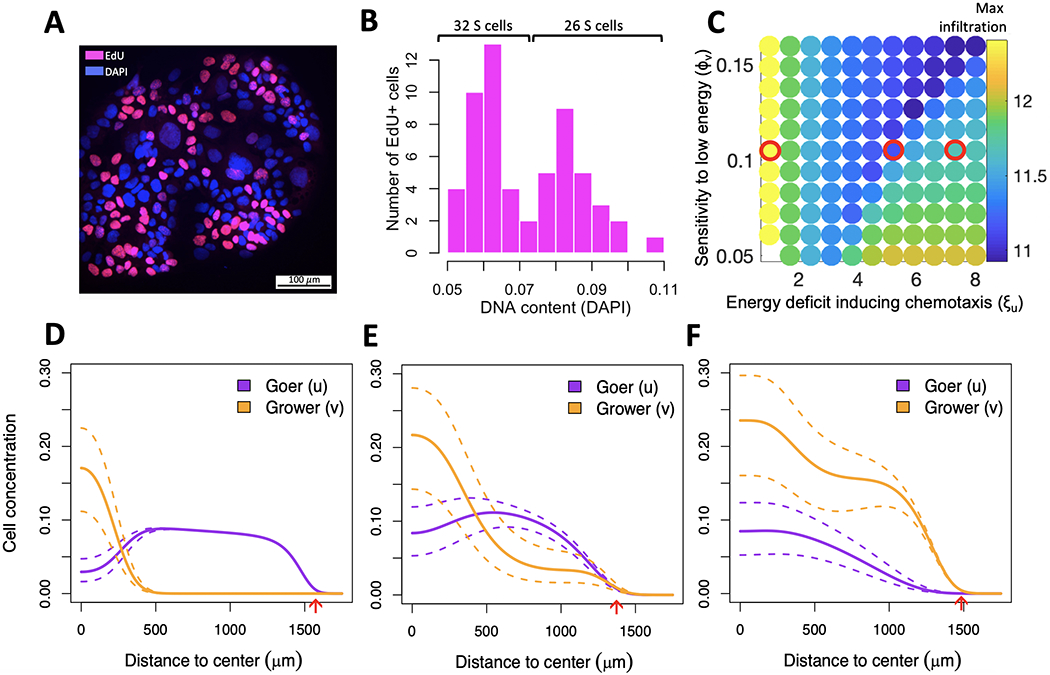
Breast cancer progresses in a multistep process from primary tumor growth and stroma invasion to metastasis. Nutrient-limiting environments promote chemotaxis with aggressive morphologies characteristic of invasion. It is unknown how coexisting cells differ in their response to nutrient limitations and how this impacts invasion of the metapopulation as a whole. In this study, we integrate mathematical modeling with microenvironmental perturbation data to investigate invasion in nutrient-limiting environments inhabited by one or two cancer cell subpopulations. Subpopulations were defined by their energy efficiency and chemotactic ability. Invasion distance traveled by a homogeneous population was estimated. For heterogeneous populations, results suggest that an imbalance between nutrient efficacy and chemotactic superiority accelerates invasion. Such imbalance will spatially segregate the two populations and only one type will dominate at the invasion front. Only if these two phenotypes are balanced, the two subpopulations compete for the same space, which decelerates invasion. We investigate ploidy as a candidate biomarker of this phenotypic heterogeneity and discuss its potential to inform the dose of mTOR inhibitors (mTOR-I) that can inhibit chemotaxis just enough to facilitate such competition. SIGNIFICANCE: This study identifies the double-edged sword of high ploidy as a prerequisite to personalize combination therapies with cytotoxic drugs and inhibitors of signal transduction pathways such as mTOR-Is. GRAPHICAL ABSTRACT: http://cancerres.aacrjournals.org/content/canres/80/22/5109/F1.large.jpg.


Conflict of interest statement

Conflict of Interest

The authors declare no potential conflicts of interest.

Figures

Figure 1:
Figure 1:
Ploidy, pathway activity and drug sensitivity across breast cancer cell lines from CCLE. (A) High-ploidy breast cancer cell lines are resistant to cytotoxic drugs, but tend to be more sensitive to inhibitors of mTOR, EGFR and MAPK signaling pathways. Hereby ploidy is defined as the number of chromosomes in the cell line’s consensus karyotype, weighted by chromosome size. Only drugs with a Pearson correlation coefficient at or above 0.2 are shown here. (B) Distribution of ploidy within and across three molecular breast cancer subtypes. (C) Regression coefficient of ploidy as predictor of GRAOC has opposite signs depending on drug category across all subtypes. (D) Distribution of ploidy across 20 primary, adherent breast cancer cell lines from CCLE. (E-F) Ploidy is correlated with the activity of pathways involved in metabolism of vitamins and cofactors (E) and Hyaluronan metabolism (F). One cell line with available MEMA profiling data -- HCC1954 -- is highlighted (red arrow).
Figure 2:
Figure 2:
Comparing analytical approximations of the degree of infiltration with those obtained from simulations.(A-B) Traveling-wave solutions at energy consumption rates a = 1.5 (A) and a = 3.5 (B). (C) Upper and lower boundaries of traveling wave solutions estimated from equilibration are shown as a function of consumption rate. Approximation is found by lower and upper bound Λ = 0,1 from equation(4). (D) Phase diagram of energy consumption and front location using the derived coupled system(3a)-(3b). (A-D) All approximations and simulations assume energy is uniformly distributed at all times, i.e. chemotaxis does not take place. Parameter values for initial seeding radius (ρ0), dish radius (R), and sensitivity to low energy (φ) are set to 3, 10 and 0.05 respectively. Red = leading edge of wave (estimated by finding value of cell concentration closest to 0.01); blue = midpoint of wave (estimated by finding value of cell concentration closest to 0.5); purple = average of red and blue; black lines are approximations based on analytical solutions. Time is in units of the maximal growth rate of the given cell line. Front location is given in units of the characteristic length χ/λ.
Figure 3:
Figure 3:
Model calibration using MEMA profiling of HCC1954 cells. (A-C) Experimentally measured data. Variability in cell growth patterns across ECMs is demonstrated via two example ECMs: CDH1 (A) and GAP43 (B). The average local cell densities are displayed for both (color legend). (C) Projecting their 2D spatial distributions onto 1D reveals enrichment of cells at the edge of the ECM spot for GAP43, but not for CDH1. (D-F) Simulated data. Comparing prior-distribution of chemotactic coefficients (D) and sensitivity to low energy (E) to ECM-specific posterior distributions reveals clear differences between CDH1 and GAP43 for both parameters. (F) Maximum-likelihood parameter choices for CDH1 and GAP43 result in distinct spatial distributions between the two ECMs, each of which resemble the measured distributions (C). (G-I) ECM specific model parameters. Simulations were compared to each measured ECM-specific growth pattern and ranked by their maximum similarity. (G-H) The five model parameters from the top 2.3% simulations were projected onto UMAP space, revealing three clusters. Color-coding simulations by the ECM responsible for their presence in the top simulations suggests enrichment of most ECMs to only a single cluster (G). (H) This was confirmed when comparing cluster membership across the 12 represented ECMs. (I) All five model parameters (x-axis) show significant differences between the three clusters (****: p <= 0.0001). (J-K) Parameter sensitivity analysis. (J) The % variance explained per parameter shows significant contribution of all five model parameters to at least one of the first three principal components (PCs). (K) The Sobol index (x-axis) tells us which parameter best explains which aspect of the cells’ spatial distribution (color-code): its skewness, confluence or gradient near the edge.
Figure 4:
Figure 4:
Internal competition of co-existing subpopulations for same space slows down invasion of the metapopulation. (A) DNA content and cell cycle state of 162 cells growing on HGF-exposed ICAM1. (B) DAPI intensity of 58 replicating (EdU+) cells shows a bimodal distribution, indicating the presence of two subpopulations -- a low-ploidy population (grower) comprising ~55\% cells and a high-ploidy population (goer) comprising ~45\% cells. (C) Arms race between the grower’s energetic sensitivity (y-axis) and the goer’s chemotactic ability (x-axis) reduces infiltration distance (color bar). Red circles outline parameter combinations of interest explored in (D-F). (D-F) Spatial distribution of goer and grower for parameter values outlined in (C). Dotted lines outline extreme trajectories of expected cell concentrations due to incertitude in initial goer/grower proportions, as estimated from the silhouette coefficient of cells in panel B (see also Supplementary Fig. 6B). (D) High chemotactic motility will cause the goer to leave the center of the dish too soon, leaving room for the grower to expand there. (E) With an intermediate motility the goer succeeds maintaining high representation both at the center and edge of the dish. (F) Low motility will prevent the goer from gaining a sufficient spatial lead from the grower while energy is still abundant, and it will lose dominance at the edge of the dish once energy becomes sparse. Red arrows indicate maximum infiltration distance achieved by either of the two populations.

References

    1. Spiteri I, Caravagna G, Cresswell GD, Vatsiou A, Nichol D, Acar A, et al. Evolutionary dynamics of residual disease in human glioblastoma. Annals of Oncology: Official Journal of the European Society for Medical Oncology. 2019;30:456–63. - PMC - PubMed
    1. Brastianos PK, Carter SL, Santagata S, Cahill DP, Taylor-Weiner A, Jones RT, et al. Genomic Characterization of Brain Metastases Reveals Branched Evolution and Potential Therapeutic Targets. Cancer Discovery. 2015;5:1164–77. - PMC - PubMed
    1. Angelova M, Mlecnik B, Vasaturo A, Bindea G, Fredriksen T, Lafontaine L, et al. Evolution of Metastases in Space and Time under Immune Selection. Cell. 2018;175:751–765.e16. - PubMed
    1. Hannibal RL, Chuong EB, Rivera-Mulia JC, Gilbert DM, Valouev A, Baker JC. Copy number variation is a fundamental aspect of the placental genome. PLoS genetics. 2014;10:e1004290. - PMC - PubMed
    1. Dewhurst SM, McGranahan N, Burrell RA, Rowan AJ, Grönroos E, Endesfelder D, et al. Tolerance of whole-genome doubling propagates chromosomal instability and accelerates cancer genome evolution. Cancer Discovery. 2014;4:175–85. - PMC - PubMed

Publication types

MeSH terms