. 2020 Dec;31(12):2815-2832.
doi: 10.1681/ASN.2020050572. Epub 2020 Sep 16.

Synaptopodin Is Dispensable for Normal Podocyte Homeostasis but Is Protective in the Context of Acute Podocyte Injury

Affiliations

Synaptopodin Is Dispensable for Normal Podocyte Homeostasis but Is Protective in the Context of Acute Podocyte Injury

Liang Ning et al. J Am Soc Nephrol. 2020 Dec.

Abstract

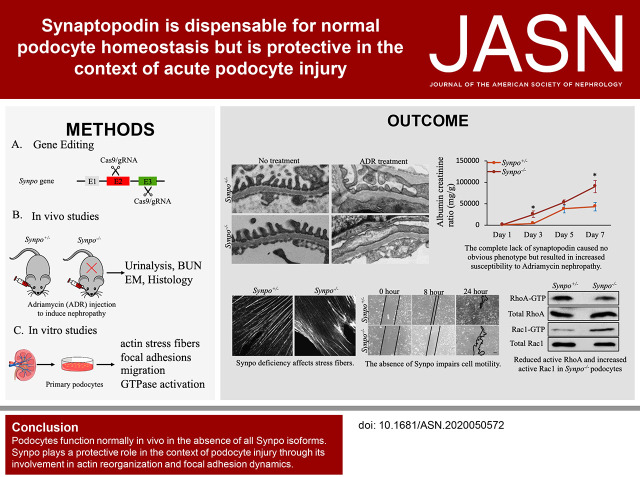
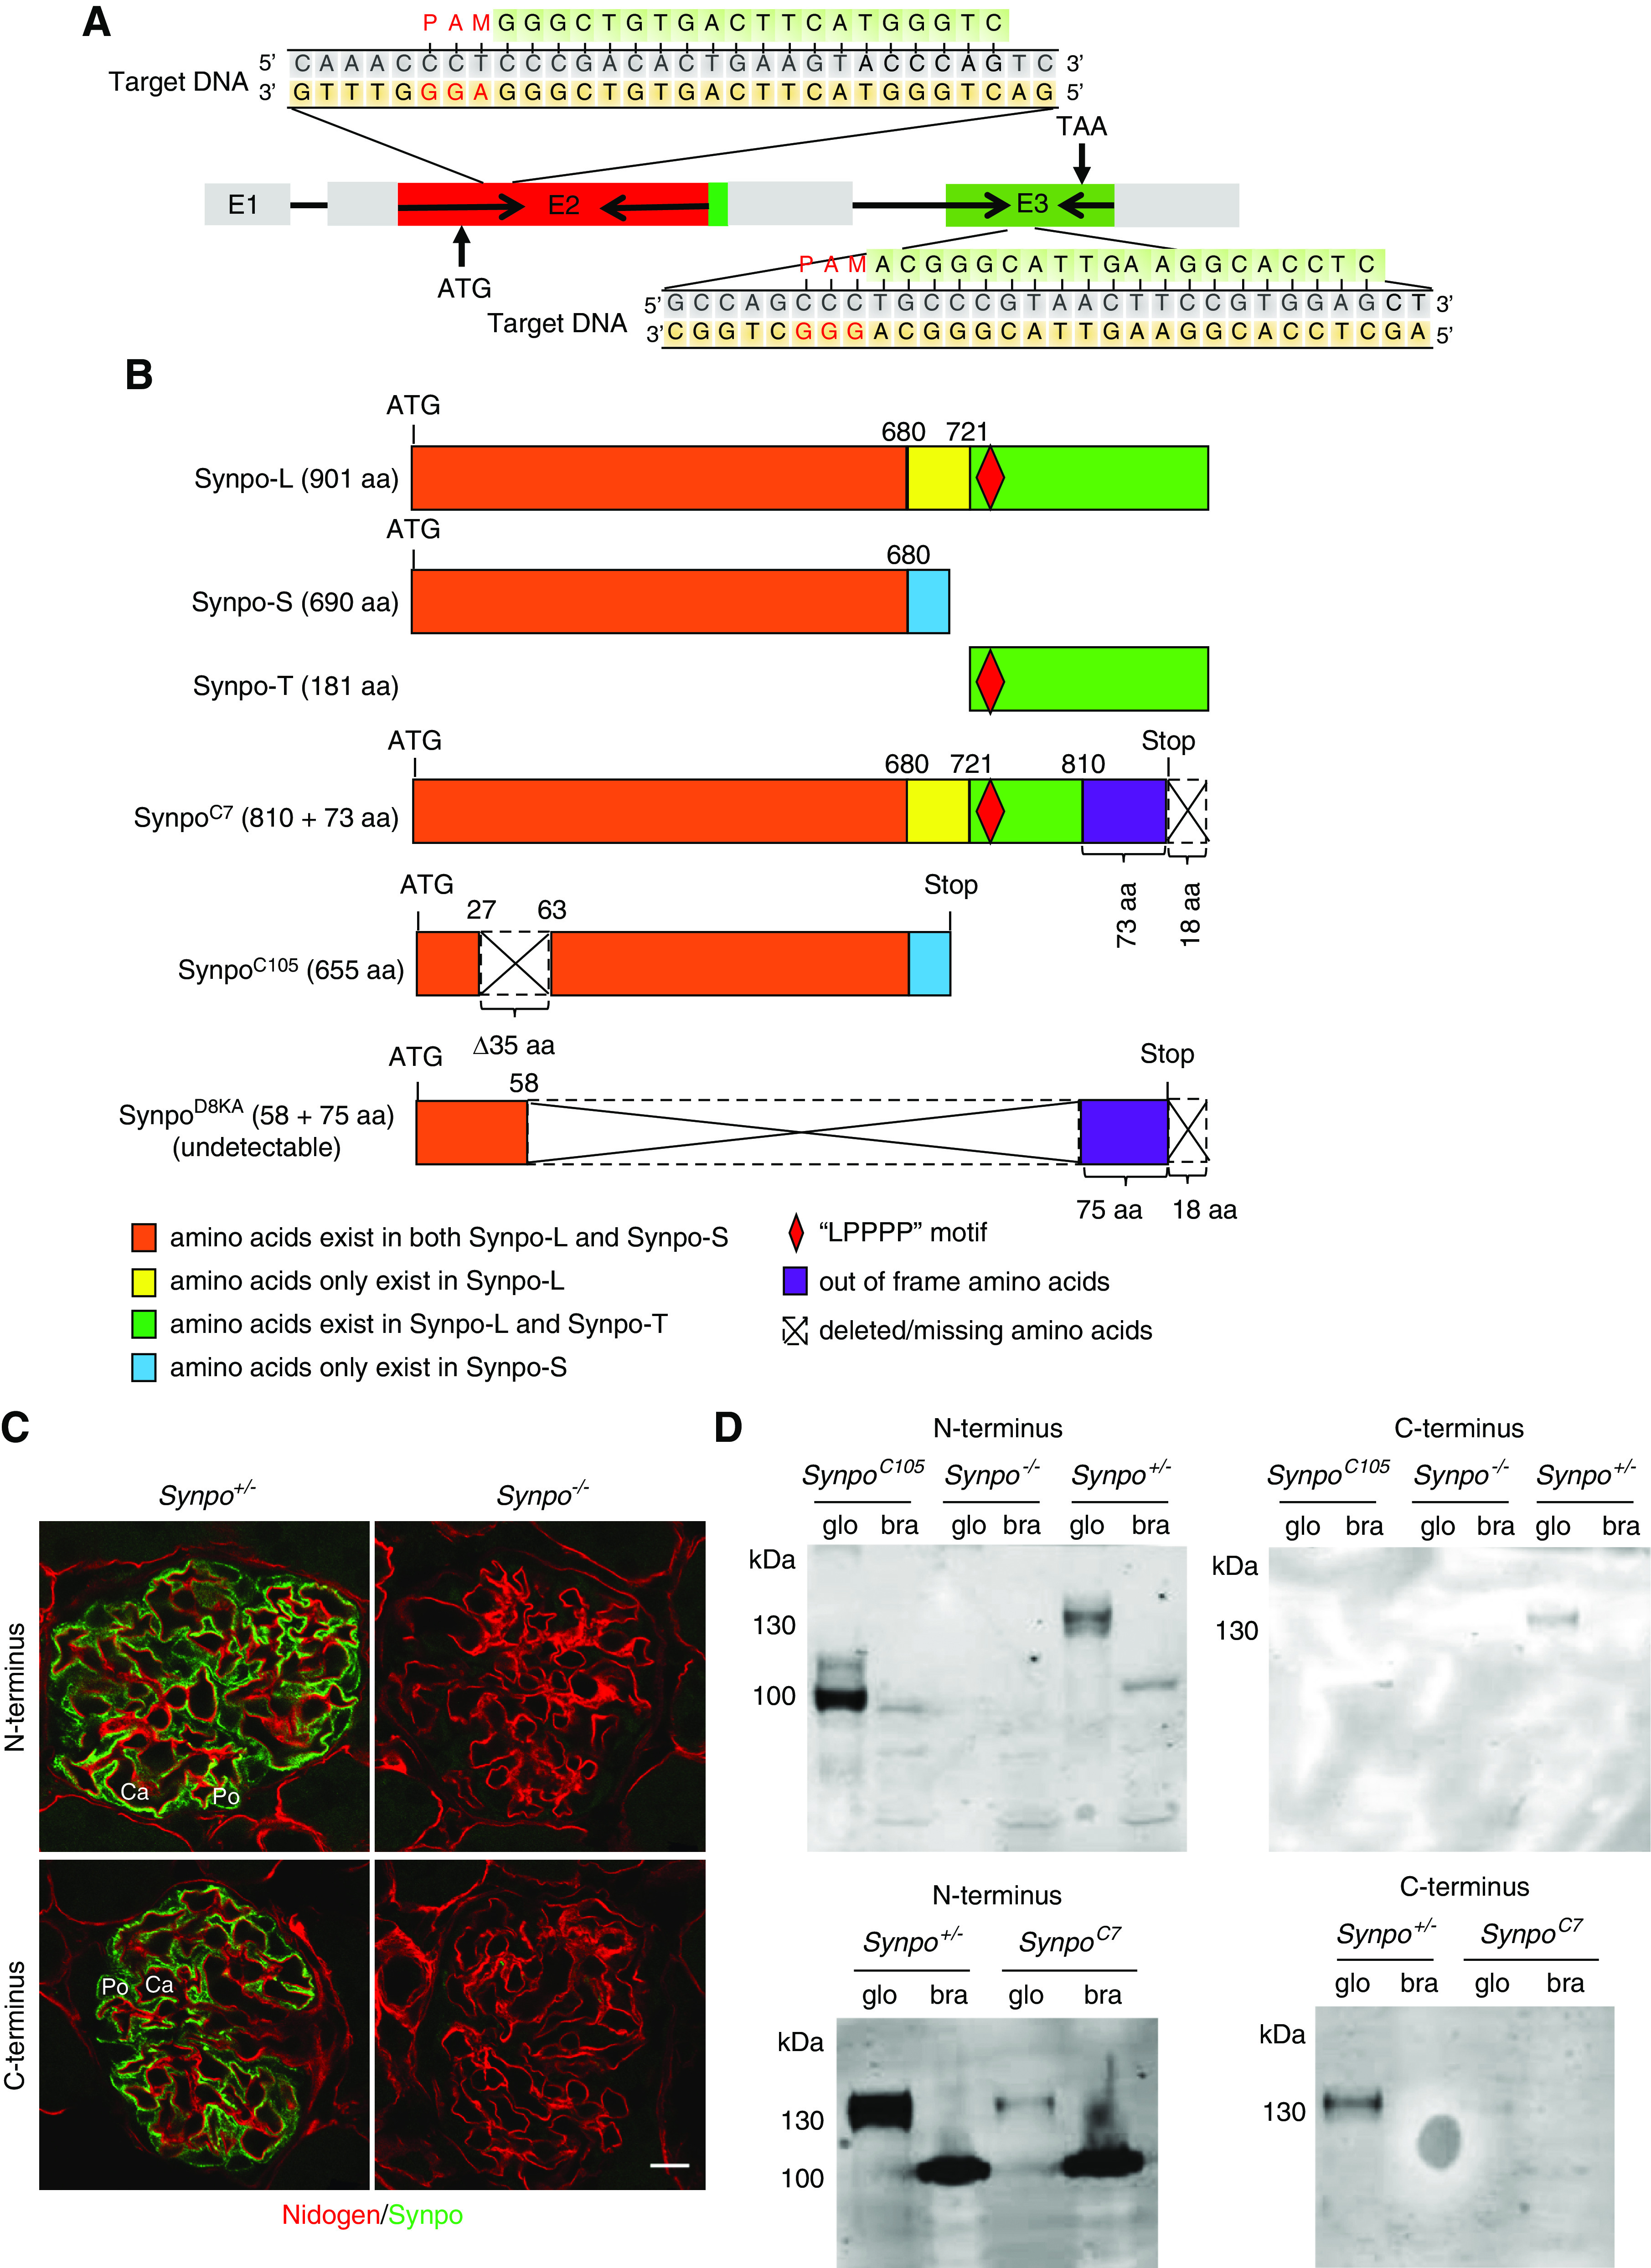
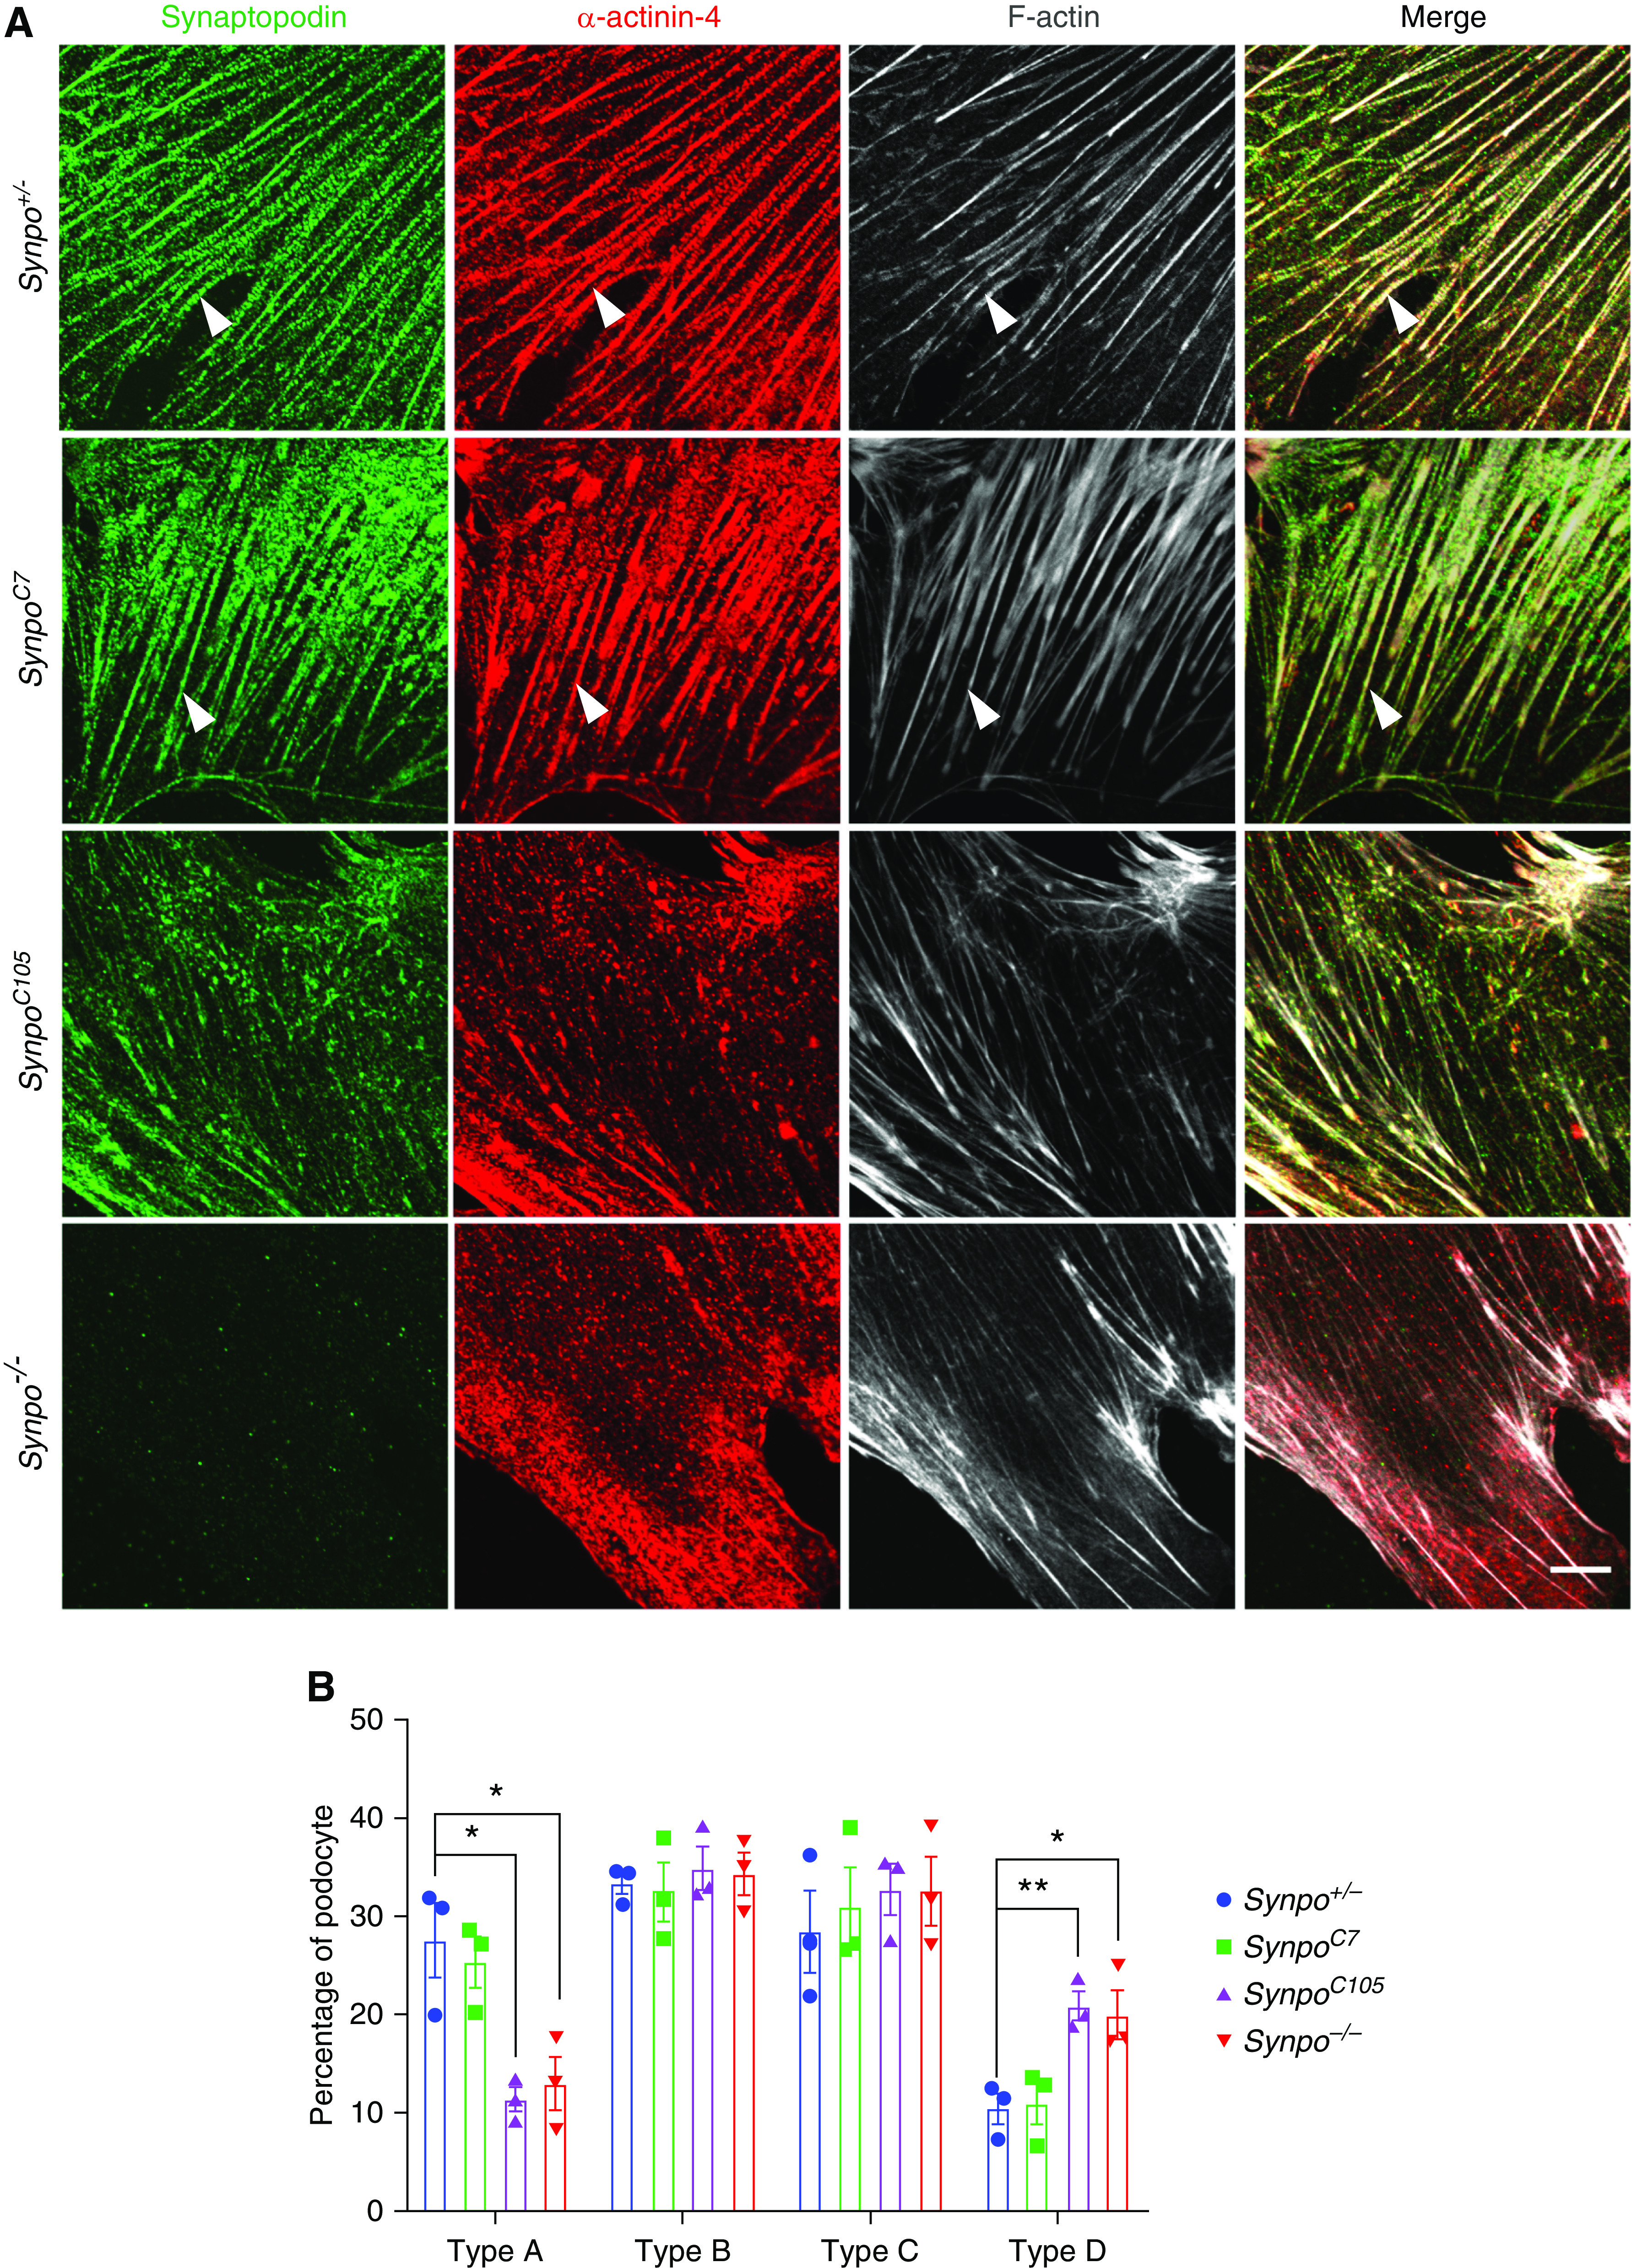
Background: Synaptopodin (Synpo) is an actin-associated protein in podocytes and dendritic spines. Many functions in regulating the actin cytoskeleton via RhoA and other pathways have been ascribed to Synpo, yet no pathogenic mutations in the SYNPO gene have been discovered in patients. Naturally occurring Synpo isoforms are known (Synpo-short and -long), and a novel truncated version (Synpo-T) is upregulated in podocytes from Synpo mutant mice. Synpo-T maintains some Synpo functions, which may prevent a podocyte phenotype from emerging in unchallenged mutant mice.

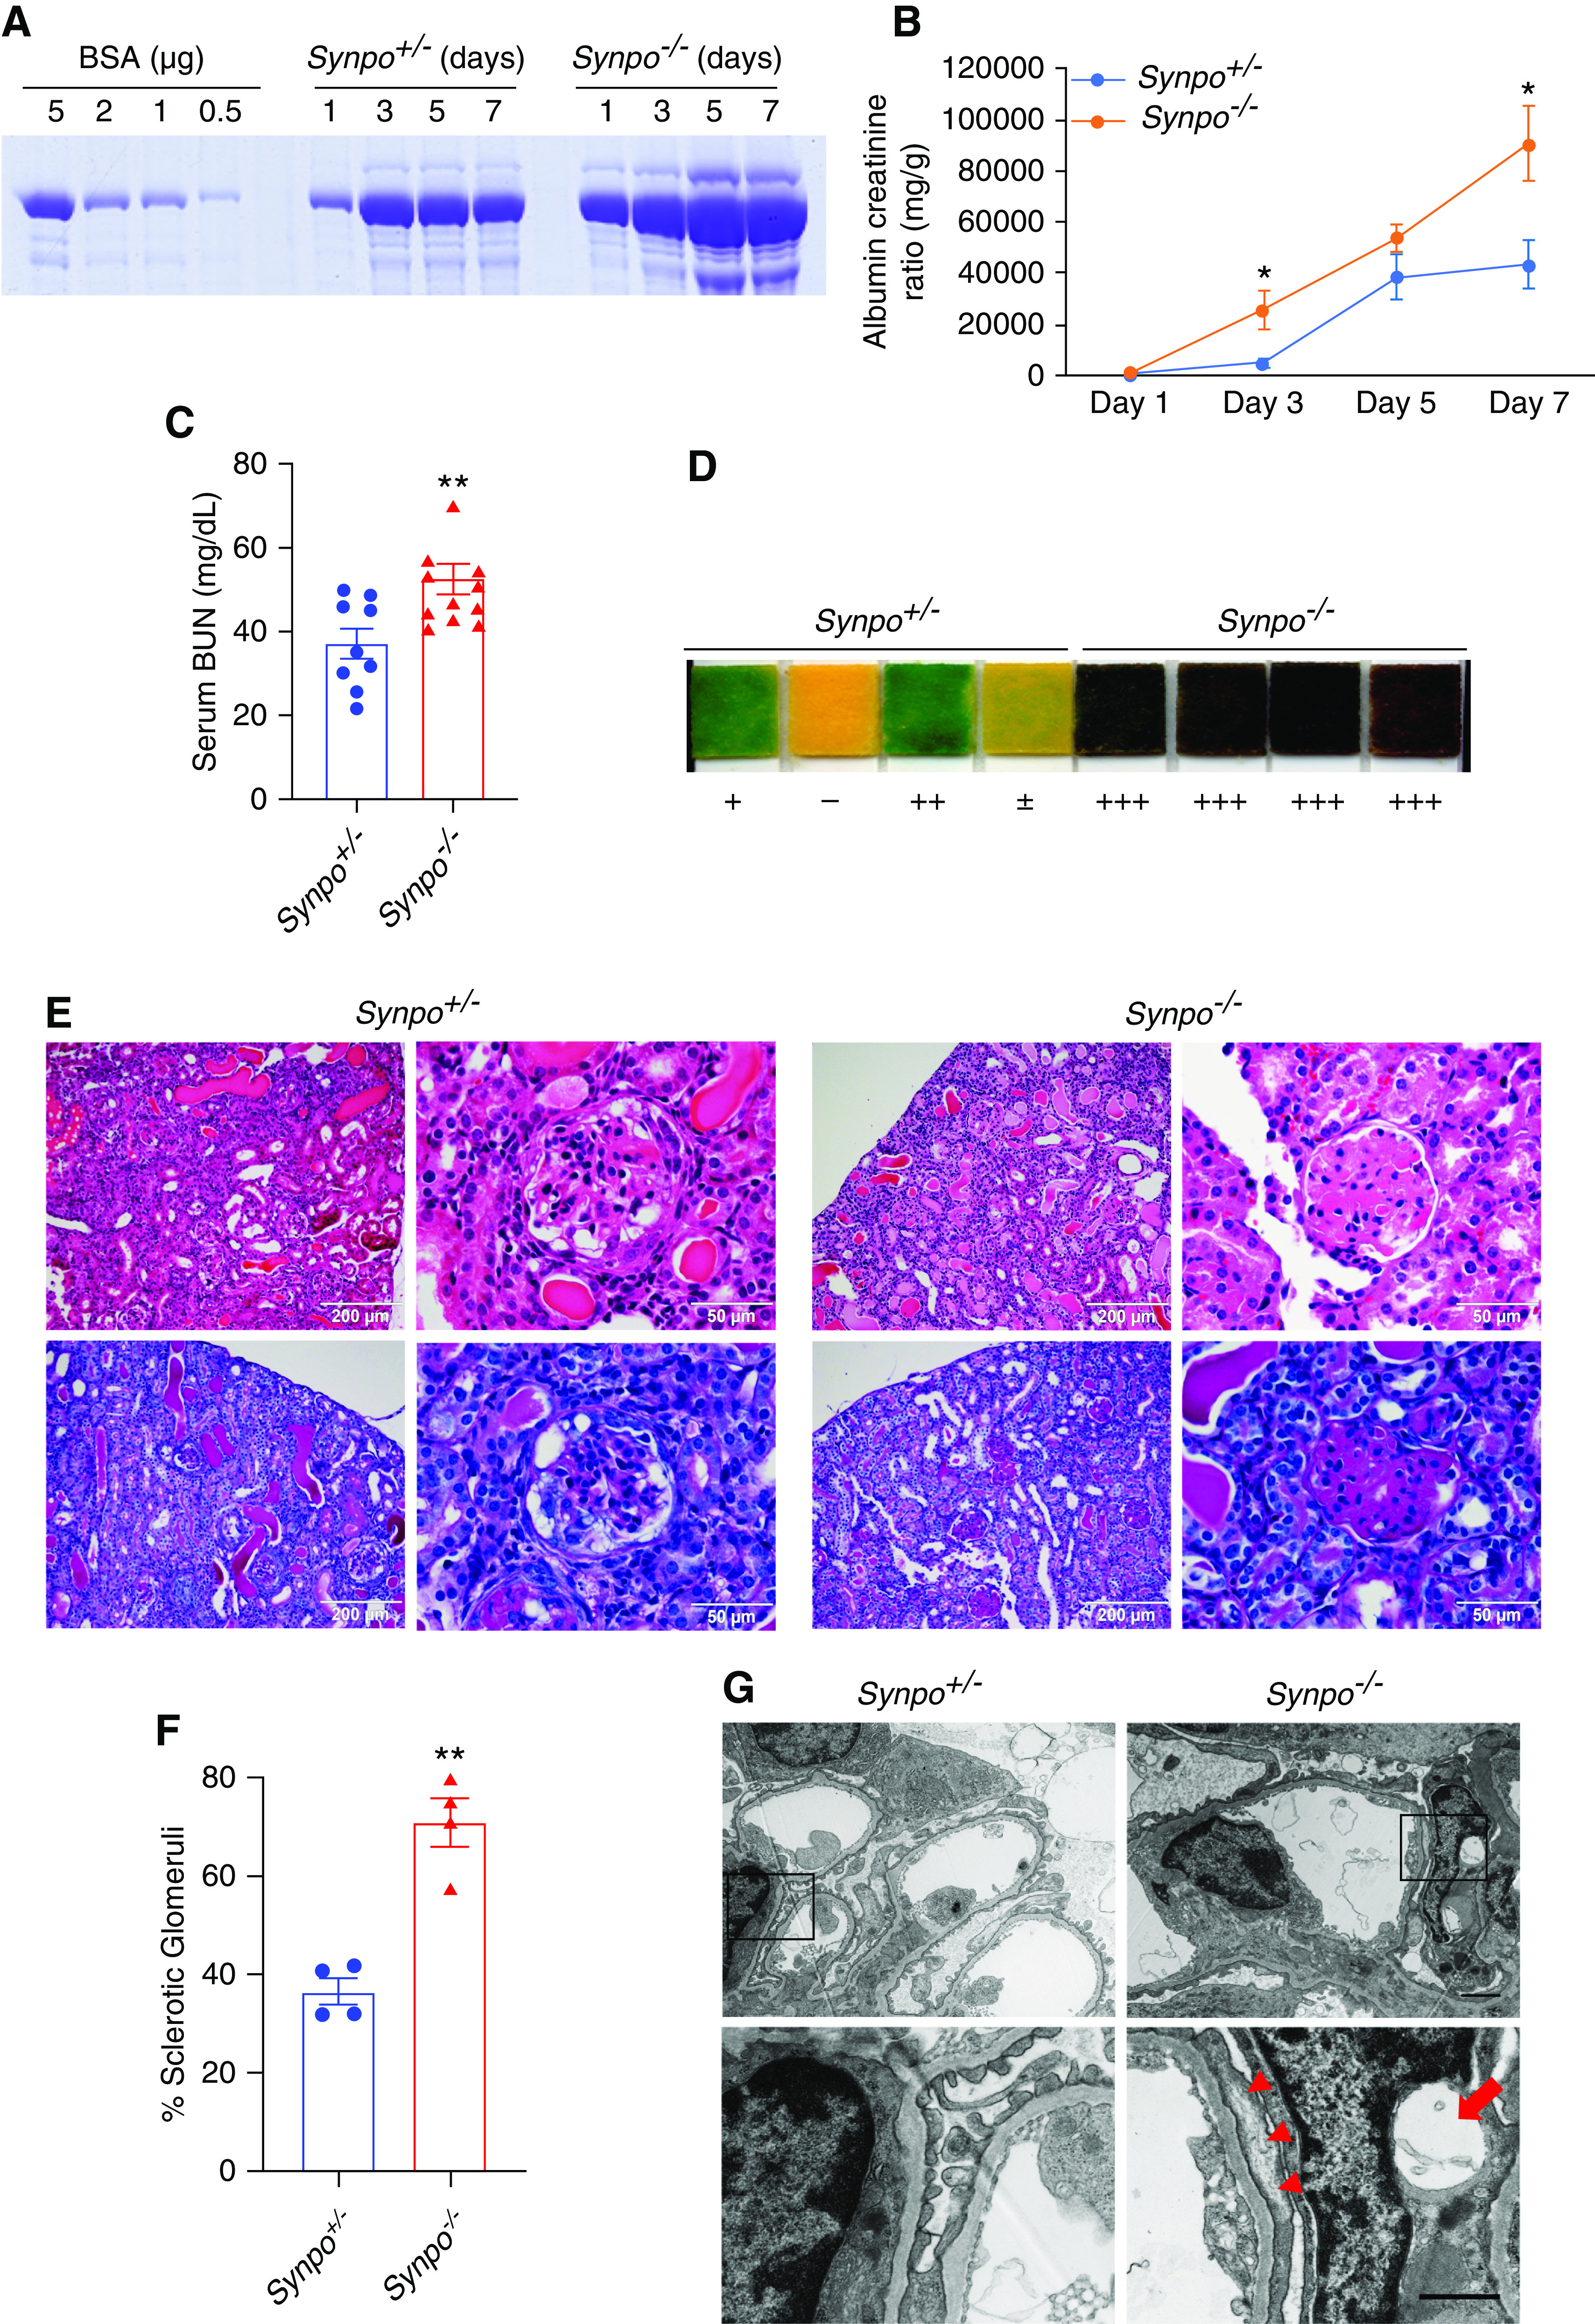
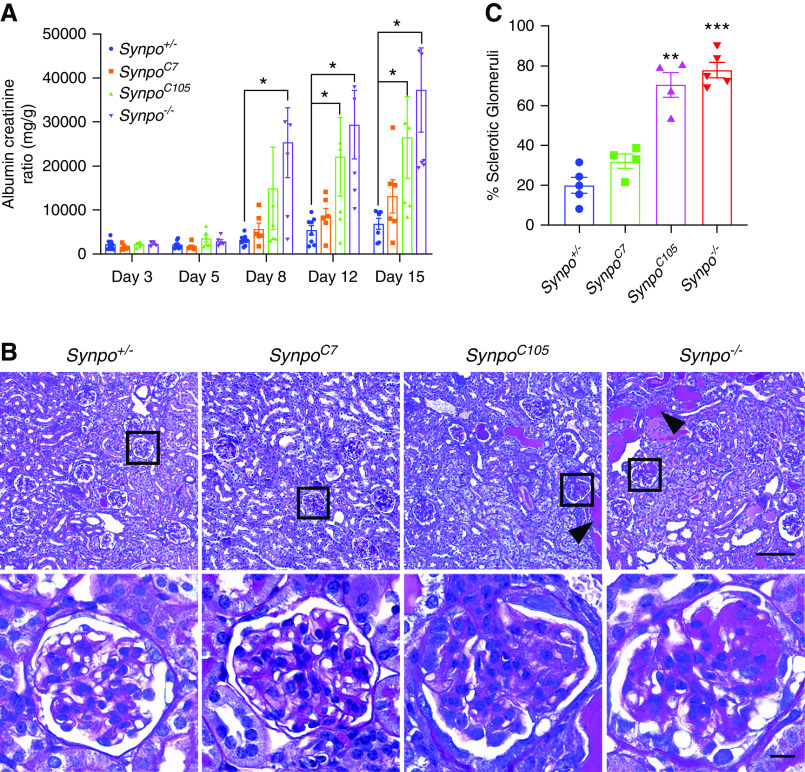
Methods: Novel mouse models were generated to further investigate the functions of Synpo. In one, CRISPR/Cas9 deleted most of the Synpo gene, preventing production of any detectable Synpo protein. Two other mutant strains made truncated versions of the protein. Adriamycin injections were used to challenge the mice, and Synpo functions were investigated in primary cultured podocytes.

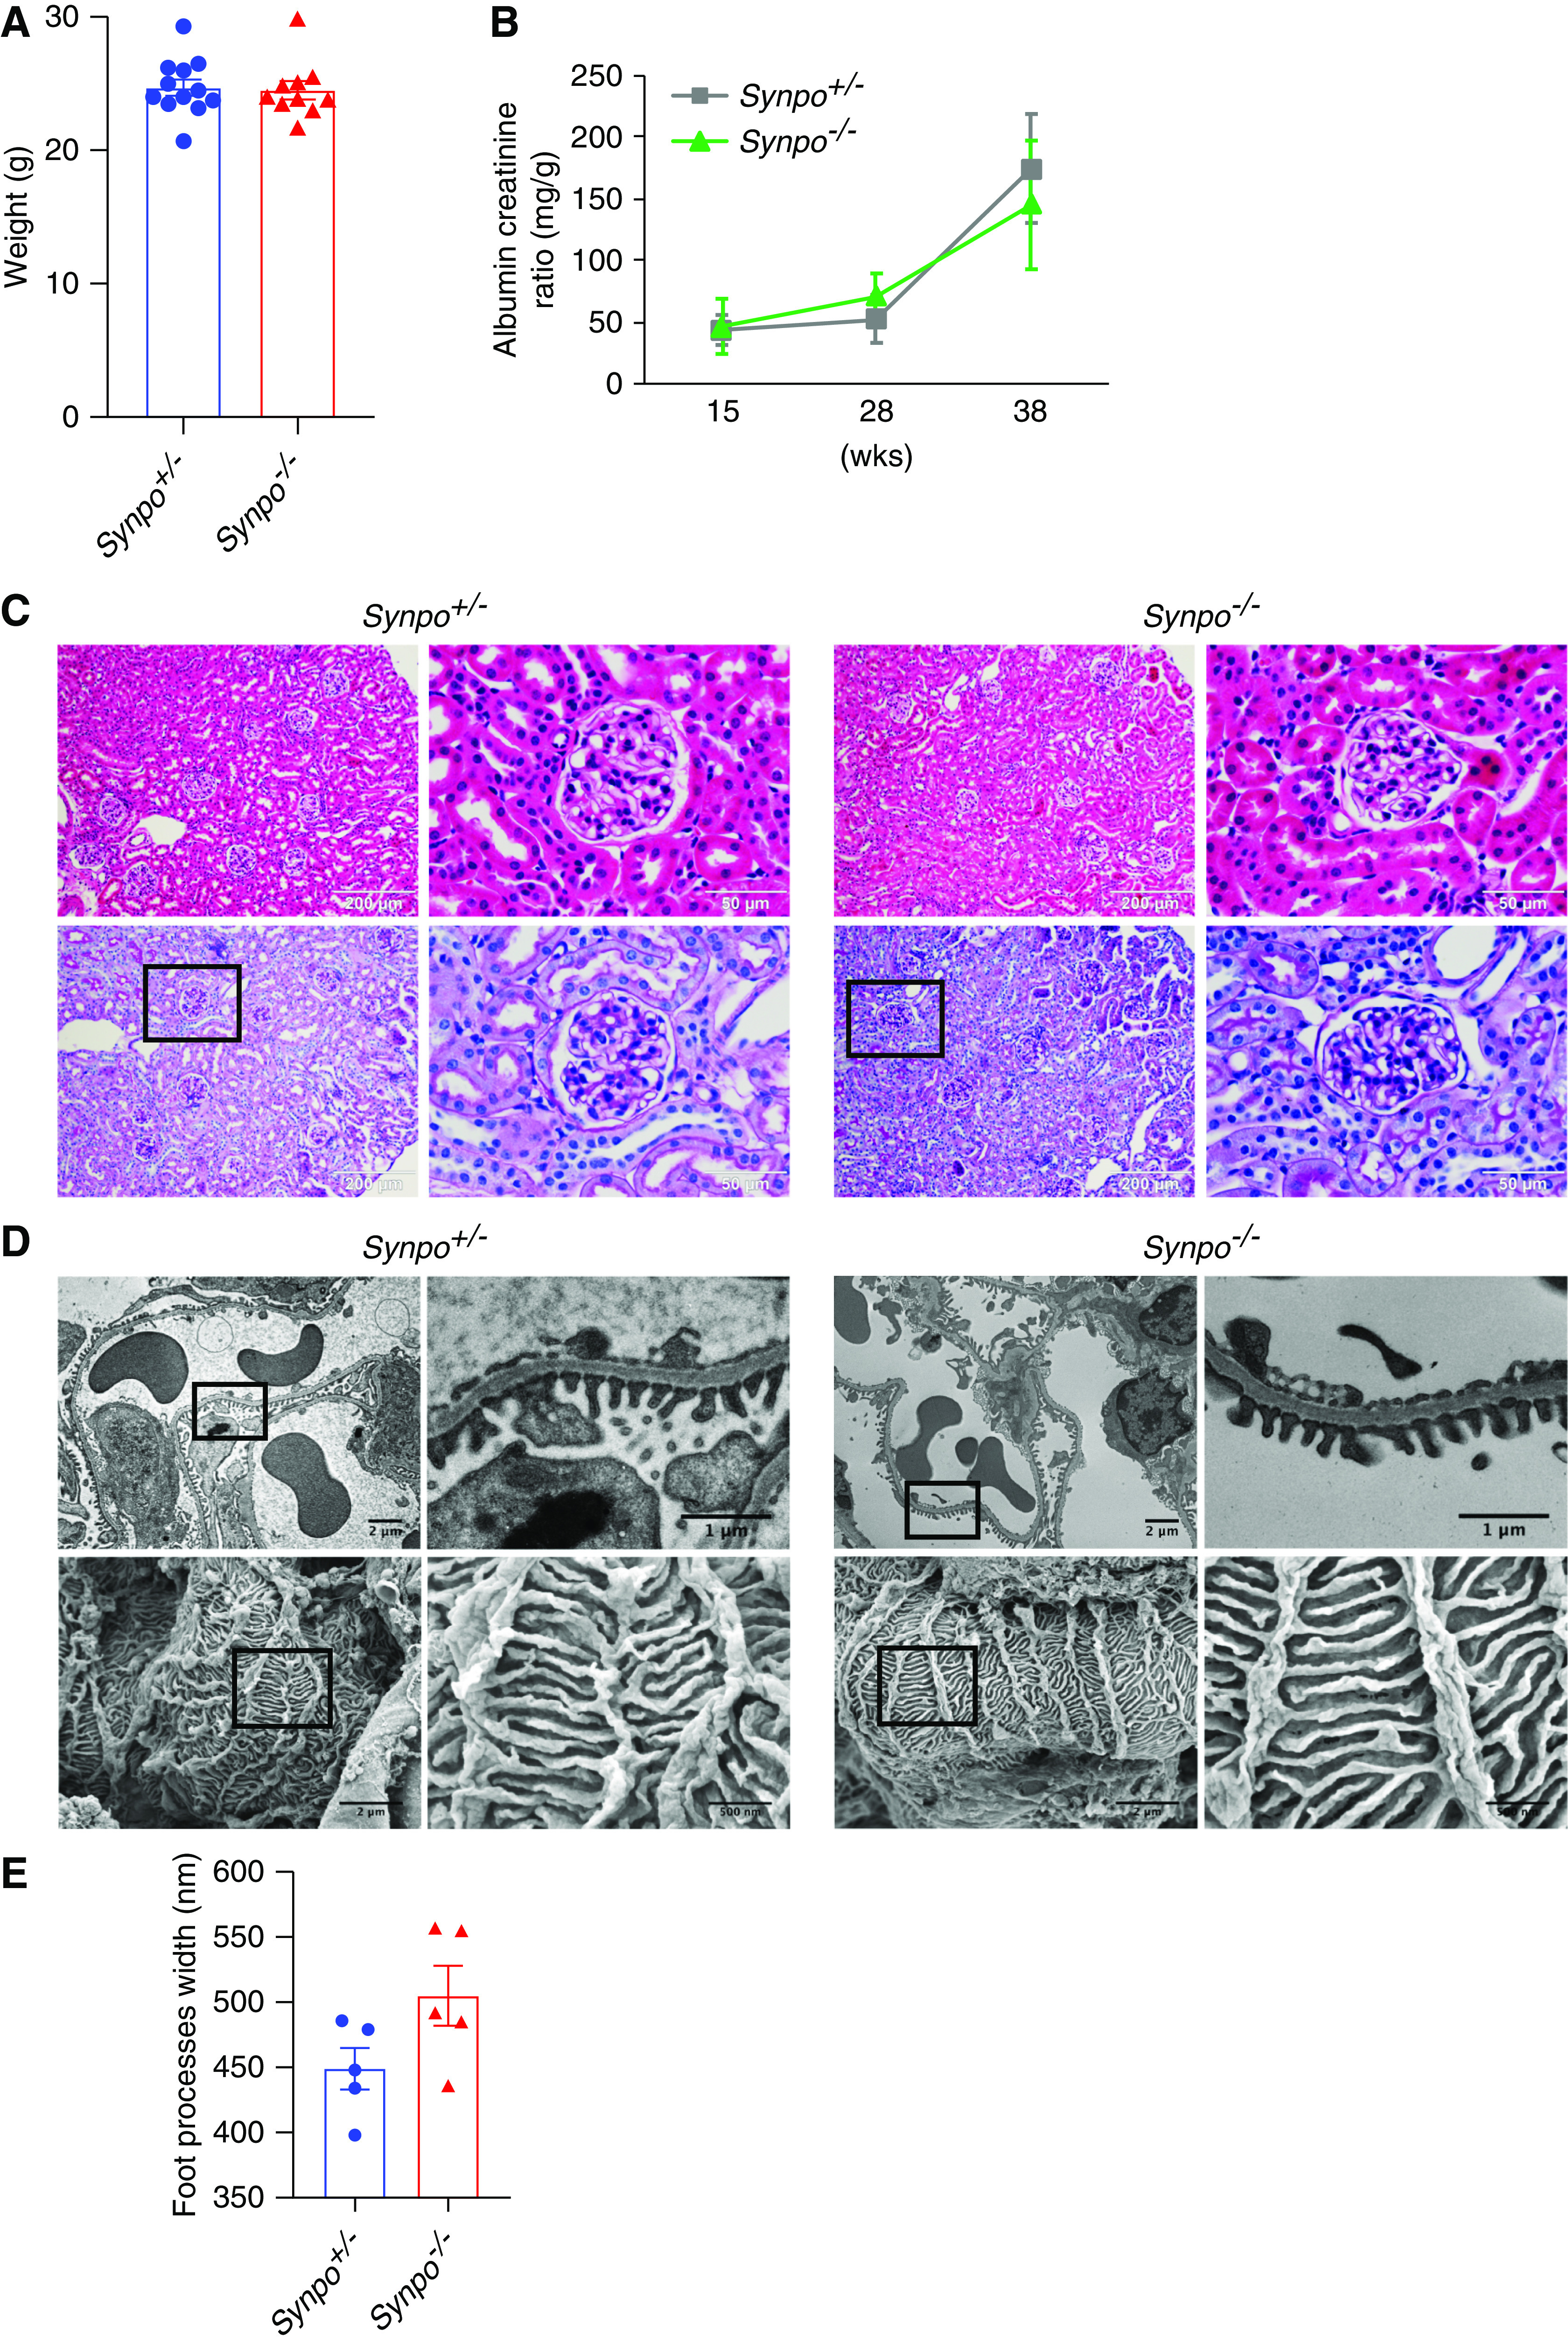
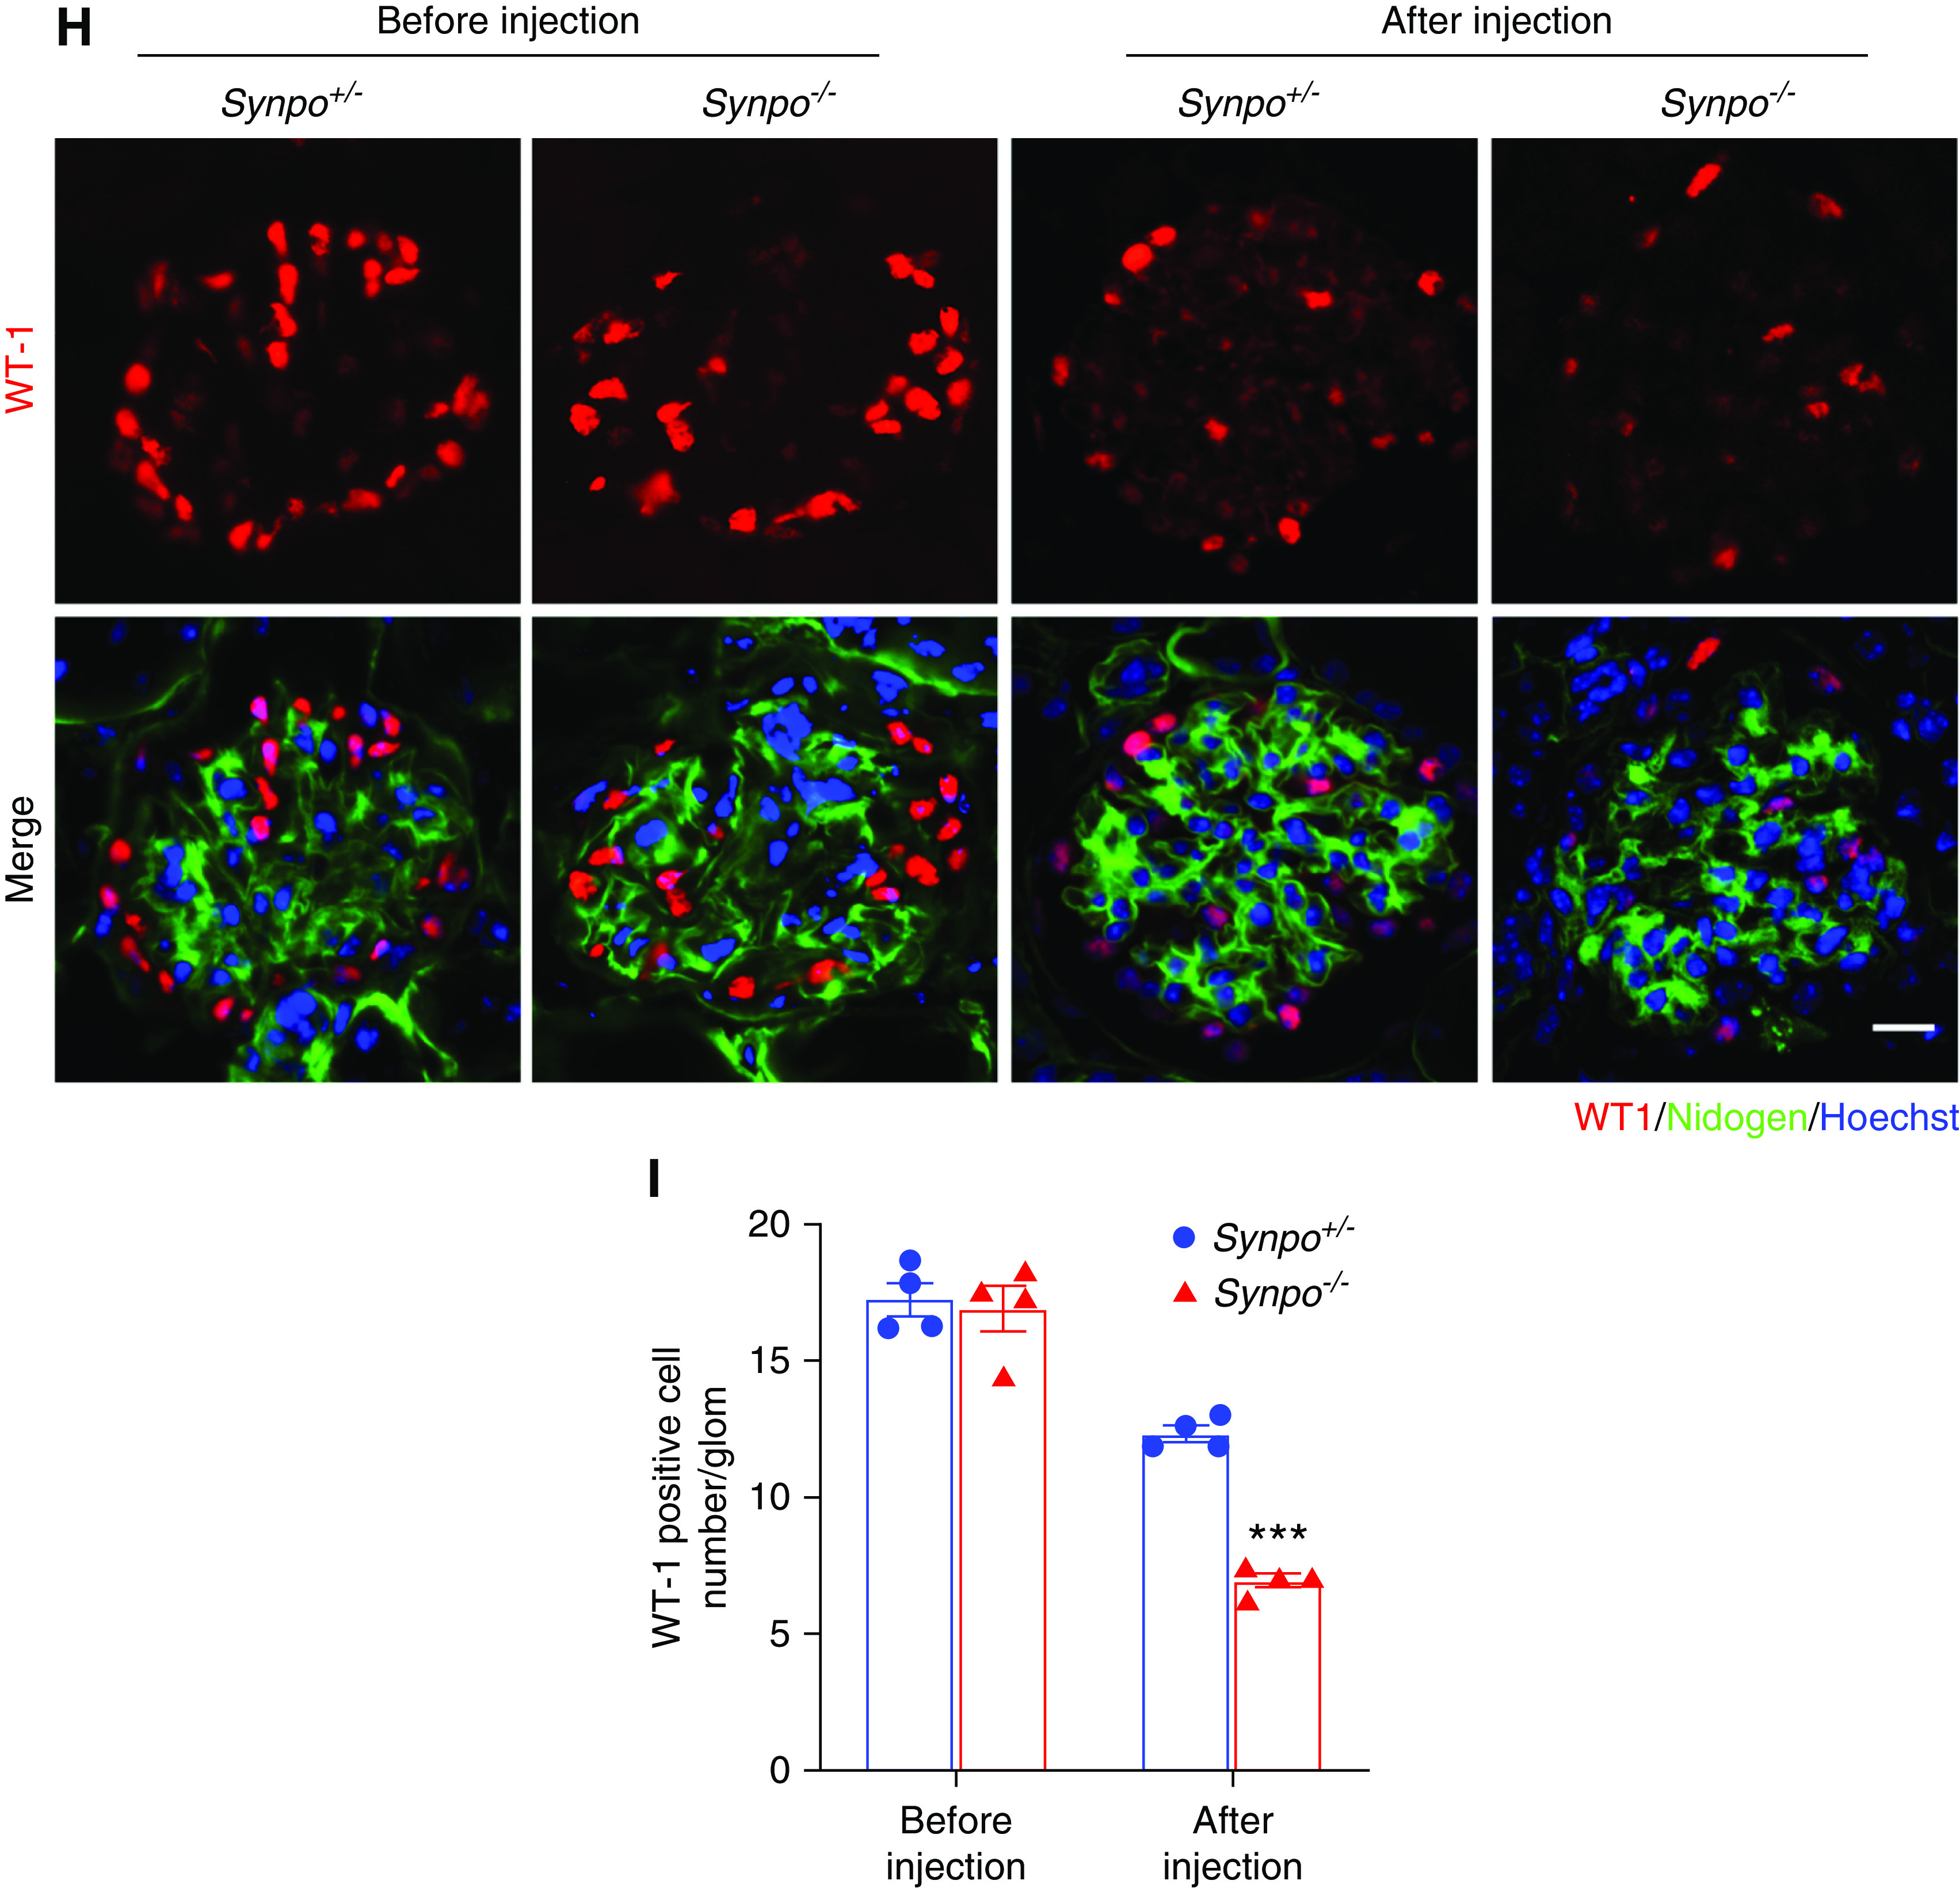
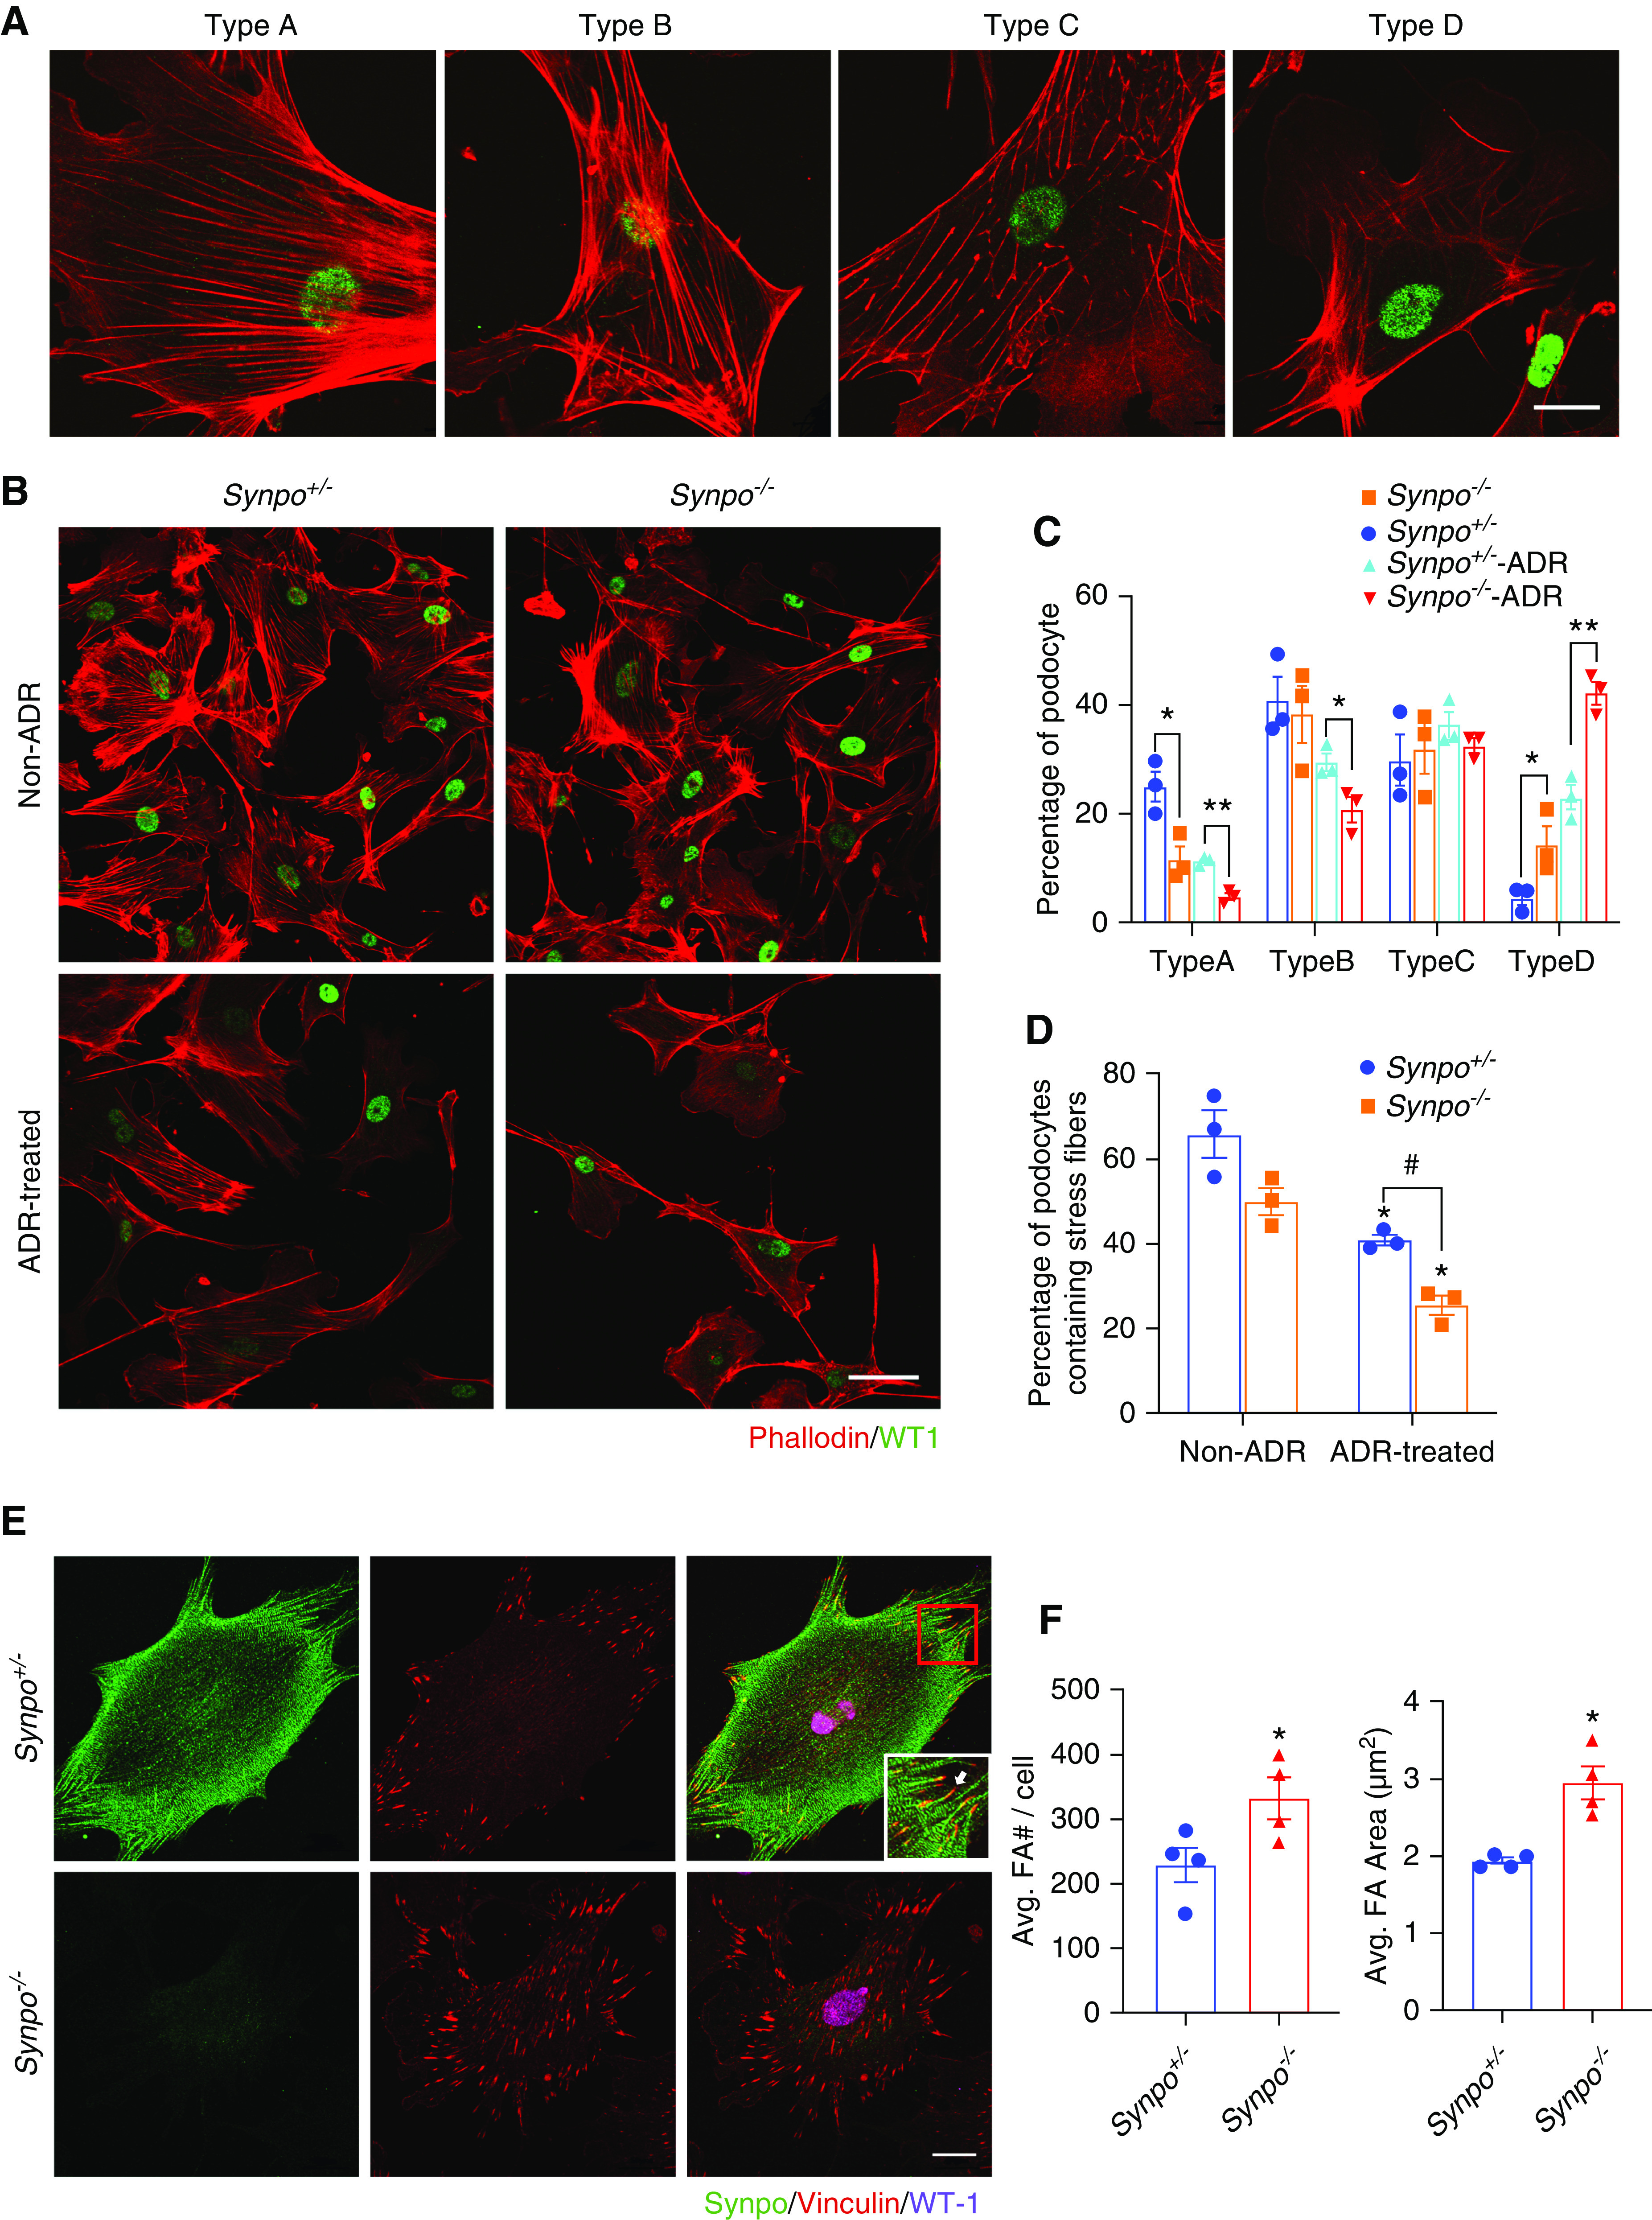
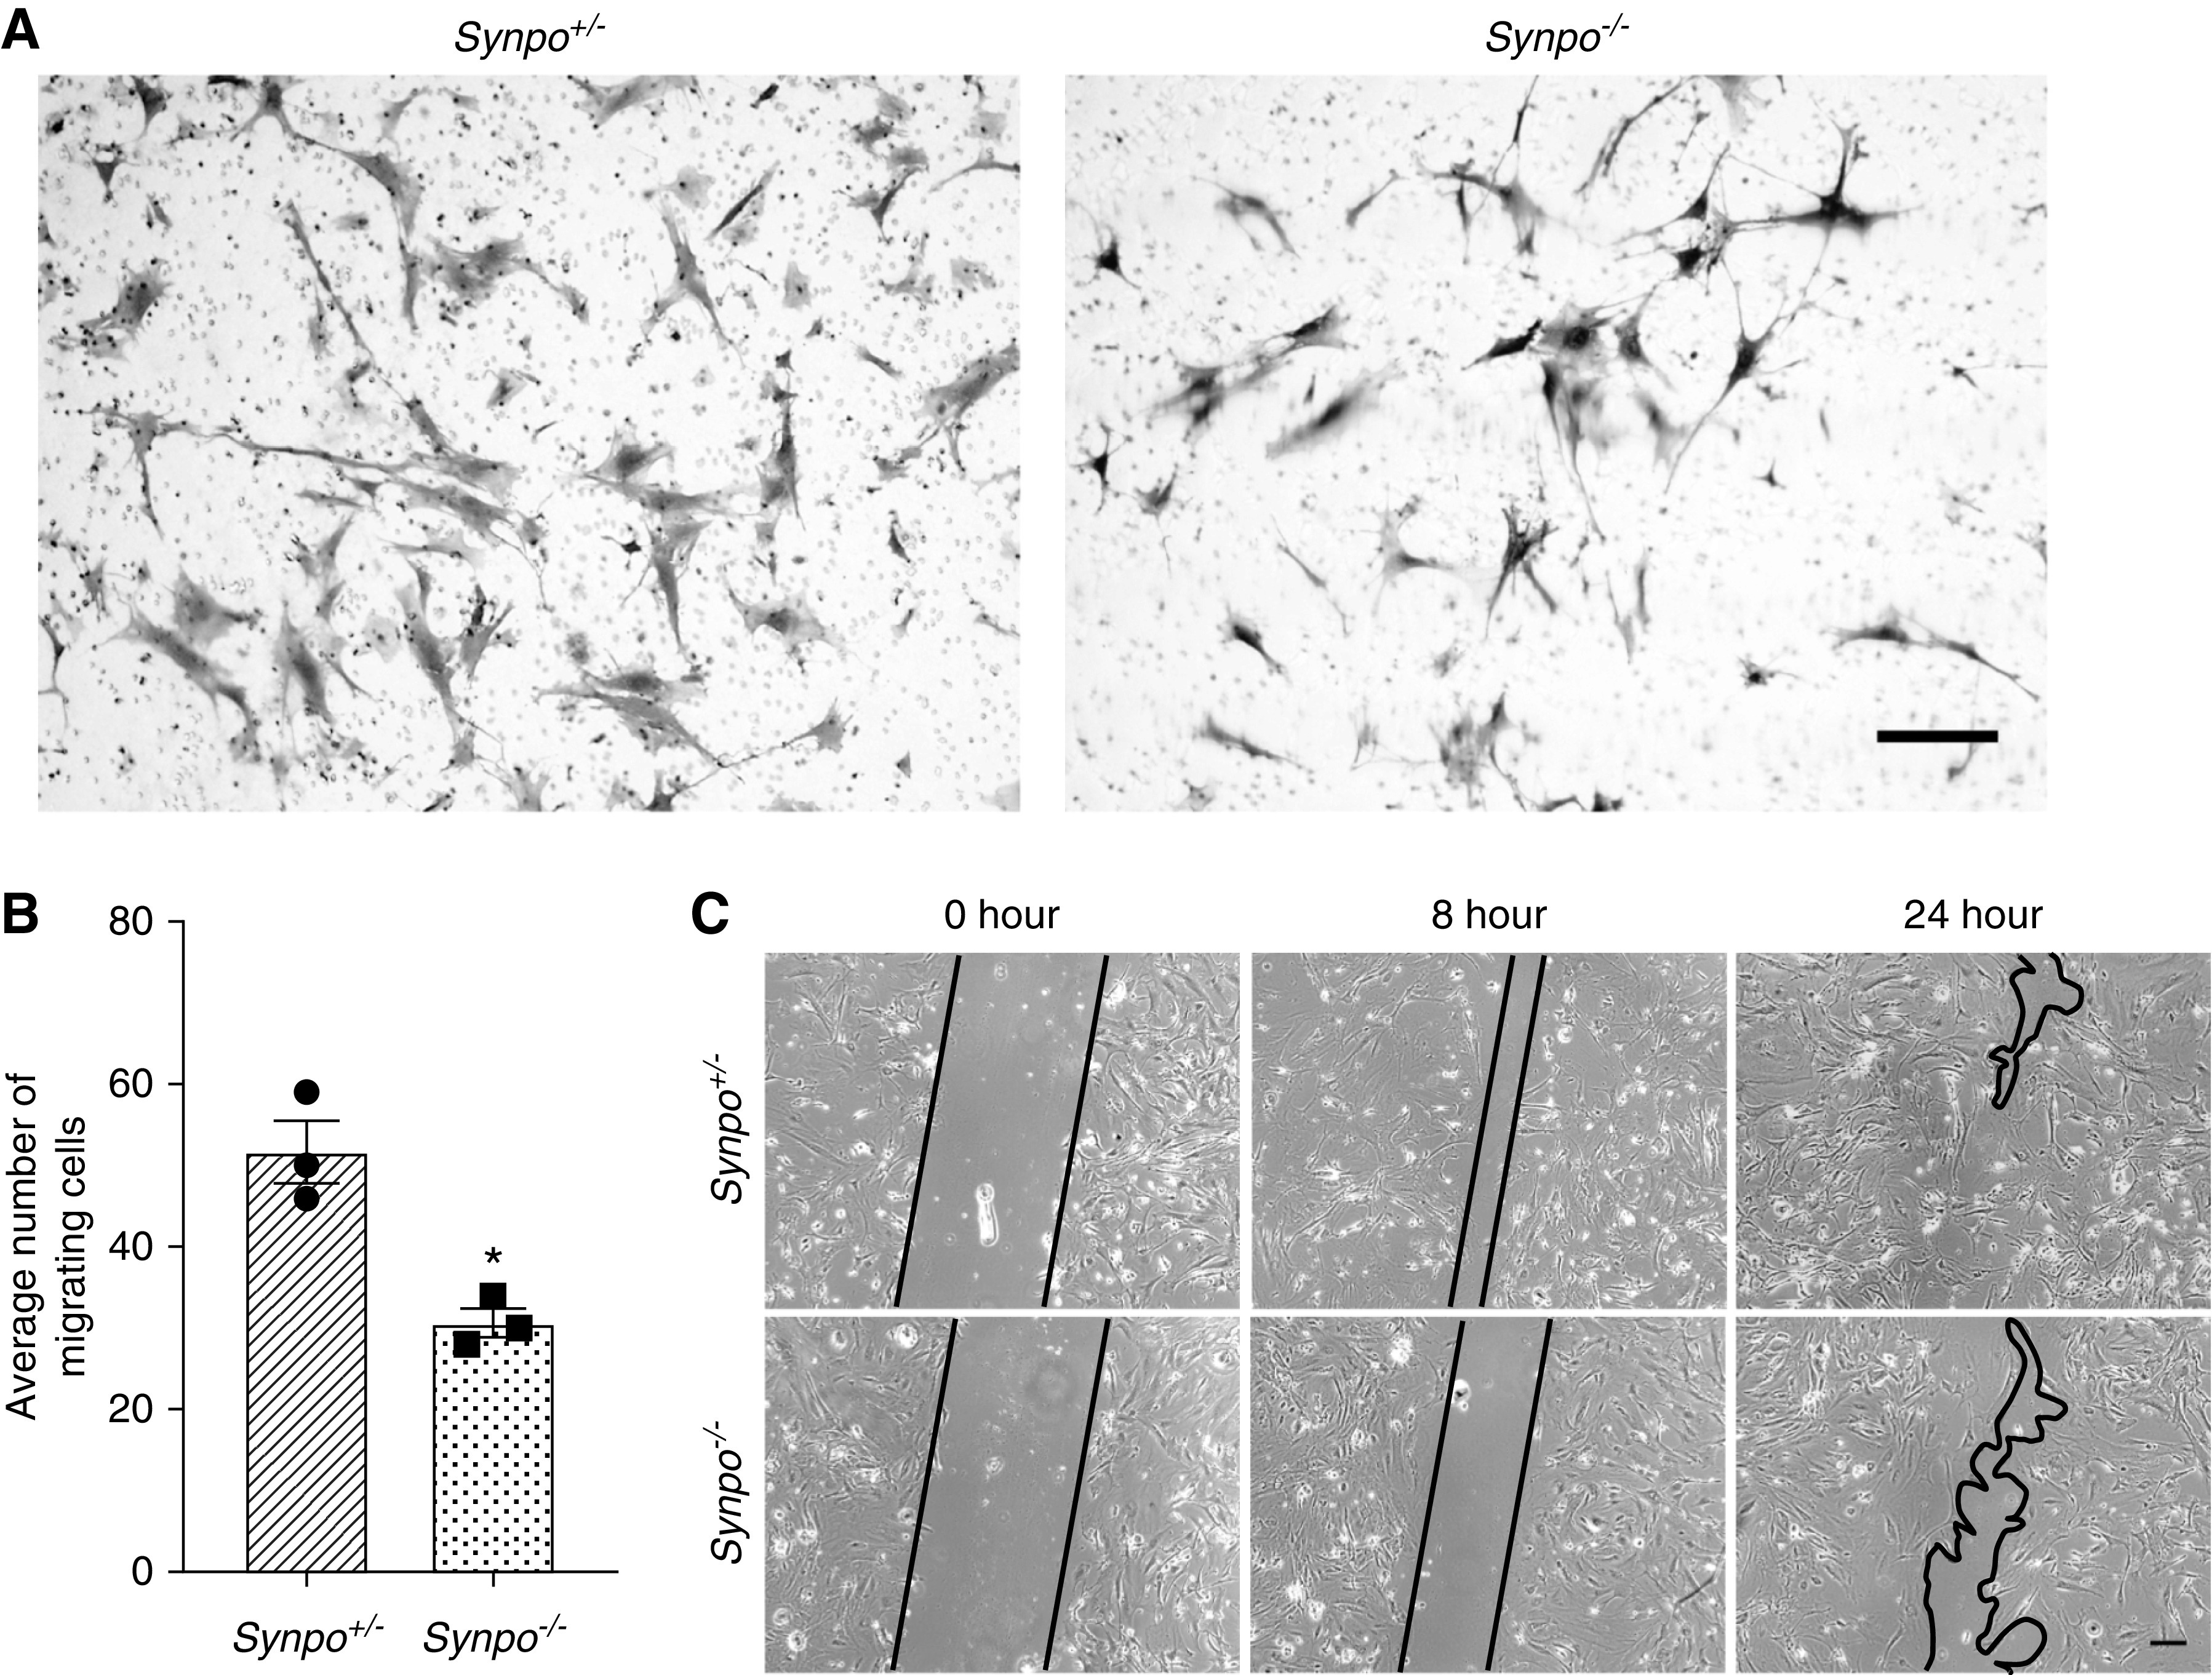
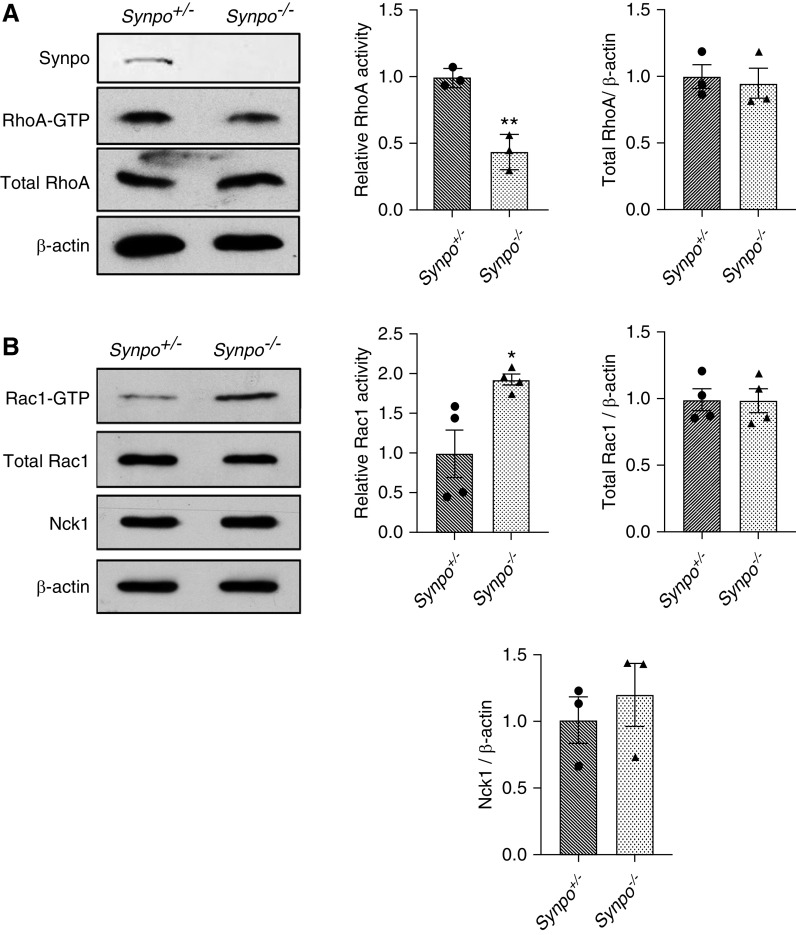
Results: Mice that could not make detectable Synpo (Synpo-/- ) did not develop any kidney abnormalities up to 12 months of age. However, Synpo-/- mice were more susceptible to Adriamycin nephropathy. In cultured primary podocytes from mutant mice, the absence of Synpo caused loss of stress fibers, increased the number and size of focal adhesions, and impaired cell migration. Furthermore, loss of Synpo led to decreased RhoA activity and increased Rac1 activation.

Conclusions: In contrast to previous findings, podocytes can function normally in vivo in the absence of any Synpo isoform. Synpo plays a protective role in the context of podocyte injury through its involvement in actin reorganization and focal adhesion dynamics.

Keywords: actin; cytoskeleton; glomerular filtration barrier; glomerulus podocyte.


Figures

None
Graphical abstract
Figure 1.
Figure 1.
Novel mutations in mouse Synpo result in absence or truncations of the protein. (A) Schematic illustration of Synpo genomic structure. Exon 2 (E2) and E3, the only coding exons, were targeted. The clustered regulatory interspaced short palindromic repeats (CRISPR) target sites and protospacer adjacent motifs (PAMs) are indicated. (B) Schematics of the wild-type Synpo isoforms and mutant forms expressed in the mice utilized in this study. The orange boxes show the 680 a.a. shared by Synpo-S and Synpo-L. The yellow boxes show a.a. that exist in Synpo-L. The purple boxes show out-of-frame a.a. in SynpoC7 and SynpoD8KA. The red diamonds indicate the “LPPPP” motif. The blue boxes show the a.a. specific to Synpo-S. The dotted line frames show the a.a. stretches missing in the mutants. The SynpoD8KA allele produced no detectable protein and is considered null (Synpo) in subsequent panels. (C) Synpo (green) was detected in podocytes of Synpo+/− but not Synpo−/− mice. Red indicates nidogen. Ca, capillary; Po, podocyte. Scale bar: 10 μm. (D) Expression of Synpo mutant proteins (or lack thereof) in glomeruli (glo) and brain (bra) was verified by western blotting with antibodies to the N and C termini of Synpo-L.
Figure 2.
Figure 2.
Synpo−/− mice exhbit no obvious defects in kidney or podocyte structure or function. (A) Quantification of body weights of Synpo+/− and Synpo−/− mice. n=10–12 mice. (B) Quantification of urinary ACRs at 15, 28, and 38 weeks of age. n=8 mice. (C) Hematoxylin and eosin and PAS staining of kidney sections shows normal glomeruli and tubules in both control and Synpo−/− mice at 36 weeks. (D) Electron microscopy (EM) reveals no FP effacement in control or Synpo−/− glomeruli. (Upper panel) Transmission EM. (Lower panel) Scanning EM. (E) Quantification of FP width in control and Synpo−/− mice at 36 weeks. n=5 mice. Data are presented as means ± SEM.
Figure 3.
Figure 3.
Synpo−/− mice treated with ADR exhibit increased proteinuria, hematuria, and glomerulosclerosis. (A) SDS-PAGE Coomassie blue staining of BSA standards and urine from Synpo+/− and Synpo−/− mice injected with ADR (8 mg/kg), demonstrating albuminuria at days 1, 3, 5, and 7 after injection; 1 μl of each urine was loaded. (B) Quantification of urinary ACRs at days 1, 3, 5, and 7 after ADR injection. n=7 mice per group. *P=0.05. (C) Elevated BUN in Synpo−/− mice at day 7 after ADR injection. n=9–11 mice per group. **P=0.01. (D) Hematuria dipstick assays 14 days after ADR injection. (E) Representative light microscopic images: (upper panel) hematoxylin and eosin and (lower panel) PAS of kidney sections. (F) Quantification of the percentage of sclerotic glomeruli. n=4 mice per group. **P=0.01. (G) Transmission electron micrographs illustrate more severe FP effacement in Synpo−/− mice 7 days after ADR injection. The arrowheads depict FP effacement, and the arrow depicts a podocyte vacuole. Scale bars: upper panel, 2 μm; lower panel, 1 μm. (H) Representative pictures of WT1-positive podocytes (red) before and 14 days after ADR injection. Sections were counterstained for nidogen (green) and DNA (blue). Scale bar: 10 μm. (I) Quantification of podocytes/glomerulus before and 14 days after ADR injection. The number of podocytes in Synpo−/− mice was significantly lower than that of Synpo+/− mice at day 14. Fifty glomeruli each in n=4 mice per group were analyzed. Data are presented as means ± SEM. ***P<0.001.
Figure 3.
Figure 3.
Synpo−/− mice treated with ADR exhibit increased proteinuria, hematuria, and glomerulosclerosis. (A) SDS-PAGE Coomassie blue staining of BSA standards and urine from Synpo+/− and Synpo−/− mice injected with ADR (8 mg/kg), demonstrating albuminuria at days 1, 3, 5, and 7 after injection; 1 μl of each urine was loaded. (B) Quantification of urinary ACRs at days 1, 3, 5, and 7 after ADR injection. n=7 mice per group. *P=0.05. (C) Elevated BUN in Synpo−/− mice at day 7 after ADR injection. n=9–11 mice per group. **P=0.01. (D) Hematuria dipstick assays 14 days after ADR injection. (E) Representative light microscopic images: (upper panel) hematoxylin and eosin and (lower panel) PAS of kidney sections. (F) Quantification of the percentage of sclerotic glomeruli. n=4 mice per group. **P=0.01. (G) Transmission electron micrographs illustrate more severe FP effacement in Synpo−/− mice 7 days after ADR injection. The arrowheads depict FP effacement, and the arrow depicts a podocyte vacuole. Scale bars: upper panel, 2 μm; lower panel, 1 μm. (H) Representative pictures of WT1-positive podocytes (red) before and 14 days after ADR injection. Sections were counterstained for nidogen (green) and DNA (blue). Scale bar: 10 μm. (I) Quantification of podocytes/glomerulus before and 14 days after ADR injection. The number of podocytes in Synpo−/− mice was significantly lower than that of Synpo+/− mice at day 14. Fifty glomeruli each in n=4 mice per group were analyzed. Data are presented as means ± SEM. ***P<0.001.
Figure 4.
Figure 4.
ADR causes increased proteinuria and glomerulosclerosis in SynpoC105 mice but not in SynpoC7 mice. (A) Bar graphs show urinary ACRs for Synpo+/−, SynpoC7, SynpoC105, and Synpo−/− mice at the indicated days after ADR injection. n=4–10 mice per group. *P=0.05. (B) Representative images of renal histology by PAS staining in Synpo+/−, SynpoC7, SynpoC105, and Synpo−/− mice 15 days after ADR injection. Scale bars: upper panel, 100 μm; lower panel, 10 μm. (C) Quantification as percentage of sclerotic glomeruli. n=4–5 mice per group. Data are presented as means ± SEM. **P=0.01; ***P<0.001.
Figure 5.
Figure 5.
Synpo deficiency affects stress fibers and FA number and size. (A) Representative confocal images of the different phalloidin staining patterns observed in isolated Synpo+/− (control) podocytes. Type A: >90% of cell area filled with thick cables; type B: at least two thick cables running under the nucleus, with the rest of the cell area filled with fine cables; type C: no thick cables but some cables present; and type D: no cables visible in the central area of the cell. Scale bar: 20 μm. (B) Representative confocal images of podocytes stained with phalloidin and WT1 before and after ADR treatment. Scale bar: 50 μm. (C) Quantification of phalloidin staining without and with ADR treatment. Synpo−/− podocytes had fewer cells with the type A pattern and more with the type D pattern when compared with Synpo+/− podocytes at baseline. ADR-treated Synpo−/− podocytes had fewer cells with type A and type B staining patterns and more with the type D pattern. n=3 independent primary podocyte isolations per genotype; at least 60 cells from each group were analyzed. *P=0.05; **P=0.01. (D) Quantification of stress fiber–containing podocytes without and with ADR treatment for 24 hours. n=3 independent primary podocyte isolations per genotype; at least 60 cells from each group were analyzed. *P=0.05 versus non-ADR; #P=0.01 versus the relevant Synpo+/− group. (E) Representative images of podocytes stained for Synpo, vinculin, and WT1. Scale bar: 20 μm. Inset shows that the FA contains Synpo, but Synpo is absent from the very end (arrow). (F) Quantification of number and area of FAs in podocytes. Synpo−/− podocytes had more and larger FAs. n=4 independent primary podocyte isolations per genotype; 40 cells from each isolation were analyzed. Data are presented as means ± SEM. *P=0.05.
Figure 6.
Figure 6.
Synpo mutations induce mislocalization and decreased expression of α-actinin-4. (A) Representative confocal images of podocytes isolated from the indicated mice. Cells were stained for Synpo (green), α-actinin-4 (red), and phalloidin (gray). Arrowheads point to Synpo and α-actinin-4 colocalized in stress fibers in both Synpo+/− and SynpoC7 podocytes. In SynpoC105 podocytes, Synpo and α-actinin-4 were colocalized but appeared shortened, discontinuous, or absent in some thick or fine cables. Scale bar: 10 μm. (B) Quantification of phalloidin staining in podocytes isolated from Synpo+/−, SynpoC7, SynpoC105, and Synpo−/− mice. Synpo−/− and SynpoC105 podocytes had fewer cells with the type A pattern and more with the type D pattern when compared with Synpo+/− podocytes at baseline. n=3 independent primary podocyte isolations per genotype; at least 60 cells from each group were analyzed. *P=0.05; **P=0.01.
Figure 7.
Figure 7.
Synpo deficiency impairs the migration of primary podocytes. (A) Representative images of transwell migration assays. Scale bar: 10 μm. (B) Quantification of transwell assays shows Synpo−/− podocytes displayed reduced migration. n=3 independent primary podocyte isolations per group. Data are presented as means ± SEM. *P=0.01. (C) Scrape wound assays were performed to study the migration of podocytes over 24 hours. Images show different time points (0, 8, and 24 hours). The gap between the migrating areas is marked by black lines and revealed that Synpo−/− cells migrated more slowly into the gap than Synpo+/− cells. Scale bar: 50 μm.
Figure 8.
Figure 8.
Synpo−/− podocytes have reduced active RhoA and increased active Rac1. GTP-bound (active) and total RhoA and Rac1 levels were quantified and are presented as the ratio of RhoA-GTP to Rac1-GTP levels divided by the corresponding total RhoA to Rac1 levels relative to that of control cells. (A) RhoA pull downs from Synpo+/− and Synpo−/− podocytes show similar levels of total RhoA but decreased active RhoA in the mutant. (B) Rac1 pull downs and assay of Nck1 levels in Synpo+/− and Synpo−/− podocytes. Total Rac1 levels were similar in control and mutant podocytes, but active Rac1 was increased in the mutant. The level of Nck1 was unchanged. n=3–4 independent primary podocyte isolations per genotype. Data are presented as means ± SEM. *P=0.05; **P=0.01.

References

    1. Suleiman HY, Roth R, Jain S, Heuser JE, Shaw AS, Miner JH: Injury-induced actin cytoskeleton reorganization in podocytes revealed by super-resolution microscopy. JCI Insight 2: e94137, 2017. - PMC - PubMed
    1. Suh JH, Miner JH: The glomerular basement membrane as a barrier to albumin. Nat Rev Nephrol 9: 470–477, 2013. - PMC - PubMed
    1. Greka A, Mundel P: Cell biology and pathology of podocytes. Annu Rev Physiol 74: 299–323, 2012. - PMC - PubMed
    1. Kaplan JM, Kim SH, North KN, Rennke H, Correia LA, Tong HQ, et al. .: Mutations in ACTN4, encoding alpha-actinin-4, cause familial focal segmental glomerulosclerosis. Nat Genet 24: 251–256, 2000. - PubMed
    1. Kestilä M, Lenkkeri U, Männikkö M, Lamerdin J, McCready P, Putaala H, et al. .: Positionally cloned gene for a novel glomerular protein--nephrin--is mutated in congenital nephrotic syndrome. Mol Cell 1: 575–582, 1998. - PubMed

Publication types

Substances