. 2020 Oct 15;205(8):2026-2038.
doi: 10.4049/jimmunol.2000114. Epub 2020 Sep 16.

T Cells from NOD- PerIg Mice Target Both Pancreatic and Neuronal Tissue

Affiliations

T Cells from NOD- PerIg Mice Target Both Pancreatic and Neuronal Tissue

Jeremy J Racine et al. J Immunol. .

Abstract

It has become increasingly appreciated that autoimmune responses against neuronal components play an important role in type 1 diabetes (T1D) pathogenesis. In fact, a large proportion of islet-infiltrating B lymphocytes in the NOD mouse model of T1D produce Abs directed against the neuronal type III intermediate filament protein peripherin. NOD-PerIg mice are a previously developed BCR-transgenic model in which virtually all B lymphocytes express the H and L chain Ig molecules from the intra-islet-derived anti-peripherin-reactive hybridoma H280. NOD-PerIg mice have accelerated T1D development, and PerIg B lymphocytes actively proliferate within islets and expand cognitively interactive pathogenic T cells from a pool of naive precursors. We now report adoptively transferred T cells or whole splenocytes from NOD-PerIg mice expectedly induce T1D in NOD.scid recipients but, depending on the kinetics of disease development, can also elicit a peripheral neuritis (with secondary myositis). This neuritis was predominantly composed of CD4+ and CD8+ T cells. Ab depletion studies showed neuritis still developed in the absence of NOD-PerIg CD8+ T cells but required CD4+ T cells. Surprisingly, sciatic nerve-infiltrating CD4+ cells had an expansion of IFN-γ- and TNF-α- double-negative cells compared with those within both islets and spleen. Nerve and islet-infiltrating CD4+ T cells also differed by expression patterns of CD95, PD-1, and Tim-3. Further studies found transitory early B lymphocyte depletion delayed T1D onset in a portion of NOD-PerIg mice, allowing them to survive long enough to develop neuritis outside of the transfer setting. Together, this study presents a new model of peripherin-reactive B lymphocyte-dependent autoimmune neuritis.


Figures

Figure 1 –
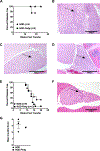
Figure 1 –. NOD-PerIg T-cells transfer diabetes as well as neuritis into NOD.scid recipients.
(A) Diabetes incidence from Cohort 1 NOD.scid recipients receiving 1×10⁶ enriched T-cells from 5-week-old NOD or NOD-PerIg donors. Selected mice from Cohort 1 were sent to necropsy for analysis of hind limbs, brain, and spine after hind limb weakness was observed. (B) Representative histology displaying signs of neuritis in a peripheral nerve of the hind limb (Scale bar 200 μm). (C) Representative showing one cranial nerve (Scale bar 500 μm) which showed signs of infiltration. (D) Representative spinal nerve with signs of infiltration (Scale bar 500 μm). In B-D black arrows designate representative area of infiltration in affected tissue. (E) Diabetes incidence in Cohort 2 NOD.scid recipients of 1×10⁶ enriched T-cells from 7-week-old NOD or NOD-PerIg donors. (F) Representative image of hind limb peripheral nerve neuritis in a Cohort 2 recipient of NOD-PerIg T-cells (Scale bar 200 μm). (G) Quantification of mean insulitis scores for non-diabetic mice at 20 weeks post transfer comparing recipients of NOD or NOD-PerIg T-cells.
Figure 2 –
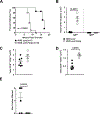
Figure 2 –. NOD-PerIg whole splenocytes transfers neuritis into NOD.scid but not NOD.scid-PerIg recipients.
Whole splenocytes (normalized to contain 1×10⁶ T-cells) from 4–6-week-old NOD-PerIg mice were transferred into NOD.scid or NOD.scid-PerIg recipients. (A) T1D incidence in NOD.scid and NOD.scid-PerIg recipients. (B) Quantification of yield of transgenic IgMa+ or non-transgenic IgMb+ CD19+ B-cells in the spleens of NOD.scid and NOD.scid-PerIg recipients (NOD.scid n=7, NOD.scid-PerIg n=4). (C) Yield of CD8+ TCRβ+ cells in the spleens of NOD.scid and NOD.scid-PerIg recipients (NOD.scid n=7, NOD.scid-PerIg n=4). (D) Yield of CD4+ TCRβ+ cells in the spleens of NOD.scid and NOD.scid-PerIg recipients (NOD.scid n=7, NOD.scid-PerIg n=4). (E) Number of hind limbs displaying signs of neuritis (NOD.scid n=7, NOD.scid-PerIg n=10).
Figure 3 –
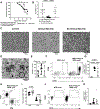
Figure 3 –. Nerve damage and immune cell infiltration
Whole splenocytes (normalized to contain 1×10⁶ T-cells) from 4–6-week-old NOD-PerIg mice were injected i.v. into NOD.scid recipients. (A) Mice were monitored weekly for T1D and/or neuritis development out to 21 weeks post-transfer. At study initiation 23 recipients of NOD-PerIg splenocytes were subsequently monitored for T1D/neuritis development. Any recipients developing T1D were removed from the study. Controls consisted of 8 NOD.scid mice. Mice from this cohort, in addition to surviving mice from the behavioral studies were analyzed for nerve damage (B, C) and immune cell infiltration (D-J). Mice from this cohort that developed T1D prior to 15 weeks post transfer were only subjected to immune cell infiltration analyses. (B) Quantification of hip compound muscle action potential (CMAP) comparing age-matched controls (unmanipulated or PBS-injected controls from behavioral cohort) to recipients of NOD-PerIg splenocytes. Mice with no detectable electromyography amplitudes have CMAP values of 0mV. (C) 40x images of sciatic nerves comparing age-matched controls (left) to recipients of NOD-PerIg splenocytes with clinical symptoms of neuritis (center) or no-disease symptoms (right). (D) 100x image of a sciatic nerve of a mouse with clinical symptoms of neuritis showing various indicators of pathology. Arrows: demyelinated axons; Squares: myelin ovoids; Circle: onion bulb. (E) Quantification of gated live cells showing percentage of leukocytes (CD45.1+) within sciatic nerves. (F and G) Representative flow cytometry plot (F) and quantification (G) showing the percentage of TCRβ+ CD90+ T-cells amongst CD45.1+ cells within sciatic nerves. (H and I) Representative flow cytometry plots (H) and quantification (I) of gated T-cells showing percentage of CD4+ vs CD8+ T-cells within sciatic nerves. (J and K) Representative flow cytometry plots (J) and quantification (K) of gated leukocytes (CD45.1+) showing B220+ CD19+ B-lymphocytes.
Figure 4 –
Figure 4 –. CD8+ and CD4+ T-cell depletion prevents T1D but only CD4+ depletion prevents neuritis development.
Whole splenocytes from 6-week-old NOD-PerIg donors (normalized to contain 1×10⁶ T-cells) were injected i.v. into NOD.scid recipients. One group of recipients were then injected i.p. every three weeks with PBS or 250μg anti-CD8. Another group was injected i.p. once a week for four weeks, followed by once every two weeks with either PBS or 250μg anti-CD4. (A) T1D incidence in NOD.scid recipients of NOD-PerIg splenocytes subsequently treated with PBS (both cohorts combined), anti-CD8, or anti-CD4 treated groups. (B) Mean insulitis scores for non-diabetic survivors (n=10 PBS, n=13 anti-CD8, n=13 anti-CD4). (C) Quantification of neuritis severity. Each dot represents a mouse with a pathology finding of Severe, Moderate, Minimal, or No Visible Lesion (NVL) in hind leg pathology samples (n=24 PBS, n=13 anti-CD8, n=13 anti-CD4). To display Mean±SEM, data was entered in Prism as Severe = 3, Moderate = 2, Minimal = 1, NVL = 0, although the y-axis displays the pathologist’s description. For the anti-CD4 group, 4 mice had some sporadically spaced, non-clustered lymphocytes, technically indicating infiltration (since these are NOD.scid recipients). This infiltration, however was closer in appearance to NVL than Minimal, but could not fully be classified as being free of lymphocyte infiltration. Therefore, for purposes of plotting, they were given a score of 0.25 to indicate that they were not free of infiltration, but were closer to NVL than the representative Minimal seen in E. (D) Quantification of myositis severity. Each dot represents a mouse with a finding of myositis, minimal myositis or no myositis (n=24 PBS, n=13 anti-CD8, n=13 anti-CD4). To display Mean±SEM, data was entered in Prism as Myositis = 2, Minimal Myositis = 1, No Myositis = 0, although the y-axis displays the pathologist’s description. (E) Representative histology showing neuritis at NVL, Minimal, and Severe levels (Scale bar 200 μm). Black arrows designate representative area of infiltration in affected tissue. (F) Histology showing myositis at NVL, Minimal, and Severe levels (Scale bar 200 μm). For Myositis, the most extreme case is shown. Black arrows designate a representative area of infiltration within affected tissue. (G) Quantification of CD4+ T-cells in recipient spleens. (H) Quantification of CD8+ T-cells in recipient spleens. (I) Quantification of CD19+ B-lymphocytes in recipient spleens.
Figure 5 –
Figure 5 –. Islet and sciatic nerve infiltrating CD4+ T-cells are highly activated
NOD.scid mice were injected with whole splenocytes (normalized to contain 1×10⁶ T-cells) from 4–6-week-old NOD-PerIg mice. Mice were monitored weekly for T1D and neuritis development. Upon diabetes or neuritis development, mice were removed from incidence and spleen and sciatic nerve-infiltrating CD4+ T-cells were examined for cytokine production and surface marker phenotype by flow cytometry. For non-diabetic mice, islet-infiltrating CD4+ T-cells were also analyzed. (A) T1D or neuritis incidence in NOD.scid recipients of NOD-PerIg splenocytes (n=38 from three separate cohorts). (B) Representative staining pattern of IFN-γ, IL-4,5,13, IL-17A, and TNF-α on live gated sciatic nerve CD45.1+ CD90+ TCRβ+ CD4+ cells. (C) Quantification showing Mean±SEM percent indicated cytokine amongst CD4+ T-cells in the indicated organ (Data is combined from 5–6 experiments; spleen n=12 for TNF-α, n=21 for other cytokines; islet n=10 for TNF-α, n=11 for other cytokines; sciatic nerve n=17 for TNF-α, n=26 for other cytokines). (D) Representative staining pattern for IFN-γ vs TNF-α on live gated sciatic nerve CD45.1+ CD90+ TCRβ+ CD4+ cells. (E) Quantification of indicated cytokine combination amongst CD4+ T-cells in the indicated organ (Data is combined from 3–4 experiments; spleen n=12, islet n=10, sciatic nerve n=17). (F) Quantification of median fluorescence intensity (MFI) of the indicated cell surface marker on gated CD4+ T-cells showing Mean±SEM (Data is combined from 4–5 experiments; spleen n=17, islet n=14, sciatic nerve n=21). (G) Based of CD4+CD25+ phenotype proportion of Tregs in spleens, islets, and sciatic nerves. (Data is combined from 4–5 experiments; spleen n=17, islet n=14, sciatic nerve n=21). (H) Quantification of MFI of the indicated cell surface marker on gated CD4+ T-cells showing Mean±SEM (Data is combined from 4–5 experiments; spleen n=17, islet n=14, sciatic nerve n=21). (I) Representative staining pattern for CD4 vs TIM-3 on live gated sciatic nerve CD45.1+ CD90+ TCRβ+ CD4+ cells showing gated TIM-3HI cells. (J) Quantification of the proportion of TIM-3HI cells amongst CD4+ T-cells (Data is combined from 2–3 experiments per organ; spleen n=10, islet n=11, sciatic nerve n=14).
Figure 6 –
Figure 6 –. B-lymphocyte depletion reveals neuritis can develop in NOD-PerIg mice if T1D is delayed.
NOD-PerIg mice were injected i.p with 250μg anti-CD20 every 2 weeks starting at 4 weeks of age. (A) T1D incidence comparing unmanipulated or anti-CD20 treated mice. (B) Representative histology of a diabetic mouse with neuritis. Black arrow designates representative area of infiltration in affected nerve tissue. (C, D) Mouse that survived to 29 weeks of age without T1D showing representative histology of (C) neuritis and (D) myositis. Black arrow designates representative area of infiltration in affected tissue.

References

    1. Leiter E, and Atkinson M. 1998. NOD mice and related strains : research applications in diabetes, AIDS, cancer, and other diseases. R.G. Landes, Austin, Tex.
    1. Leiter EH 1993. The NOD Mouse: A Model for Analyzing the Interplay Between Heredity and Environment in Development of Autoimmune Disease. ILAR Journal 35: 4–14.
    1. Bour-Jordan H, Thompson HL, and Bluestone JA. 2005. Distinct effector mechanisms in the development of autoimmune neuropathy versus diabetes in nonobese diabetic mice. J Immunol 175: 5649–5655. - PubMed
    1. Salomon B, Rhee L, Bour-Jordan H, Hsin H, Montag A, Soliven B, Arcella J, Girvin AM, Padilla J, Miller SD, and Bluestone JA. 2001. Development of spontaneous autoimmune peripheral polyneuropathy in B7–2-deficient NOD mice. The Journal of experimental medicine 194: 677–684. - PMC - PubMed
    1. Louvet C, Kabre BG, Davini DW, Martinier N, Su MA, DeVoss JJ, Rosenthal WL, Anderson MS, Bour-Jordan H, and Bluestone JA. 2009. A novel myelin P0-specific T cell receptor transgenic mouse develops a fulminant autoimmune peripheral neuropathy. The Journal of experimental medicine 206: 507–514. - PMC - PubMed

Publication types

MeSH terms