

Distinct evolutionary paths in chronic lymphocytic leukemia during resistance to the graft-versus-leukemia effect
- PMID: 32938797
- PMCID: PMC7829680
- DOI: 10.1126/scitranslmed.abb7661
Distinct evolutionary paths in chronic lymphocytic leukemia during resistance to the graft-versus-leukemia effect
Abstract
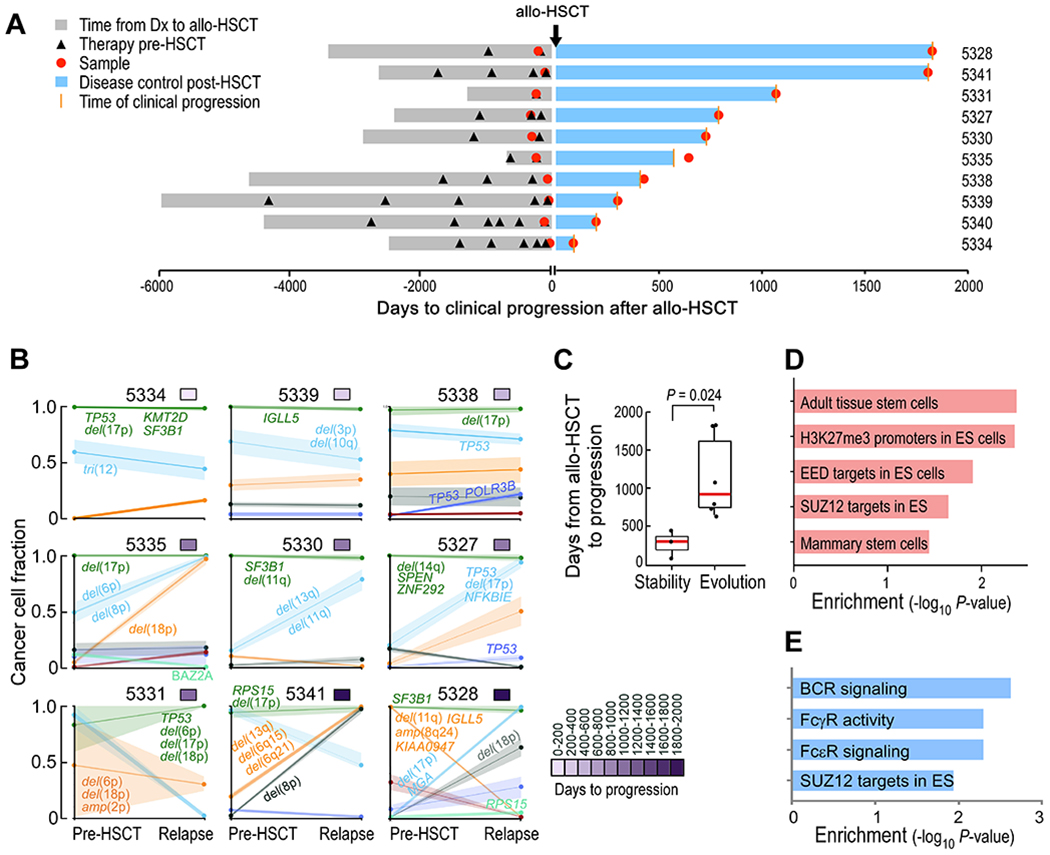
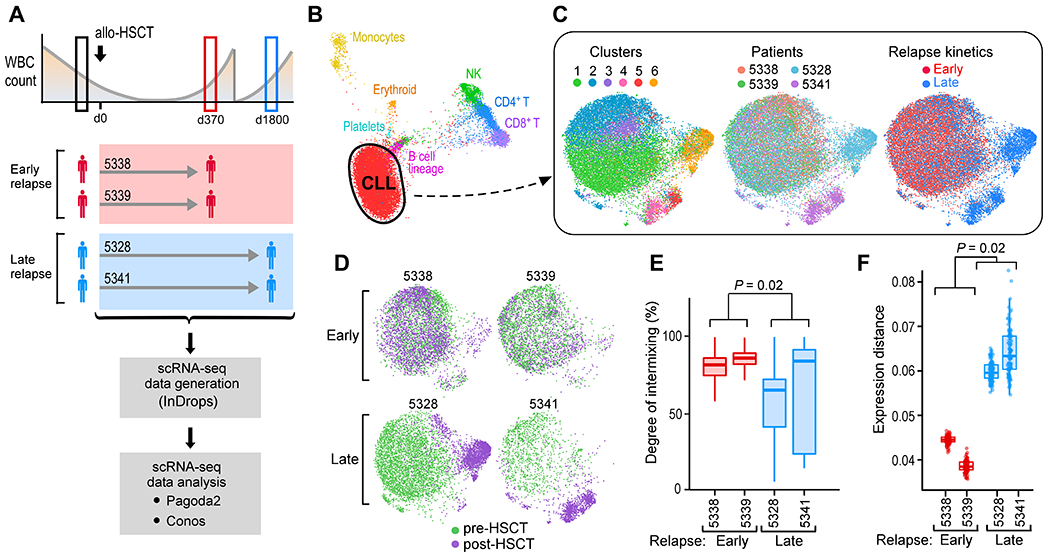
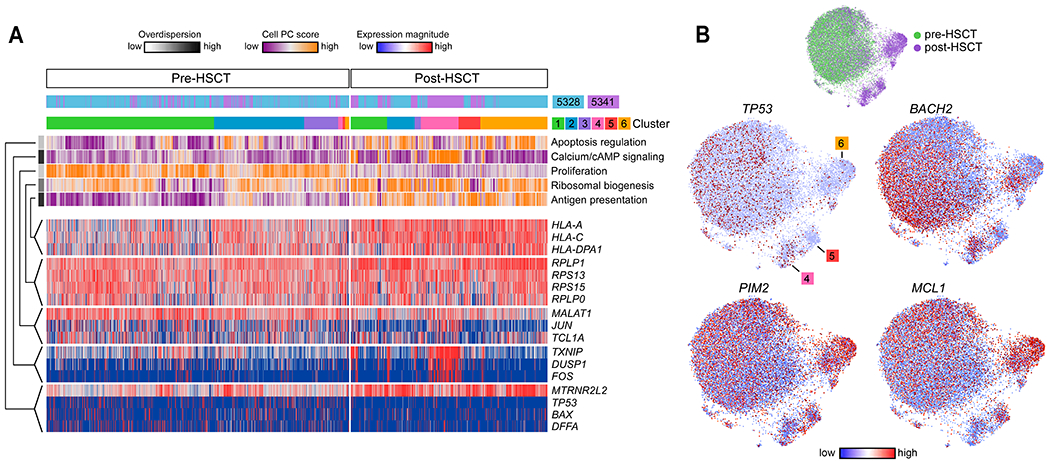
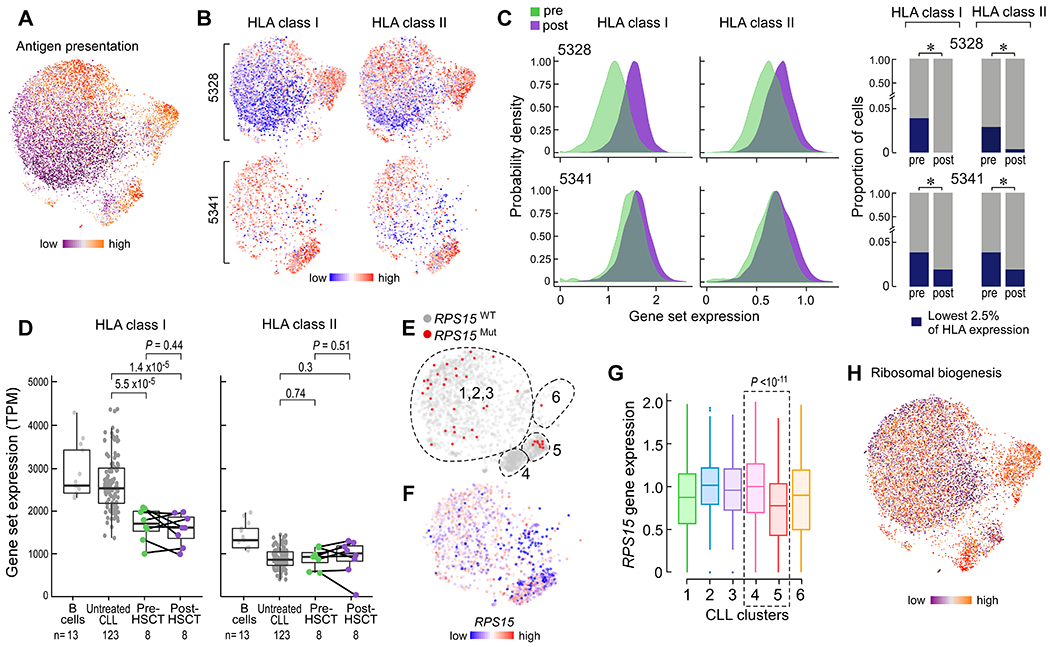
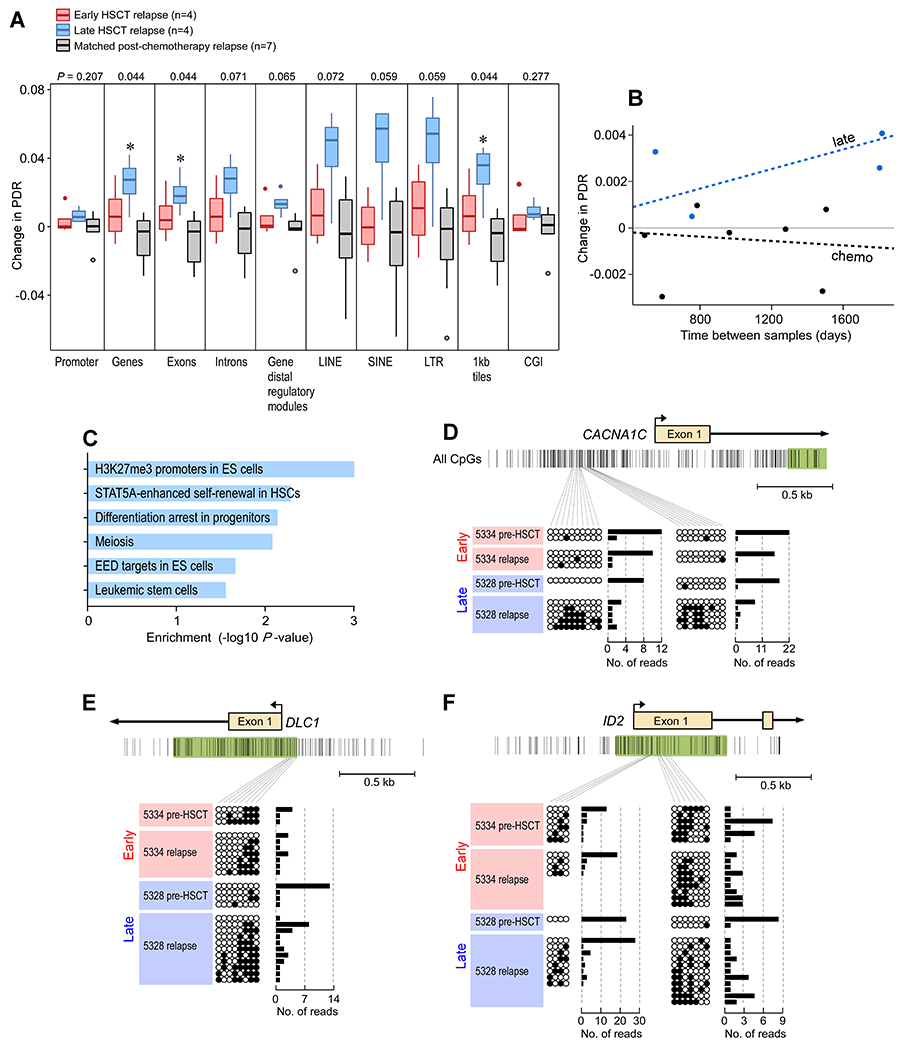
Leukemic relapse remains a major barrier to successful allogeneic hematopoietic stem cell transplantation (allo-HSCT) for aggressive hematologic malignancies. The basis for relapse of advanced lymphoid malignancies remains incompletely understood and may involve escape from the graft-versus-leukemia (GvL) effect. We hypothesized that for patients with chronic lymphocytic leukemia (CLL) treated with allo-HSCT, leukemic cell-intrinsic features influence transplant outcomes by directing the evolutionary trajectories of CLL cells. Integrated genetic, transcriptomic, and epigenetic analyses of CLL cells from 10 patients revealed that the clinical kinetics of post-HSCT relapse are shaped by distinct molecular dynamics. Early relapses after allo-HSCT exhibited notable genetic stability; single CLL cell transcriptional analysis demonstrated a cellular heterogeneity that was static over time. In contrast, CLL cells relapsing late after allo-HSCT displayed notable genetic evolution and evidence of neoantigen depletion, consistent with marked single-cell transcriptional shifts that were unique to each patient. We observed a greater rate of epigenetic change for late relapses not seen in early relapses or relapses after chemotherapy alone, suggesting that the selection pressures of the GvL bottleneck are unlike those imposed by chemotherapy. No selective advantage for human leukocyte antigen (HLA) loss was observed, even when present in pretransplant subpopulations. Gain of stem cell modules was a common signature associated with leukemia relapse regardless of posttransplant relapse kinetics. These data elucidate the biological pathways that underlie GvL resistance and posttransplant relapse.
Copyright © 2020 The Authors, some rights reserved; exclusive licensee American Association for the Advancement of Science. No claim to original U.S. Government Works.
Figures
Similar articles
-
Chronic lymphocytic leukemia patients with HLA-B27 referred for allogeneic hematopoietic stem cell transplantation do not have worse outcomes: Results of a population-based case series analysis in British Columbia, Canada.Leuk Res. 2019 Sep;84:106193. doi: 10.1016/j.leukres.2019.106193. Epub 2019 Jul 15. Leuk Res. 2019. PMID: 31325731
-
Quantitative MRD monitoring identifies distinct GVL response patterns after allogeneic stem cell transplantation for chronic lymphocytic leukemia: results from the GCLLSG CLL3X trial.Leukemia. 2008 Jul;22(7):1377-86. doi: 10.1038/leu.2008.96. Epub 2008 Apr 17. Leukemia. 2008. PMID: 18418404 Clinical Trial.
-
High incidence of chronic graft-versus-host disease after myeloablative allogeneic stem cell transplantation for chronic lymphocytic leukemia in Sweden: graft-versus-leukemia effect protects against relapse.Med Oncol. 2013 Dec;30(4):762. doi: 10.1007/s12032-013-0762-x. Epub 2013 Nov 9. Med Oncol. 2013. PMID: 24214180
-
Allotransplantation for chronic lymphocytic leukemia.Hematology Am Soc Hematol Educ Program. 2009:602-9. doi: 10.1182/asheducation-2009.1.602. Hematology Am Soc Hematol Educ Program. 2009. PMID: 20008245 Review.
-
Treatment-related mortality and graft-versus-leukemia activity after allogeneic stem cell transplantation for chronic lymphocytic leukemia using intensity-reduced conditioning.Leukemia. 2003 May;17(5):841-8. doi: 10.1038/sj.leu.2402905. Leukemia. 2003. PMID: 12750695 Review.
Cited by
-
Longitudinal Single-Cell Dynamics of Chromatin Accessibility and Mitochondrial Mutations in Chronic Lymphocytic Leukemia Mirror Disease History.Cancer Discov. 2021 Dec 1;11(12):3048-3063. doi: 10.1158/2159-8290.CD-21-0276. Cancer Discov. 2021. PMID: 34112698 Free PMC article.
-
Systematic identification of minor histocompatibility antigens predicts outcomes of allogeneic hematopoietic cell transplantation.Nat Biotechnol. 2025 Jun;43(6):971-982. doi: 10.1038/s41587-024-02348-3. Epub 2024 Aug 21. Nat Biotechnol. 2025. PMID: 39169264
-
Tracking Rare Single Donor and Recipient Immune and Leukemia Cells after Allogeneic Hematopoietic Cell Transplantation Using Mitochondrial DNA Mutations.Blood Cancer Discov. 2024 Nov 1;5(6):442-459. doi: 10.1158/2643-3230.BCD-23-0138. Blood Cancer Discov. 2024. PMID: 39236287 Free PMC article.
-
Decoding leukemia at the single-cell level: clonal architecture, classification, microenvironment, and drug resistance.Exp Hematol Oncol. 2024 Jan 30;13(1):12. doi: 10.1186/s40164-024-00479-6. Exp Hematol Oncol. 2024. PMID: 38291542 Free PMC article. Review.
-
A stem cell epigenome is associated with primary nonresponse to CD19 CAR T cells in pediatric acute lymphoblastic leukemia.Blood Adv. 2023 Aug 8;7(15):4218-4232. doi: 10.1182/bloodadvances.2022008977. Blood Adv. 2023. PMID: 36607839 Free PMC article.
References
-
- Jenq RR, van den Brink MRM, Allogeneic haematopoietic stem cell transplantation: individualized stem cell and immune therapy of cancer, Nat. Rev. Cancer 10, 213–221 (2010). - PubMed
-
- Davids MS, Alyea EP, The evolving role of hematopoietic cell transplantation in chronic lymphocytic leukemia, Curr. Hematol. Malig. Rep 10, 18–27 (2015). - PubMed
-
- Toffalori C, Zito L, Gambacorta V, Riba M, Oliveira G, Bucci G, Barcella M, Spinelli O, Greco R, Crucitti L, Cieri N, Noviello M, Manfredi F, Montaldo E, Ostuni R, Naldini MM, Gentner B, Waterhouse M, Zeiser R, Finke J, Hanoun M, Beelen DW, Gojo I, Luznik L, Onozawa M, Teshima T, Devillier R, Blaise D, Halkes CJM, Griffioen M, Carrabba MG, Bernardi M, Peccatori J, Barlassina C, Stupka E, Lazarevic D, Tonon G, Rambaldi A, Cittaro D, Bonini C, Fleischhauer K, Ciceri F, Vago L, Immune signature drives leukemia escape and relapse after hematopoietic cell transplantation, Nat. Med 25, 603–611 (2019). - PubMed
Publication types
MeSH terms
Substances
Grants and funding
LinkOut - more resources
Full Text Sources
Research Materials
