. 2020 Sep 16;11(9):762.
doi: 10.1038/s41419-020-02947-3.

PKC-δ deficiency in B cells displays osteopenia accompanied with upregulation of RANKL expression and osteoclast-osteoblast uncoupling

Affiliations

PKC-δ deficiency in B cells displays osteopenia accompanied with upregulation of RANKL expression and osteoclast-osteoblast uncoupling

Shangfu Li et al. Cell Death Dis. .

Abstract

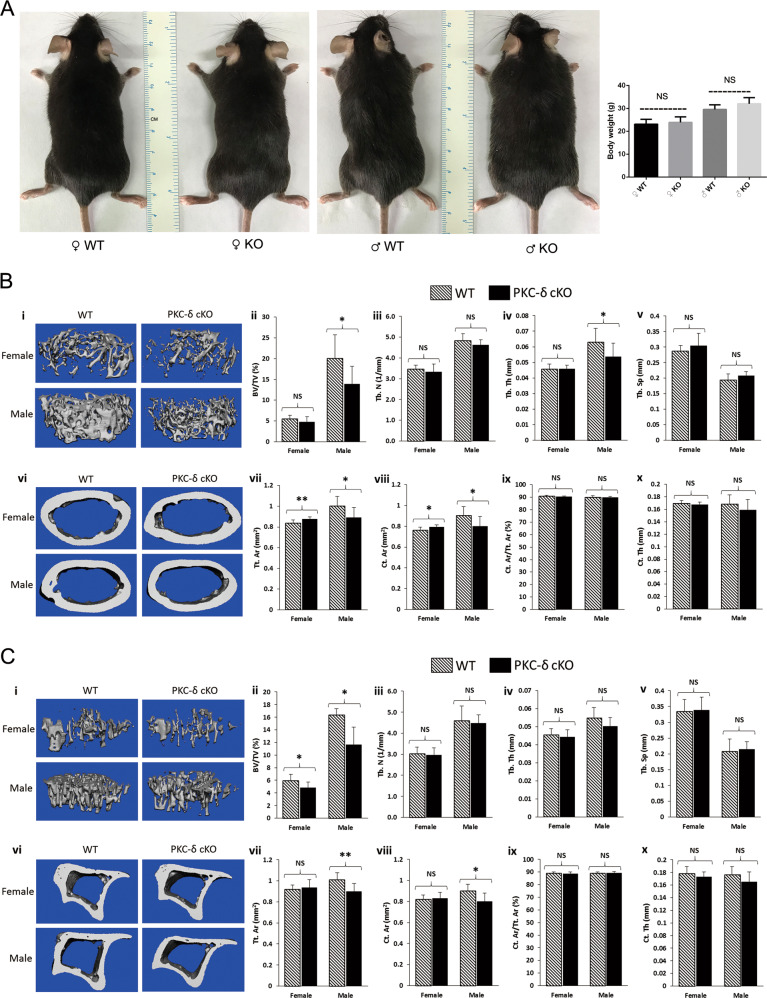
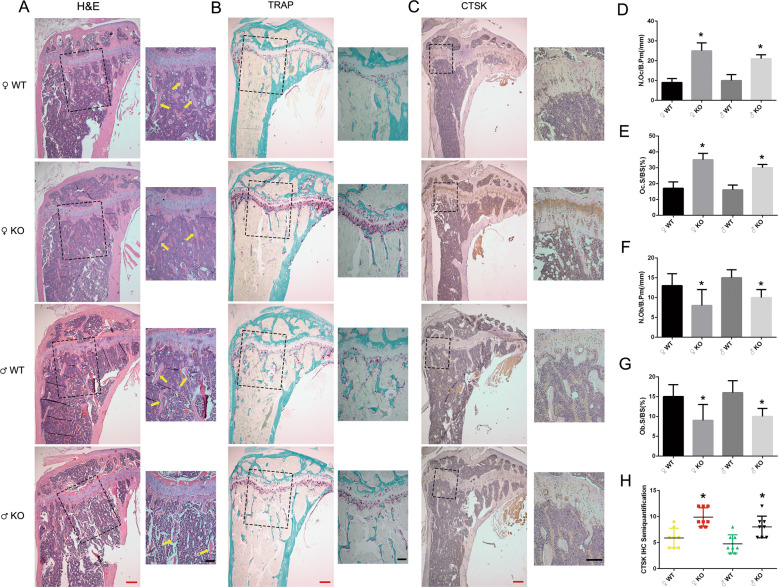
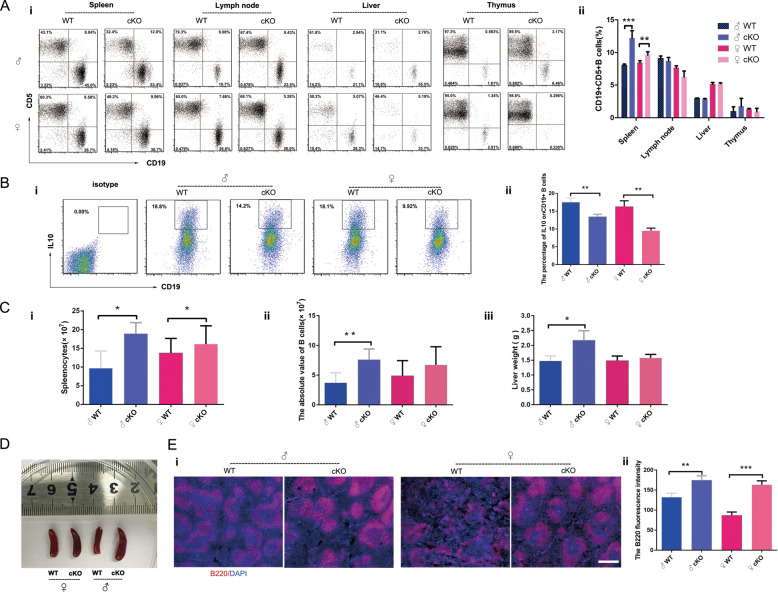
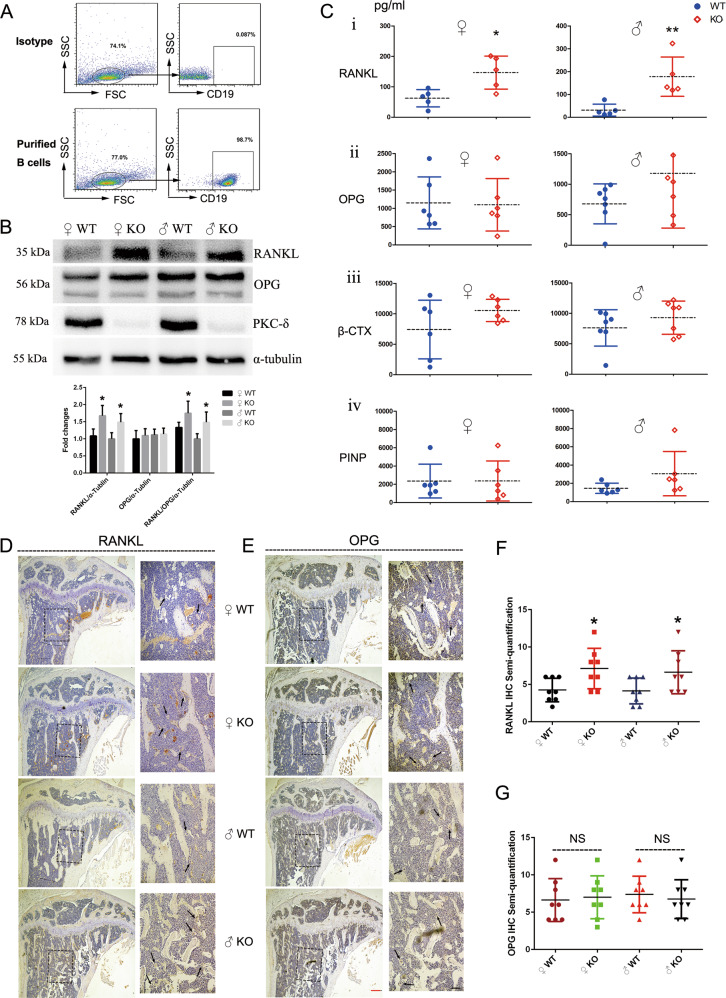
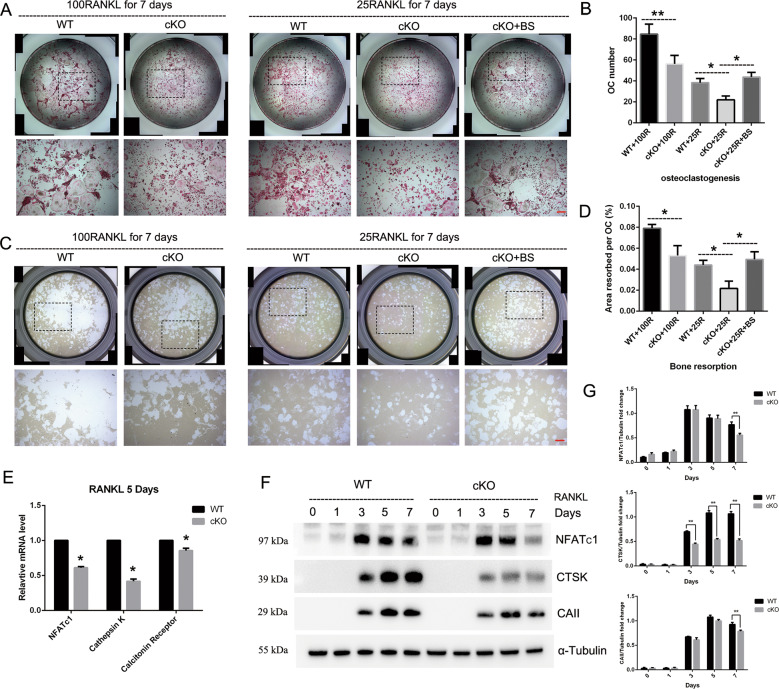
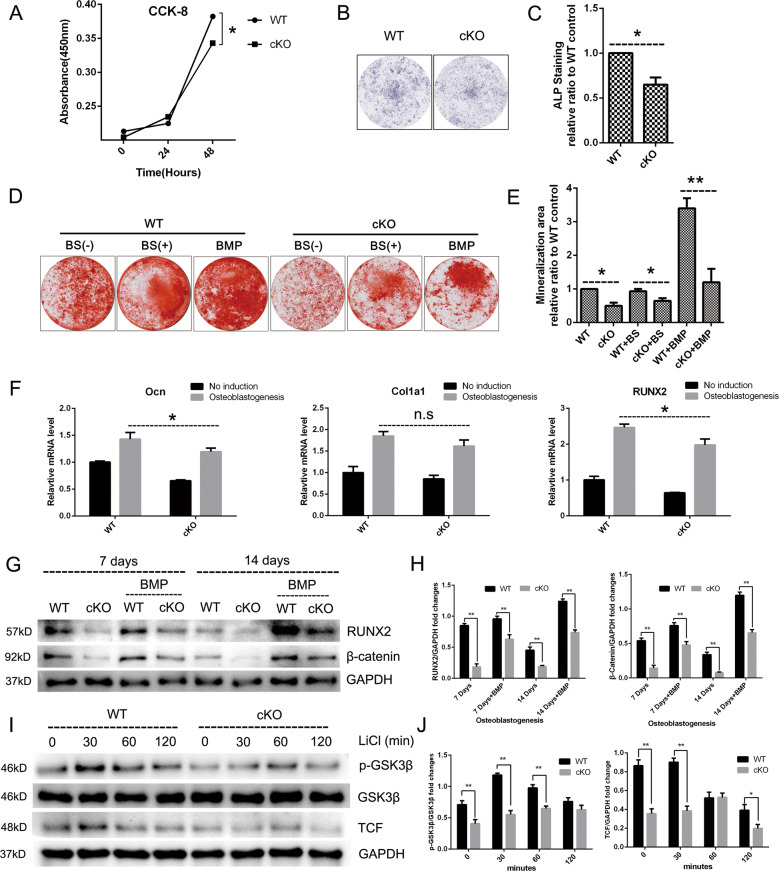
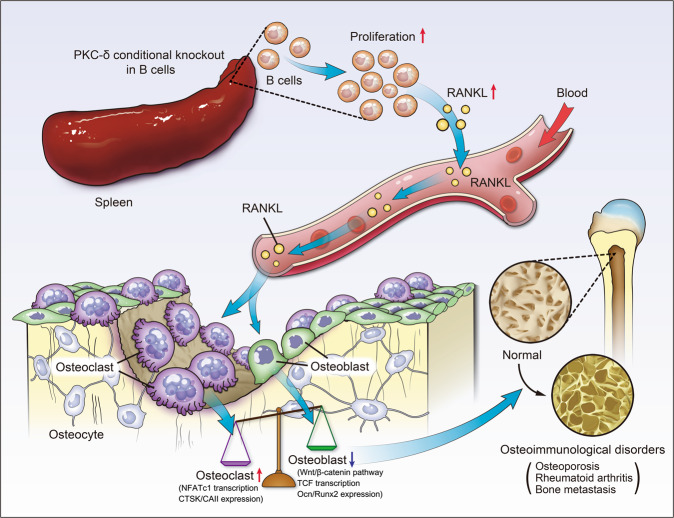
PKC-δ is an important molecule for B-cell proliferation and tolerance. B cells have long been recognized to play a part in osteoimmunology and pathological bone loss. However, the role of B cells with PKC-δ deficiency in bone homeostasis and the underlying mechanisms are unknown. We generated mice with PKC-δ deletion selectively in B cells by crossing PKC-δ-loxP mice with CD19-Cre mice. We studied their bone phenotype using micro-CT and histology. Next, immune organs were obtained and analyzed. Western blotting was used to determine the RANKL/OPG ratio in vitro in B-cell cultures, ELISA assay and immunohistochemistry were used to analyze in vivo RANKL/OPG balance in serum and bone sections respectively. Finally, we utilized osteoclastogenesis to study osteoclast function via hydroxyapatite resorption assay, and isolated primary calvaria osteoblasts to investigate osteoblast proliferation and differentiation. We also investigated osteoclast and osteoblast biology in co-culture with B-cell supernatants. We found that mice with PKC-δ deficiency in B cells displayed an osteopenia phenotype in the trabecular and cortical compartment of long bones. In addition, PKC-δ deletion resulted in changes of trabecular bone structure in association with activation of osteoclast bone resorption and decrease in osteoblast parameters. As expected, inactivation of PKC-δ in B cells resulted in changes in spleen B-cell number, function, and distribution. Consistently, the RANKL/OPG ratio was elevated remarkably in B-cell culture, in the serum and in bone specimens after loss of PKC-δ in B cells. Finally, in vitro analysis revealed that PKC-δ ablation suppressed osteoclast differentiation and function but co-culture with B-cell supernatant reversed the suppression effect, as well as impaired osteoblast proliferation and function, indicative of osteoclast-osteoblast uncoupling. In conclusion, PKC-δ plays an important role in the interplay between B cells in the immune system and bone cells in the pathogenesis of bone lytic diseases.


Conflict of interest statement

The authors declare that they have no conflict of interest.

Figures

Fig. 1
Fig. 1. Micro-CT analysis of hind limbs revealing an osteoporotic phenotype in 12-week-old mice with PKC-δ conditional knockout in B cells.
a Representative images and body weight of the mice at 12 weeks of age (WT wild-type, KO knockout). NS = non-significant compared with WT controls; b, c Representative 3D reconstructions of trabecular and cortical bone and bone parameters assessed by micro-CT in distal femur (b i–x) and proximal tibia (c i–x) in age- and sex-matched WT and PKC-δ conditional knockout (cKO) mice, respectively (male WT n = 6, male cKO n = 7, female WT n = 7, female cKO n = 7). Trabecular bone parameters (b ii–v and c ii–v) are shown as trabecular bone volume fraction (BV/TV, %; b ii and c ii), trabecular number (Tb.N, 1/mm; b iii and c iii), trabecular thickness (Tb.Th, mm; b iv and c iv) and trabecular separation (Tb.Sp, mm; b v and c v). Micro-CT analysis of cortical bone parameters (b vii–x and c vii–x) are shown as total cortical area (Tt.Ar, mm2; b vii and c vii), cortical bone area (Ct.Ar, mm2; b viii and c viii), cortical area fraction (Ct.Ar/Tt.Ar, %; b ix and c ix) and cortical thickness (Ct.Th, μm; b x and c x). Data are presented as mean ± SD. *p < 0.05, **p < 0.01, NS = non-significant compared with WT controls.
Fig. 2
Fig. 2. Histological analysis of wide type and PKC-δ conditional knockout proximal tibias from 3-month-old mice.
ac Representative low-power images of H&E/TRAP/CTSK stained tibia sections. Higher magnification micrograph of area within square in ac was presented at the right side of each, and yellow arrows in a indicate trabecular bone within the tibia. Red bar and black bar represent 200 μm and 100 μm, respectively. dg Quantitative histomorphometric analysis of bone parameters: d Number of osteoclasts per bone perimeter (N.Oc/B.Pm, mm−1), e Osteoclast surface relative to bone surface (Oc.S/BS, %), f Number of osteoblasts per bone perimeter (N.Ob/ B.Pm, mm−1), g Osteoblast surface relative to bone surface (Ob.S/BS, %). h Semi-quantification analysis of CTSK IHC staining. Male WT n = 6, male cKO n = 7, female WT n = 7, female cKO n = 7. Bar charts represent mean ± SD. *p < 0.05 compared with WT controls.
Fig. 3
Fig. 3. PKC-δ deficiency in B cells is accompanied by changes in B-cell number, function, and distribution.
a Flow-cytometric analysis of the percentage of CD19+CD5+ B cells in spleen, lymph nodes, liver and thymus from WT and PKC-δ cKO mice (i), with bar charts showing the quantification (ii); b Flow-cytometric analysis of the percentage of IL-10+CD19+ B cells in splenocytes from WT and PKC-δ cKO mice (i), with bar charts showing the quantification (ii); c The number of splenocytes was counted after single-cell suspensions were prepared from pooled spleens of WT and PKC-δ cKO mice (i). The absolute number of splenic CD19+ B cells was determined after B-cell sorting (ii). The liver weight was measured after complete separation of liver from WT and PKC-δ cKO mice (iii); d Representative image of general appearance of spleens from WT and PKC-δ cKO mice; e Representative images of immunofluorescent staining from lymphoid follicles in the spleen of WT and PKC-δ cKO mice (i). Cryosections were stained with anti-B220 (Red) and DNA was stained with DAPI (blue), bar represents 200 μm. B220 fluorescence intensity was measured using ImageJ software (ii). Data were presented as mean ± SD (n = 4). *p < 0.05, **p < 0.01, ***p < 0.001 compared with WT control.
Fig. 4
Fig. 4. PKC-δ deficiency in B cells elevated RANKL/OPG ratio in both cell culture and serum and increased RANKL expression in the trabecular bone.
a Flow-cytometry plots representing the purity of B cells after sorting; b Expression of PKC-δ, OPG, and RANKL in B cells from WT and PKC-δ cKO mice was detected by western blotting, with semi-quantitative analysis; c Blood was obtained from the fundus vein of WT and PKC-δ cKO mice. The concentrations of RANKL, OPG, β-CTX, and PINP were determined by ELISA in the serum. Each data point was from an individual mouse and means were indicated by dashed horizontal lines. d, e Representative images of RANKL (d) and OPG (e) immunohistochemistry stained tibia sections of 3-month-old PKC-δ cKO and age-sex-matched wild-type mice. Higher magnification micrograph of area within square in d, e is presented at the right side of each. Arrows indicate the positive staining of osteoclasts in the trabecular bone within the tibia. Red bar and black bar represent 200 μm and 50 μm, respectively. f, g Semi-quantitative analysis of RANKL (f) and OPG (g) immunohistochemistry staining. Bar charts represent mean ± SD. *p < 0.05, **p < 0.01, NS = non-significant compared with WT control group.
Fig. 5
Fig. 5. Deletion of PKC-δ selectively in B cells resulted in suppressing osteoclast differentiation and function, but B-cell supernatant co-culture exerted reversal effect on osteoclast formation and activation.
a Representative images of osteoclasts with TRAP staining after 100 ng/ml or 25 ng/ml RANKL (with and without BS co-culture) induction for 7 days, the square in the upper images of each well indicate where the lower images were captured. Bar represents 200 μm; b Quantification of the number of osteoclasts, TRAP-positive cells containing three or more nuclei were counted as osteoclasts; c Representative images of eroded areas in hydroxyapatite-coated plates after 100 ng/ml or 25 ng/ml (with and without BS co-culture) RANKL stimulation for 5 days, the square in the upper images of each well indicate where the lower images were captured. Bar represents 200 μm; d Quantitative analysis of the resorbed proportion per osteoclast by measuring the area of the mineral coating removal; eg Gene transcription (e) and protein expression fg analysis of osteoclast-specific markers NFATc1, Cathepsin K (CTSK), Calcitonin Receptor and Carbonic Anhydrase II (CAII) by RT-PCR and western blotting. BS B-cell supernatant. All the experiments were carried out in triplicate from 12-week-old male WT and cKO mice, results are presented as mean ± SD. *p < 0.05, **p < 0.01 vs. WT control group.
Fig. 6
Fig. 6. Deletion of PKC-δ selectively in B cells led to impairment of osteoblast proliferation, differentiation, and function.
a Effect of PKC-δ cKO on osteoblast cell viability measured by the CCK-8 assay at day 1 and day 2. b, c Representative low-power images of alkaline phosphatase (ALP) staining (b) and quantitative analysis of ALP staining intensity relative to WT control group (c). d, e Representative low-power images showing the mineralized area stained with alizarin red (d) and quantitative analysis of the area of staining relative to WT control (e). f PKC-δ cKO suppressed osteoblast-specific genes transcription revealed by RT-PCR. Runx2, Ocn, and Col1a1 gene transcription level were tested after 7 days of osteogenesis induction. g, h Representative images of western blotting reflecting the expression levels of β-catenin (Wnt/β-catenin pathway) and RUNX-2 normalized to GAPDH after 7 and 14 days of induction with and without BMP-2 co-culture (g), and quantitative analysis of the fold changes (h). BMP-2 was used as a positive control. i, j PKC-δ cKO interacted with GSK-3β phosphorylation and TCF transcription. Representative western blotting images of p-GSK-3β, GSK-3β, TCF, and GAPDH at 0, 30, 60, and 120 min stimulated with 20 mM LiCl (i) and quantitative analysis of the fold changes of p-GSK-3β and TCF expression (j). BS B-cell supernatant, BMP bone morphogenetic protein-2 (25 ng/ml). All the experiments were carried out in triplicate from 6-week-old male WT and cKO mice, results are presented as mean ± SD. n.s. no statistical significance, *p < 0.05, **p < 0.01 vs. WT control group.
Fig. 7
Fig. 7. The schematic model of the hypothesized mechanism by which PKC-δ ablation selectively in B cells affects bone remodeling.
PKC-δ deficiency in B cells favors bone mass loss, which is owing to the overexpression and secretion of RANKL in these B cells of hyperproliferation and the subsequent osteoclast–osteoblast uncoupling.

Similar articles

Cited by

References

    1. Arron JR, Choi Y. Bone versus immune system. Nature. 2000;408:535–536. - PubMed
    1. Horowitz MC, Fretz JA, Lorenzo JA. How B cells influence bone biology in health and disease. Bone. 2010;47:472–479. - PMC - PubMed
    1. Meednu N, et al. Production of RANKL by memory B cells: a link between B cells and bone erosion in rheumatoid arthritis. Arthritis Rheumatol. 2016;68:805–816. - PMC - PubMed
    1. Li Y, et al. B cells and T cells are critical for the preservation of bone homeostasis and attainment of peak bone mass in vivo. Blood. 2007;109:3839–3848. - PMC - PubMed
    1. Yeo L, et al. Cytokine mRNA profiling identifies B cells as a major source of RANKL in rheumatoid arthritis. Ann. Rheum. Dis. 2011;70:2022–2028. - PMC - PubMed

Publication types

MeSH terms