. 2020 Sep 16;11(1):4660.
doi: 10.1038/s41467-020-18189-y.

Glioma-initiating cells at tumor edge gain signals from tumor core cells to promote their malignancy

Affiliations

Glioma-initiating cells at tumor edge gain signals from tumor core cells to promote their malignancy

Soniya Bastola et al. Nat Commun. .

Abstract

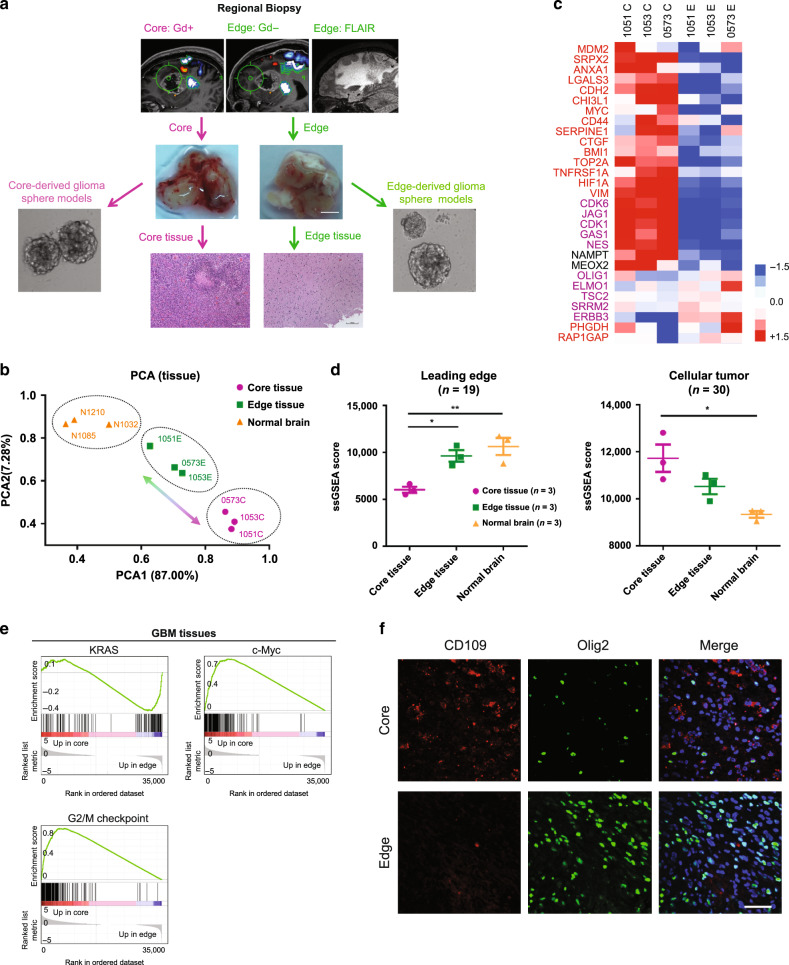
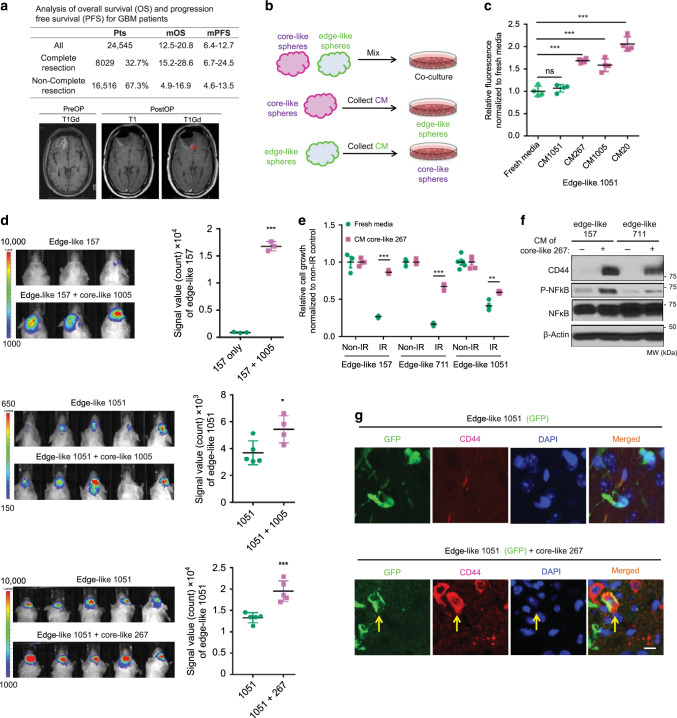
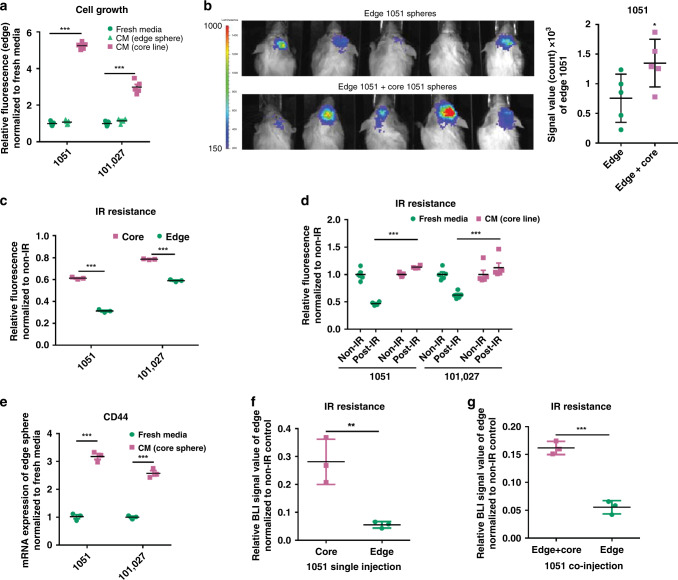
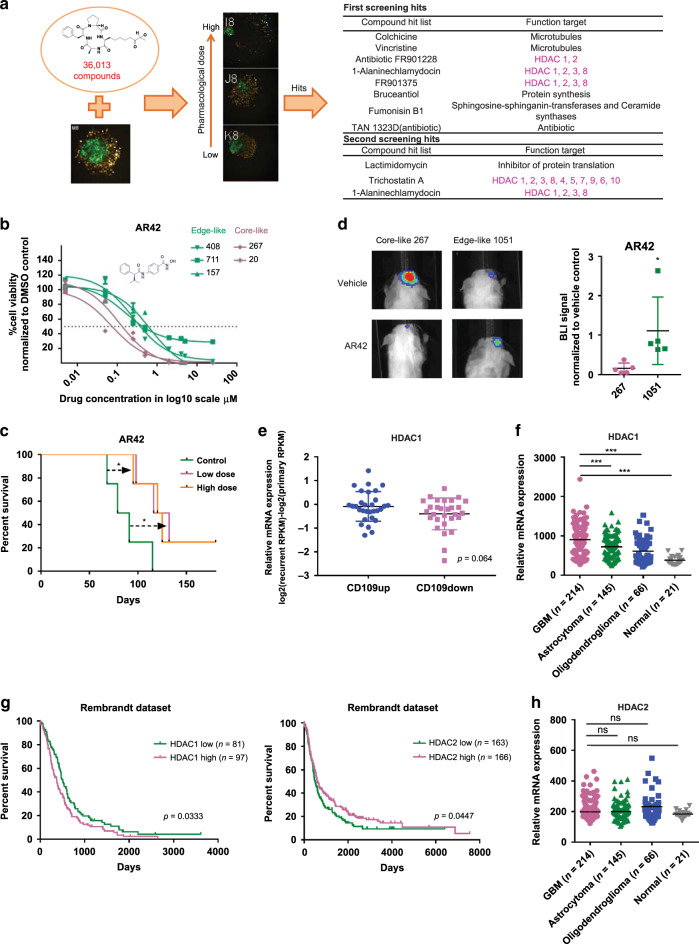
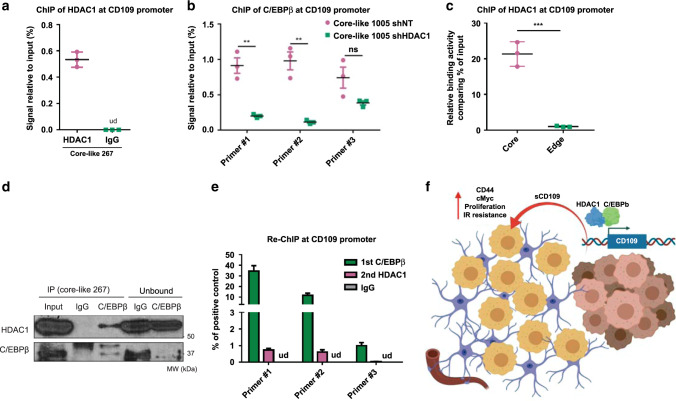
Intratumor spatial heterogeneity facilitates therapeutic resistance in glioblastoma (GBM). Nonetheless, understanding of GBM heterogeneity is largely limited to the surgically resectable tumor core lesion while the seeds for recurrence reside in the unresectable tumor edge. In this study, stratification of GBM to core and edge demonstrates clinically relevant surgical sequelae. We establish regionally derived models of GBM edge and core that retain their spatial identity in a cell autonomous manner. Upon xenotransplantation, edge-derived cells show a higher capacity for infiltrative growth, while core cells demonstrate core lesions with greater therapy resistance. Investigation of intercellular signaling between these two tumor populations uncovers the paracrine crosstalk from tumor core that promotes malignancy and therapy resistance of edge cells. These phenotypic alterations are initiated by HDAC1 in GBM core cells which subsequently affect edge cells by secreting the soluble form of CD109 protein. Our data reveal the role of intracellular communication between regionally different populations of GBM cells in tumor recurrence.


Conflict of interest statement

The authors declare no competing interests.

Figures

Fig. 1
Fig. 1. GBM cells at the invading edge exhibit a molecular signature distinct from those localized in the core.
a Schematic representation of the experimental models established in the current study. Gadolinium (Gd)-enhanced T1-weighted and FLAIR MRI images of regional biopsy from edge and core regions of GBM (upper); representative surgical specimens from edge and core tumor tissues (middle), scale bar 2 mm; representative H&E staining of surgical specimens from edge and core tumor tissues (lower), scale bar 500 µm; representative images of neurosphere cultures (left and right). b Principal component analysis (PCA) of tumor tissue RNA-seq data of 3 paired GBM edge and core tissues and normal brain tissues derived from epilepsy surgery. c Heatmap of RNA-seq data demonstrating the differentially expressed genes. d Single-sample gene-set enrichment analysis (ssGSEA) of normal brain, GBM edge and GBM core tumor tissues using cellular tumor (CT) (left) and leading edge (LE) (right) gene signatures from Ivy Glioblastoma Atlas Project database. n = 3 independent samples per group; *p < 0.05, **p < 0.01 using one-way ANOVA followed by Tukey’s post-test. Data are mean ± s.d. e Gene-set enrichment analysis (GSEA) of core tissues, compared to edge tissues. Gene sets shown include c-Myc, G2/M checkpoint and KRAS-associated genes. f Representative immunofluorescent staining of edge and core human GBM tissues for Olig2 (green), CD109 (red) and DNA (blue). Scale bar 50 μm.
Fig. 2
Fig. 2. Regionally specified GBM cells phenocopy intratumoral spatial identities.
a IHC staining of mouse brains injected with edge or core 1051 GBM spheres for human mitochondria. Scale bar 2 mm. b IHC staining of mouse brains injected with edge or core 1051 GBM spheres for KRAS (upper), c-Myc (middle) and CHEK1 (lower). Scale bar 400um. c Representative immunofluorescence (IF) images of mouse brain slice culture seeded with edge 1051 (blue, yellow arrow) or core 1051 (green, white arrow) sphere cells and stained for Collagen IV to label blood vessels (red). Scale bar 50 µm. d IHC staining of a mouse brain co-injected with edge (unlabeled) and core (mCherry labeled) 1051 GBM spheres (ratio 1:1) for mCherry (lower, violet circle) and human mitochondria (upper, white circle). Scale bar 2 mm. e IF staining of the same samples as in “d” for human mitochondria (green), mCherry (red) and nucleus (blue). Scale bar 50 µm. f PCA of gene expression in edge, edge-like, core and core-like GBM sphere lines using set of 96-genes (32 each for proneural, mesenchymal and classical subtypes). g GSEA of core/core-like GBM spheres, compared to edge/edge-like GBM spheres. Gene sets shown include c-Myc, G2/M checkpoint, and KRAS-associated genes.
Fig. 3
Fig. 3. Intercellular signaling from core-like GBM cells provokes aggressiveness of their edge-like counterparts.
a Table comparing overall survival (OS) and progression free survival (PFS) of GBM patients that underwent complete or non-complete resection (upper). The representative MRI image of pre- and postoperative brain, demonstrating residual enhancing lesions after surgery (lower). b Schema of the in vitro experiments with conditioned medium (CM). c In vitro cell growth assay of edge-like 1051 GBM spheres treated with/without CM from edge-like 1051 or core-like 267/1005/20 GBM spheres. Data are mean ± s.d., n = 4 independent samples per group.; ns, not significant; **p < 0.001 using one-way ANOVA followed by Tukey’s post-test. d Bioluminescence imaging (BLI) of mice intracranially injected with luciferase-labeled 1051 (n = 5 animals) or 157 (n = 3 animals) edge-like GBM spheres alone or together with unlabeled core-like GBM spheres (267, 1005) (ratio 95:5) (left). Quantification of BLI signal in mice (right). e In vitro cell viability assay of edge-like 157, 711, and 1051 GBM spheres pretreated with CM from core-like 267 GBM spheres and irradiated (IR) or left non-irradiated (non-IR). n = 4 independent samples per group. f Western blot (WB) for p65, phosphorylated p65 (p-p65) and CD44 using edge-like 157/711 GBM spheres treated with or without CM from core-like 267 GBM spheres. g IF staining for nucleus (blue), GFP (green) and CD44 (red) of mice brains bearing intracranial tumors developed from edge-like 1051 GBM spheres (labeled with GFP) alone, or co-injected with core-like 267 GBM spheres (unlabeled). Scale bar 20 µm. de Data are mean ± s.d. Significance was calculated by unpaired, two-tailed t-test with *p < 0.05; **p < 0.01; ***p < 0.001.
Fig. 4
Fig. 4. Regionally specified GBM cells demonstrate a similar growth promotion effect from GBM core to edge.
a In vitro cell growth assay of edge 1051 and edge 101027 GBM spheres treated with CM from core or edge spheres. n = 5 independent samples per group. b Bioluminescence imaging of mice intracranially co-injected with luciferase-labeled edge 1051 GBM spheres with or without unlabeled core 1051 GBM spheres (ratio 9:1) (left). Quantification of BLI signal in mice (right). n = 5 animals. c In vitro cell viability assay of irradiated (4 Gy; IR) or non-irradiated (non-IR) 1051 or 10127 edge and core GBM spheres. n = 3 independent samples per group. d In vitro cell viability assay of edge 1051/101027 spheres pretreated with CM from core spheres and subsequently irradiated. n = 5 independent samples per group. e qRT-PCR analysis of CD44 expression in edge 1051 and 101027 GBM spheres treated with fresh media or CM from core counterpart. n = 3 independent samples per group. f Quantification of BLI signal from mice intracranially injected with luciferase-labeled edge or core 1051 GBM spheres before and after irradiation. n = 3 animals. g Quantification of BLI signal from mice intracranially injected with luciferase-labeled 1051 cells edge alone or together with unlabeled core 1051 GBM spheres before and after irradiation. n = 3 animals. ag Data are mean ± s.d. Significance was calculated by unpaired, two-tailed t-test with *p < 0.05; **p < 0.01; ***p < 0.001.
Fig. 5
Fig. 5. HDAC1 plays a role in the tumorigenic effect of core cells and is associated with poorer clinical outcome.
a Schematic representation of small molecule compound screening using in vitro co-culture mixed-sphere system; core-like and edge-like GBM spheres were labeled with YFP and GFP respectively (left). Hits from two independent screenings are presented in the table (right). Violet indicates HDAC inhibitors. b In vitro cell viability assay of edge-like 157/711/408 and core-like 267/20 GBM spheres treated with DMSO or AR42 at different concentrations. Data are mean ± s.d., n = 4 independent samples per group. c Kaplan–Meier survival curve of mice intracranially injected with core-like 267 GBM spheres followed by treatment with AR42 at different doses (10 mg/kg or 30 mg/kg). *p < 0.05, two sided log-rank test adjusted for multiple comparison; n = 4 animals. d Representative bioluminescence imaging of mice injected with edge-like 1051 or core-like 267 spheres and treated with vehicle or AR42 (left). Quantification of BLI signal in mice (right). *p < 0.05 using unpaired, two-tailed t-test. Data are mean ± s.d; n = 5 animals. e HDAC1 mRNA levels in matched longitudinal GBM samples (primary and recurrent tumors) grouped according to the CD109 expression level (up n = 30 patients or down n = 29 patients); p = 0.064 using unpaired, two-tailed t-test. Data are mean ± s.d;. f HDAC1 mRNA levels in glioma tumors (n = 424 patients) and normal brain samples (n = 21 patients) from Rembrandt datasets. ***p < 0.001 using one-way ANOVA followed by Tukey’s post-test. The line is the median. g Kaplan–Meier survival curves of GBM patients subdivided by the level of HDAC1 expression (p = 0.033, two sided log-rank test; left) or HDAC2 expression (p = 0.045, two sided log-rank test; right). Data collected from the Rembrandt dataset (n = 179 patients). h HDAC2 mRNA levels in glioma tumors (n = 424 patients) and normal brain samples (n = 21 patients) from Rembrandt datasets. ns, not significant; using one-way ANOVA followed by Tukey’s post-test. The line is the median.
Fig. 6
Fig. 6. Inhibition of HDAC1 attenuates the intercellular signaling from core to edge GBM cells.
a In vitro cell growth assay of edge-like 157 GBM spheres treated with CM from core-like 267 GBM spheres, which were infected with lentiviruses encoding shNT or shHDAC1. n = 4 independent samples per group. Data are mean ± s.d., ***p < 0.001 using one-way ANOVA followed by Tukey’s post-test. b In vitro cell viability assay of edge-like 157 GBM spheres pretreated as in “a” and subsequently irradiated. n = 4 independent samples per group. Data are mean ± s.d., ***p < 0.001 using one-way ANOVA followed by Tukey’s post-test. c Bioluminescence imaging of mice intracranially co-injected with luciferase-labeled edge-like 1051 GBM spheres and unlabeled shNT-infected or shHDAC1-infected core-like 267 GBM spheres (95:5 ratio) (left). Quantification of BLI signal in mice (right). n = 4 animals. d Same as in “c” for co-injection of luciferase-labeled edge-like 157 GBM spheres and unlabeled core-like 1005 GBM spheres, n = 4 animals. e IF staining for GFP (green), c-Myc (red), and nucleus (blue) of mice brains bearing intracranial tumors developed from co-injection of GFP-labeled edge-like 1051/157 GBM spheres and shNT-infected or shHDAC1-infected core-like 267/1005 GBM spheres. Scale bar 10 µm. f GSEA of shNT-infected core-like 267/28 GBM spheres, as compared to shHDAC1-infected spheres. Gene sets shown are c-Myc and G2/M checkpoint-associated genes. g Heatmap of RNA-seq data comparing expression of selected genes in core-like 267/28 GBM spheres infected with shNT or shHDAC1. CD109 indicated by red arrow. c, d Data are mean ± s.d. Significance was calculated by unpaired, two-tailed t-test with *p < 0.05; **p < 0.01.
Fig. 7
Fig. 7. Soluble CD109 is a mediator of HDAC1-derived intercellular signals from core to edge GBM cells.
a In vitro cell growth assay of edge-like 157 GBM spheres treated with CM from core-like 267 GBM spheres incubated with or without proteinase K. n = 3 independent samples per group. b Venn diagram illustrating proteins identified by LC-MS/MS in CM from core-like and edge-like GBM spheres (left). Table showing the top 13 proteins exclusively detected in core-like CM (right). c Enzyme-linked immunosorbent assay (ELISA) for soluble CD109 in CM from 1051 and 101027 edge or core patient-derived GBM spheres. n = 2 independent experiments. d Graph demonstrating differences in the relative amount of proteins detected by LC-MS/MS in CM from core-like cells infected with shNT or with shHDAC1 encoding lentiviruses. e WB for HDAC1 and CD109 using 1051 core GBM cells infected with shNT or shHDAC1 lentiviruses or using 1051 edge GBM cells infected with GFP or HDAC1 encoding lentiviruses. f WB for CD109 and HDAC1 using core-like 267/1005 GBM spheres infected with shNT or shHDAC1 lentiviruses. g qRT-PCR analysis of CD109 expression in edge-like 157 GBM spheres infected with lentiviruses encoding GFP or HDAC1. n = 3 independent samples per group. h In vitro cell viability assay of edge-like 157 GBM spheres infected with lentiviruses encoding GFP or HDAC1 and subsequently irradiated (IR). n = 4 independent samples per group. i Flow cytometry analysis of caspase-3/7 activity and SYTOX staining in 1051 and 101027 edge or core spheres that were cultivated in a presence or absence of recombinant sCD109 for 3 days and subsequently irradiated with 8 Gy. j Bioluminescence imaging of mice intracranially co-injected with luciferase-labeled edge-like 157 GBM spheres and unlabeled shNT or shCD109-infected core-like 1005 GBM spheres (95:5 ratio) (left). Quantification of BLI signal in mice (right). n = 3 animals. k IF staining for GFP (green), c-Myc (red) and nucleus (blue) of mouse brains co-injected with GFP-labeled edge-like 157 GBM spheres and unlabeled shNT or shCD109-infected core-like 1005 GBM spheres. Scale bar 20 µm. aj Data are mean ± s.d. Significance was calculated by unpaired, two-tailed t-test with **p < 0.01; ***p < 0.001.
Fig. 8
Fig. 8. HDAC1 regulates transcription of CD109 via C/EBPβ.
a ChIP analysis showing enrichment of HDAC1 at CD109 promoter region in core-like 267 GBM spheres. ud- undetected, n = 3 independent samples per group. b ChIP analysis showing enrichment of C/EBPβ at CD109 promoter region in core-like 1005 GBM spheres infected with shNT or shHDAC1, n = 3 independent samples per group; ns, not significant. c ChIP analysis showing binding of HDAC1 to CD109 promoter region in 1051 core and edge GBM spheres. n = 3 independent samples per group. d Co-immunoprecipitation of HDAC1 in core-like 267 GBM spheres with antibodies against C/EBPβ. e Re-ChIP analysis using anti-C/EBPβ antibodies for first precipitation, followed by second immunoprecipitation with antibodies against HDAC1 and subsequent PCR with primers spanning promoter region of CD109. n = 3 independent samples per group. ud- undetected. f Proposed molecular mechanism of intercellular crosstalk between core and edge GBM cells via soluble CD109 protein. HDAC1-C/EBPβ-CD109 signaling induces upregulation of CD44 and c-Myc in edge cells and ultimately leads to the increased proliferation and therapy resistance. ae Data are mean ± s.d. Significance was calculated by unpaired, two-tailed t-test not adjusted for multiple comparison with **p < 0.01; ***p < 0.001.

References

    1. Stupp R, et al. Radiotherapy plus concomitant and adjuvant temozolomide for glioblastoma. N. Engl. J. Med. 2005;352:987–996. - PubMed
    1. Chinot OL, et al. Bevacizumab plus radiotherapy-temozolomide for newly diagnosed glioblastoma. N. Engl. J. Med. 2014;370:709–722. - PubMed
    1. Claes A, Idema AJ, Wesseling P. Diffuse glioma growth: a guerilla war. Acta Neuropathol. 2007;114:443–458. - PMC - PubMed
    1. Hanahan D, Weinberg RA. Hallmarks of cancer: the next generation. Cell. 2011;144:646–674. doi: 10.1016/j.cell.2011.02.013. - DOI - PubMed
    1. Jin X, et al. Targeting glioma stem cells through combined BMI1 and EZH2 inhibition. Nat. Med. 2017;23:1352–1361. - PMC - PubMed

Publication types

MeSH terms