. 2020 Sep 16;11(1):4653.
doi: 10.1038/s41467-020-18502-9.

Systemic muscle wasting and coordinated tumour response drive tumourigenesis

Affiliations

Systemic muscle wasting and coordinated tumour response drive tumourigenesis

Holly Newton et al. Nat Commun. .

Abstract

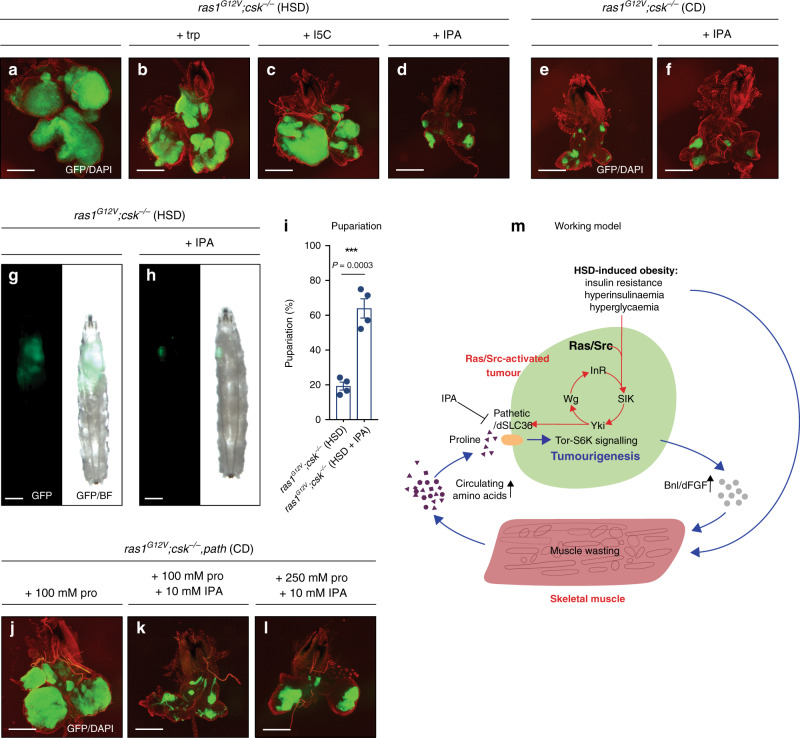
Cancer cells demand excess nutrients to support their proliferation, but how tumours exploit extracellular amino acids during systemic metabolic perturbations remain incompletely understood. Here, we use a Drosophila model of high-sugar diet (HSD)-enhanced tumourigenesis to uncover a systemic host-tumour metabolic circuit that supports tumour growth. We demonstrate coordinate induction of systemic muscle wasting with tumour-autonomous Yorkie-mediated SLC36-family amino acid transporter expression as a proline-scavenging programme to drive tumourigenesis. We identify Indole-3-propionic acid as an optimal amino acid derivative to rationally target the proline-dependency of tumour growth. Insights from this whole-animal Drosophila model provide a powerful approach towards the identification and therapeutic exploitation of the amino acid vulnerabilities of tumourigenesis in the context of a perturbed systemic metabolic network.


Conflict of interest statement

The authors declare no competing interests.

Figures

Fig. 1
Fig. 1. HSD-fed Ras/Src-animals exhibit systemic muscle wasting.
ras1G12V;csk−/− third-instar larvae raised on CD (a) or HSD (b). Transformed tissue is labelled with GFP (green). Secondary tumours are observed in a subset of animals (arrowheads in b). Scale bar, 500 μm. a′, b Matching dissected eye epithelial tissue stained with DAPI (red). Scale bar, 250 μm. Nile Red (red) and DAPI (blue) staining of dissected fat body tissue from ras1G12V;csk−/− third-instar larvae fed a CD (c) or HSD (d). Scale bar, 100 μm. F-actin (red) staining of dissected larval body-wall muscle tissue from ras1G12V;csk−/− third-instar larvae raised on CD (e) or HSD (f). Scale bar, 100 μm. LacZ third-instar larvae raised on CD (g) or HSD (h). LacZ-expressing eye tissue is labelled with GFP (green). Scale bar, 500 μm. g′, h′ Matching dissected eye epithelial tissue stained with DAPI (red). Scale bar, 250 μm. Nile Red (red) and DAPI (blue) staining of dissected fat body tissue from LacZ third-instar larvae fed a CD (i) or HSD (j). Scale bar, 100 μm. F-actin (red) staining of dissected larval body-wall muscle tissue from ras1G12V;csk−/ third-instar larvae fed a CD (k) or HSD (l). Scale bar, 100 μm. m Matching body-wall muscle wasting quantification. X-axis represents the percentage of individual animals scoring in each category denoted ‘none', ‘minor', ‘moderate' or ‘strong'.
Fig. 2
Fig. 2. Tumour-derived branchless mediates muscle wasting and tumour growth.
a Relative log2fold change of Drosophila fibroblast growth factors, branchless (bnl), pyramus and thisbe in dissected tumour tissue from ras1G12V;csk−/− animals raised on HSD compared to animals raised on CD, as determined by qPCR. Samples are normalised to Act88F. Results are shown as mean ± SEM. Data from n = 6 biologically independent samples. Data were analysed by two-tailed unpaired Student’s t test. Asterisks indicate statistically significant difference (**P < 0.01; ****P < 0.0001). Anti-Bnl staining (red) of dissected tumour tissue from ras1G12V;csk−/− animals raised on CD (b) or HSD (c) with DAPI (blue). Scale bar, 40 μm. Third-instar larvae from ras1G12V;csk−/− (d), and ras1G12V;csk−/−,bnlRNAi/GD (e). Scale bar, 500 μm. d′, e′ Matching dissected eye epithelial tissue stained with DAPI (red). Scale bar, 250 μm. f Pupariation percentage of ras1G12V;csk−/−, and ras1G12V;csk−/−,bnlRNAi/GD animals raised on HSD. Results are shown as mean ± SEM. Data from total n = 120 (ras1G12V;csk−/−), and n = 125 (ras1G12V;csk−/−,bnlRNAi/GD) from four independent experiments. Data were analysed by two-tailed unpaired Student’s t test. Asterisks indicate statistically significant difference (****P < 0.0001). F-actin (red) staining of dissected larval body-wall muscle tissue from ras1G12V;csk−/− (g) or ras1G12V;csk−/−,bnlRNAi/GD (h) third-instar larvae raised on HSD. Scale bar, 100 μm. F-actin (red) staining of dissected larval body-wall muscle tissue from FB > LacZ (i) or FB > bnl (j) third-instar larvae raised on HSD. Scale bar, 100 μm. k Matching body-wall muscle wasting quantification.
Fig. 3
Fig. 3. Muscle-specific Btl-dERK signalling promotes muscle wasting in HSD.
a Circulating haemolymph levels of upregulated amino acids in LacZ (blue bars) and ras1G12V;csk−/− (red bars) animals raised on HSD compared to animals raised on CD. Results are shown as mean ± SEM. Data from n = 4 biologically independent samples. F-actin (red) staining of dissected larval body-wall muscle tissue from mhc > LacZ (b), mhc > btl.λ (c), mhc > rlSEM (d), and mhc > btl.λ, rlRNAi/TRiP31387 (e) third-instar larvae raised on HSD. Scale bar, 100 μm. f Matching body-wall muscle wasting quantification. g Matching haemolymph proline quantification. Results are shown as mean ± SEM. Data from n = 4 biologically independent samples. Data were analysed by two-tailed unpaired Student’s t test. Asterisks indicate statistically significant difference (*P < 0.05).
Fig. 4
Fig. 4. Amino acid transporter Path is required for HSD-enhanced Ras/Src-tumour growth.
a Relative log2fold change of SLC7- and SLC36-family amino acid transporters in dissected tumour tissue from ras1G12V;csk−/− animals raised on HSD compared to animals raised on CD, as determined by qPCR. Samples are normalised to Act88F. Results are shown as mean ± SEM. Data from n = 6 (Act88F), n = 6 (mnd), n = 6 (JhI-21), n = 4 (slif), n = 6 (CG8785), n = 6 (path) and n = 6 (CG1139) biologically independent samples. Data were analysed by two-tailed unpaired Student’s t test. Asterisks indicate statistically significant difference (**P < 0.01; ****P < 0.0001). Dissected eye epithelial tissue stained with DAPI (red) from ras1G12V;csk−/− animals raised on HSD (b), with mndRNAi/GD (c), JhI-21RNAi/GD (d), slifRNAi/GD (e), CG8785RNAi/GD (f), pathRNAi/KK (g) and CG1139RNAi/GD (h). Scale bar, 250 μm. Anti-Path staining (red) of dissected tumour tissue from ras1G12V;csk−/− animals raised on CD (i), ras1G12V;csk−/− animals raised on HSD (j), ras1G12V;csk−/−,wts animals raised on HSD (k) and ras1G12V;csk−/−,yki animals raised on CD (l) with DAPI (blue). Scale bar, 100 μm. Anti-CG1139 staining (red) of dissected tumour tissue from ras1G12V;csk−/−animals raised on CD (m), ras1G12V;csk−/− animals raised on HSD (n) and ras1G12V;csk−/−,wts animals raised on HSD (o), and ras1G12V;csk−/−,yki animals raised on CD (p) with DAPI (blue). Scale bar, 100 μm.
Fig. 5
Fig. 5. Proline promotes Ras/Src-tumour growth through amino acid transporter Path.
Dissected eye epithelial tissue stained with DAPI (red) from ras1G12V;csk−/− (a), ras1G12V;csk−/−,path (b) and ras1G12V,CG1139;csk−/− (c) animals raised on CD. Scale bar, 250 μm. Dissected eye epithelial tissue stained with DAPI (red) from ras1G12V;csk−/− (d), ras1G12V;csk−/−,path (e) and ras1G12V,CG1139;csk−/− (f) animals raised on CD supplemented with 100 mM L-proline. Scale bar, 250 μm. Dissected eye epithelial tissue stained with DAPI (red) from LacZ (g), Path (h) and CG1139 (i) animals raised on CD supplemented with 100 mM L-proline. Scale bar, 250 μm. j Stable-isotope labelled proline uptake in tumours from ras1G12V;csk−/− animals, ras1G12V;csk−/−,path animals and ras1G12V,CG1139;csk−/− animals raised on CD supplemented with 100 mM 13C-labelled L-proline. Results are shown as mean ± SEM. Data from n = 3 (ras1G12V;csk−/−), n = 4 (ras1G12V;csk−/−,path) and n = 4 (ras1G12V,CG1139;csk−/−) biologically independent samples. Data were analysed by two-tailed unpaired Student’s t test. Asterisks indicate statistically significant difference (*P < 0.05). Dissected eye epithelial tissue stained with DAPI (red) from ras1G12V;csk−/− (k) and ras1G12V,TorTED;csk−/− (l) animals raised on HSD. Scale bar, 250 μm. Dissected eye epithelial tissue stained with DAPI (red) from ras1G12V;csk−/− (m) and ras1G12V; S6KSTDETE,csk−/− (n) animals raised on CD. Scale bar, 250 μm. Anti-phospho-S6 (pS6) staining (red) of dissected tumour tissue from ras1G12V;csk−/− animals raised on CD (o), ras1G12V;csk−/− animals raised on HSD (p), ras1G12V;csk−/−,path animals raised on CD supplemented with 100 mM L-proline (q) and ras1G12V,TorTED;csk−/−,path animals raised on CD supplemented with 100 mM L-proline (r) with DAPI (blue). Scale bar, 100 μm. s Matching phospho-S6 (pS6) staining quantification. Results are shown as mean ± SEM. Data from n = 3 biologically independent samples. Data were analysed by two-tailed unpaired Student’s t test. Asterisks indicate statistically significant difference (*P < 0.05).
Fig. 6
Fig. 6. Targeting SLC36-transporter with amino acid derivative suppresses tumour growth.
Dissected eye epithelial tissue stained with DAPI (red) from ras1G12V;csk−/− animals raised on HSD (a), HSD supplemented with 10 mM L-tryptophan (trp) (b), HSD supplemented with 10 mM Indole-5-carboxylic acid (I5C) (c) and HSD supplemented with 10 mM Indole-3-propionic acid (IPA) (d). Scale bar, 250 μm. Dissected eye epithelial tissue stained with DAPI (red) from ras1G12V;csk−/− animals raised on CD (e) and CD supplemented with 10 mM IPA (f). Scale bar, 250 μm. Third-instar larvae from ras1G12V;csk−/− animals raised on HSD (g) and HSD supplemented with 10 mM IPA (h). Scale bar, 500 μm. i Pupariation percentage of ras1G12V;csk−/− animals raised on HSD and HSD supplemented with 10 mM IPA. Results are shown as mean ± SEM. Data from total n = 120 (HSD) and n = 75 (HSD + IPA) from four independent experiments. Data were analysed by two-tailed unpaired Student’s t test. Asterisks indicate statistically significant difference (***P < 0.001). Dissected eye epithelial tissue stained with DAPI (red) from ras1G12V;csk−/−,path animals raised on CD supplemented with 100 mM L-proline (j), CD supplemented with 100 mM L-proline and 10 mM IPA (k) and CD supplemented with 250 mM L-proline and 10 mM IPA (l). Scale bar, 250 μm. m Working model illustrating dual-layered coordination of tumour metabolic response: (1) at the whole organism level—branchless (Bnl)-dependent induction of cachexia-like muscle wasting and systemic amino acid release (blue arrows)—and (2) at the tumour-autonomous level—Yorkie-dependent induction of amino acid transporter expression (red arrows). The tumour-autonomous SIK-Yki-Wg-InR circuit was identified previously. IPA represents a therapeutic strategy to break the nutritional circuit between muscle wasting and tumour growth by targeting the SLC36-family transporter Path. SIK Salt-inducible kinase, Yki Yorkie, Wg wingless, InR insulin receptor, IPA indole-3-propionic acid.

References

    1. Hosios AM, et al. Amino acids rather than glucose account for the majority of cell mass in proliferating mammalian cells. Dev. Cell. 2016;36:540–549. - PMC - PubMed
    1. Jain M, et al. Metabolite profiling identifies a key role for glycine in rapid cancer cell proliferation. Science. 2012;336:1040–1044. - PMC - PubMed
    1. Sahu N, et al. Proline starvation induces unresolved ER stress and hinders mTORC1-dependent tumorigenesis. Cell Metab. 2016;24:753–761. - PubMed
    1. Olivares O, et al. Collagen-derived proline promotes pancreatic ductal adenocarcinoma cell survival under nutrient limited conditions. Nat. Commun. 2017;8:16031. - PMC - PubMed
    1. Commisso C, et al. Macropinocytosis of protein is an amino acid supply route in Ras-transformed cells. Nature. 2013;497:633–637. - PMC - PubMed

Publication types

MeSH terms