. 2020 Sep 16;11(1):4677.
doi: 10.1038/s41467-020-18453-1.

Translational induction of ATF4 during integrated stress response requires noncanonical initiation factors eIF2D and DENR

Affiliations

Translational induction of ATF4 during integrated stress response requires noncanonical initiation factors eIF2D and DENR

Deepika Vasudevan et al. Nat Commun. .

Abstract

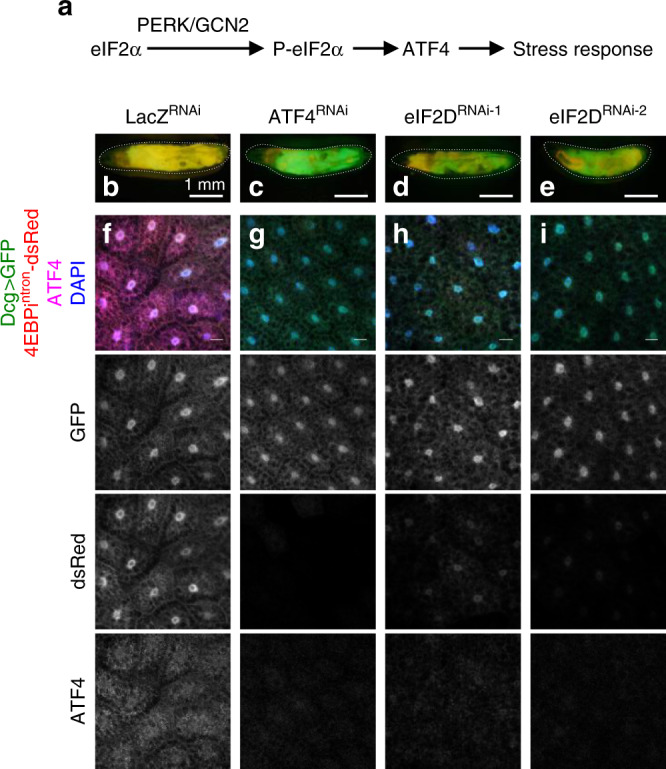
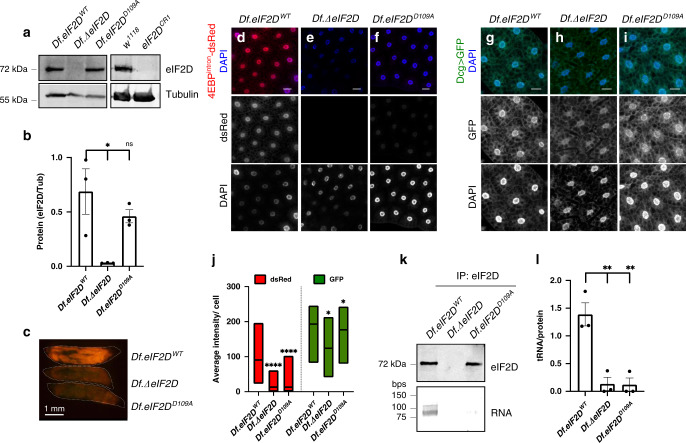
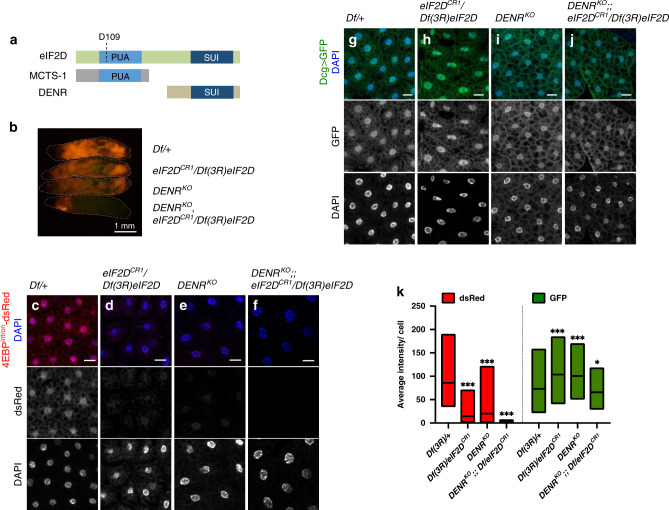
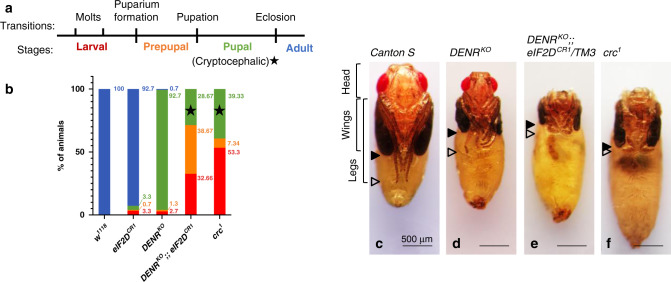
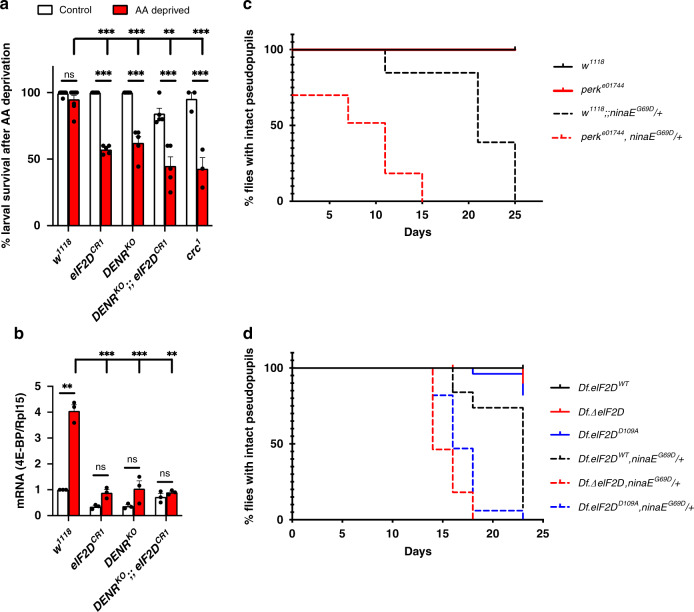
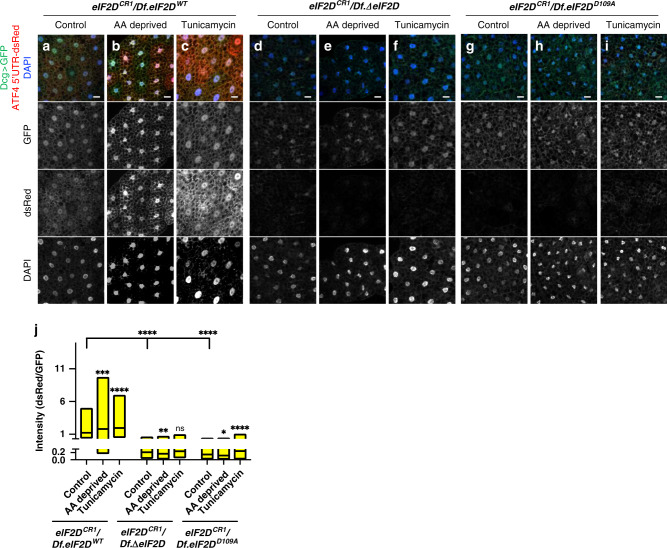
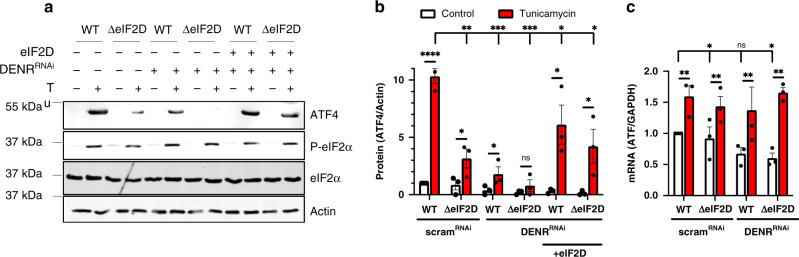
The Integrated Stress Response (ISR) helps metazoan cells adapt to cellular stress by limiting the availability of initiator methionyl-tRNA for translation. Such limiting conditions paradoxically stimulate the translation of ATF4 mRNA through a regulatory 5' leader sequence with multiple upstream Open Reading Frames (uORFs), thereby activating stress-responsive gene expression. Here, we report the identification of two critical regulators of such ATF4 induction, the noncanonical initiation factors eIF2D and DENR. Loss of eIF2D and DENR in Drosophila results in increased vulnerability to amino acid deprivation, susceptibility to retinal degeneration caused by endoplasmic reticulum (ER) stress, and developmental defects similar to ATF4 mutants. eIF2D requires its RNA-binding motif for regulation of 5' leader-mediated ATF4 translation. Consistently, eIF2D and DENR deficient human cells show impaired ATF4 protein induction in response to ER stress. Altogether, our findings indicate that eIF2D and DENR are critical mediators of ATF4 translational induction and stress responses in vivo.


Conflict of interest statement

The authors declare no competing interests.

Figures

Fig. 1
Fig. 1. An RNAi screen to identify genes required for ATF4 translation.
a Line diagram summarizing the ISR pathway in Drosophila. be Third instar larvae expressing 4E-BPintron-dsRed reporter with indicated RNAi lines and UAS-GFP driven by the fat body specific Dcg-Gal4. Individual larvae are outlined with dotted lines. Scale bars represent 1 mm. fi Fat body tissues dissected from larvae in be expressing GFP (green), dsRed (red), immunolabeled with antiATF4 antibody (magenta) and DAPI (blue). Scale bars represent 25 μm unless otherwise indicated here and in subsequent figures. Data in bi are representative images collected from two independent biological experiments with ten animals in each trial.
Fig. 2
Fig. 2. eIF2D is required for ATF4 expression and ISR signaling.
a Western blot analysis of larval extracts from various allelic combinations of eIF2D mutants. w1118 is the isogenic wild type control for eIF2DCR1. b Quantitation of data from western blots in a representing the mean of three independent biological replicates with error bars representing standard error. c Expression of 4E-BPintron-dsRed in control larvae (Df.eIF2DWT), eIF2D deletion mutant (Df.ΔeIF2D) and an eIF2D mutant where the tRNA-binding interface is disrupted (Df.eIF2DD109A). Individual larvae are shown in dotted outlines. df Fat body tissues dissected from larvae in c showing 4E-BPintron-dsRed (red), and counterstained with DAPI (blue). gi Fat body tissues from larvae of indicated genotypes expressing GFP (green) driven by the fat body specific driver, Dcg-GAL4, and counterstained with DAPI (blue). j Quantitation of fluorescent protein intensity from individual cells in df and gi. Midline represents the mean value, with the top and bottom of the box representing the maximum and minimum values. Asterisks above boxes represent statistical significances between mutant and control values. n = 278, 341, 231, 213, 335, and 395, respectively for each box from left to right. k Analysis of eluates from immunoprecipitation of eIF2D. Top panel shows western blot analysis of eluates and bottom panel shows TBE-UREA gel analysis of bound RNA. l. Quantification of data from k representing the mean of four biological replicates, with RNA levels for each sample normalized to respective protein levels. Data in ci are representative images collected from two independent biological experiments with ten animals in each trial. Statistical significance in b, j, and l were calculated using the two-tailed t-test with ****p < 0.00001, **p < 0.001, *p < 0.01 and n.s. not significant. Please see Source Data Files for the raw data in a, b, j, k, l.
Fig. 3
Fig. 3. eIF2D shares its function with DENR.
a A schematic diagram showing the domain architecture of eIF2D, DENR, and MCTS-1. b Expression of 4E-BPintron-dsRed in eIF2D and DENR single mutants (DENRKO) compared with that of DENR; eIF2D double mutants. Individual larvae are indicated with dotted outlines and their genotypes are indicated on the right. cf Fat body tissues dissected from larvae in b showing 4E-BPintron-dsRed (red) and DAPI (blue). gj Fat body tissues from larvae of indicated genotypes expressing GFP (green) driven by the fat body specific driver, Dcg-GAL4, and counterstained with DAPI. k Quantitation of fluorescent protein intensity from individual cells in cj. Midline represents the mean value, with the top and bottom of the box representing the maximum and minimum values. Asterisks above boxes represent statistical significances between mutant and control values calculated with the a two-tailed t-test with ***p < 0.0001 and *p < 0.01. n = 384, 370, 426, 362, 103, 158, 145, and 138, respectively for each box from left to right. Data in bj are representative images collected from three independent biological experiments with seven animals in each trial. Please see Source Data Files for the raw data used to generate graph in k.
Fig. 4
Fig. 4. DENR eIF2D double mutants resemble ATF4 mutants.
a Schematic of developmental transitions during the Drosophila life cycle. b Lethal phase analysis for control, eIF2D, DENR, DENR eIF2D double, and crc animals. Developmental stages are color-coded as shown in the schematic in a. Star symbol indicates animals that arrest during metamorphosis as cryptocephalic pupae. n = 150 for each genotype. cf Analysis of pupal morphology in dissected control (Canton S), DENR, DENR eIF2D/TM3, and crc mutant animals. Solid arrowheads indicate the degree of wing extension and outlined arrowheads indicate the extent of leg extension. An extended analysis of lethal phase and animal morphology can be found in Supplementary Information (Extended analysis of lethal phase and animal morphology). Data in cf are representative images collected from two independent biological experiments with ten animals in each trial. Scale bars are 500 μm.
Fig. 5
Fig. 5. eIF2D and DENR modulate stress response phenotypes.
a Survival rate of second instar larvae of the indicated genotypes when fed with normal food (white bars) or amino acid deprived food (4% sucrose, red bars) for 8 h. Data represent the mean from five independent experiments with 20 animals in each trial, and error bars represent standard error. b qPCR analysis of 4E-BP mRNA levels in larvae from a. Data are the mean from three independent experiments, with error bars representing standard error. In both a, b, p values were calculated using the two-tailed t-test with **p < 0.001, ***p < 0.0001 and n.s. not significant. c Photoreceptor degeneration in the ninaEG69D/+ adRP model in control and perk mutants as assessed by Rh1-GFP fluorescence that allows for visualization of photoreceptors in adult pseudopupils. Note that the lines for w1118 (solid black) and perke01744 (solid red) overlap. The difference in the course of retinal degeneration between the following pairs is statistically significant as assessed by the Log-rank (Mantel-Cox) test (p < 0.0001): w1118 and w1118;;ninaEG69D/+, perke01744 and perke01744,ninaEG69D/+, w1118;;ninaEG69D/+ and perke01744,ninaEG69D/+. (n = 100). d Photoreceptor degeneration with ninaEG69D/+ monitored in various eIF2D mutant backgrounds. Note that the curves for the control Df.eIF2DWT (solid black), Df.ΔeIF2D (solid red) and Df.eIF2DD109A (solid blue) overlap for the early time points. The difference in the course of retinal degeneration between the following pairs is statistically significant as assessed by Log-rank (Mantel-Cox) test (p < 0.0001): Df.eIF2DWT and Df.eIF2DWT,ninaEG69D/+, Df.ΔeIF2D and Df.ΔeIF2D,ninaEG69D/+, Df.ΔeIF2D and Df.ΔeIF2D,ninaEG69D/+, Df.eIF2DWT,ninaEG69D/+ and Df.ΔeIF2D,,ninaEG69D/+, Df.eIF2DWT,ninaEG69D/+ and Df.eIF2DD109A,ninaEG69D/+. (n = 100). Please see Source Data Files for the raw data in ad.
Fig. 6
Fig. 6. eIF2D and DENR regulate the translation of the ATF4 ORF.
ai Expression of the ATF4 5′UTR-dsRed reporter in fat bodies of control (Df.eIF2DWT), eIF2D transheterozygous null (Df.ΔeIF2D) and point (Df.eIF2DD109A) mutants. The reporter utilizes a dsRed reporter bearing a nuclear localization sequence. Control GFP expression is driven by Dcg-GAL4. Larvae in b, e, h were subjected to 4 h of amino acid deprivation and those in c, f, i were fed Tunicamycin for 4 h. Data are representative images collected from two independent biological experiments with ten animals in each trial. j Quantification of the ATF4 5′UTR-dsRed reporter intensities normalized to corresponding GFP intensities from the same cells. Midline represents the mean value, with the top and bottom of the box representing the maximum and minimum values. Asterisks above the boxes represent statistical significances between mutant and control values calculated with the a two-tailed t-test with ***p < 0.0001 and *p < 0.01. n = 158, 157, 112, 104, 139, 131, 120, 148, and 137, respectively for each box from left to right. Please see Source Data Files for raw data.
Fig. 7
Fig. 7. Regulation of ATF4 by eIF2D and DENR is conserved in human cells.
a Western blots of total cell lysates from control human HAP1 cells (WT) or equivalent cells with CRISPR-Cas9 mediated deletion of the eIF2D locus (ΔeIF2D). Cells were transfected with scrambled RNAi or DENR RNAi, and treated with DMSO or Tunicamycin (Tu, 10 μg/ml). pcDNA-heIF2D was used to re-introduce human eIF2D into cells. The blots were probed with antibodies recognizing ATF4 (panel 1), phospho-eIF2α (panel 2), total eIF2α (panel 3), and actin (panel 4). b Quantitation of ATF4 protein levels in a as normalized to the loading control (actin). Data are the mean of 3 independent experiments. c qPCR analysis of ATF4 mRNA in HAP1 cells from a normalized to GAPDH. Data are the mean of three independent experiments. Error bars represent standard error, p values were calculated using the two-tailed t-test with *p < 0.01, **p < 0.001, ****p < 0.00001 and n.s. not significant. Please see Source Data Files for raw data in ac.

References

    1. Delépine M, et al. EIF2AK3, encoding translation initiation factor 2-alpha kinase 3, is mutated in patients with Wolcott-Rallison syndrome. Nat. Genet. 2000;25:406–409. - PubMed
    1. Harding HP, et al. Diabetes mellitus and exocrine pancreatic dysfunction in perk-/- mice reveals a role for translational control in secretory cell survival. Mol. Cell. 2001;7:1153–1163. - PubMed
    1. Zhang P, et al. The PERK eukaryotic initiation factor 2 alpha kinase is required for the development of the skeletal system, postnatal growth, and the function and viability of the pancreas. Mol. Cell. Biol. 2002;22:3864–3874. - PMC - PubMed
    1. Back SH, et al. Translation attenuation through eIF2alpha phosphorylation prevents oxidative stress and maintains the differentiated state in beta cells. Cell Metab. 2009;10:13–26. - PMC - PubMed
    1. Iida K, Li Y, McGrath BC, Frank A, Cavener DR. PERK eIF2 alpha kinase is required to regulate the viability of the exocrine pancreas in mice. BMC Cell Biol. 2007;8:38. - PMC - PubMed

Publication types

MeSH terms

LinkOut - more resources