. 2020 Sep 16;10(1):15183.
doi: 10.1038/s41598-020-72197-y.

Experimental autoimmune encephalomyelitis is associated with changes of the microbiota composition in the gastrointestinal tract

Affiliations

Experimental autoimmune encephalomyelitis is associated with changes of the microbiota composition in the gastrointestinal tract

David M Johanson 2nd et al. Sci Rep. .

Abstract

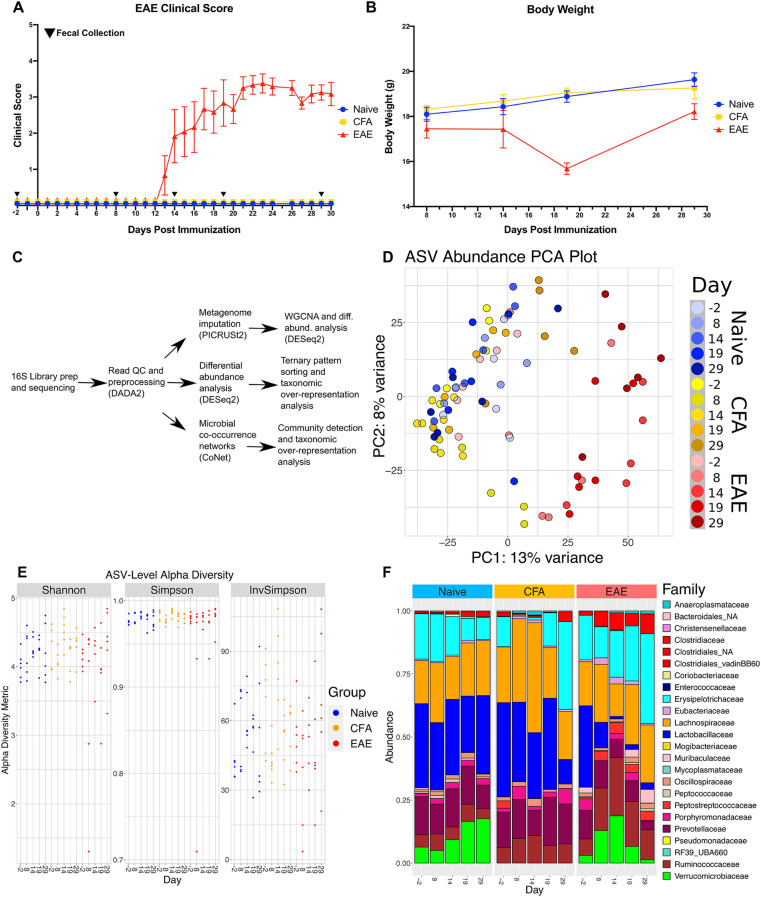
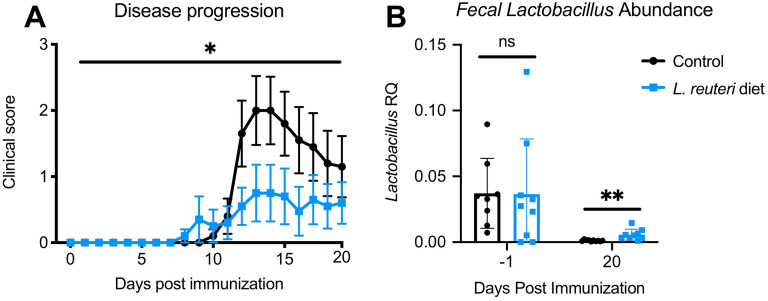
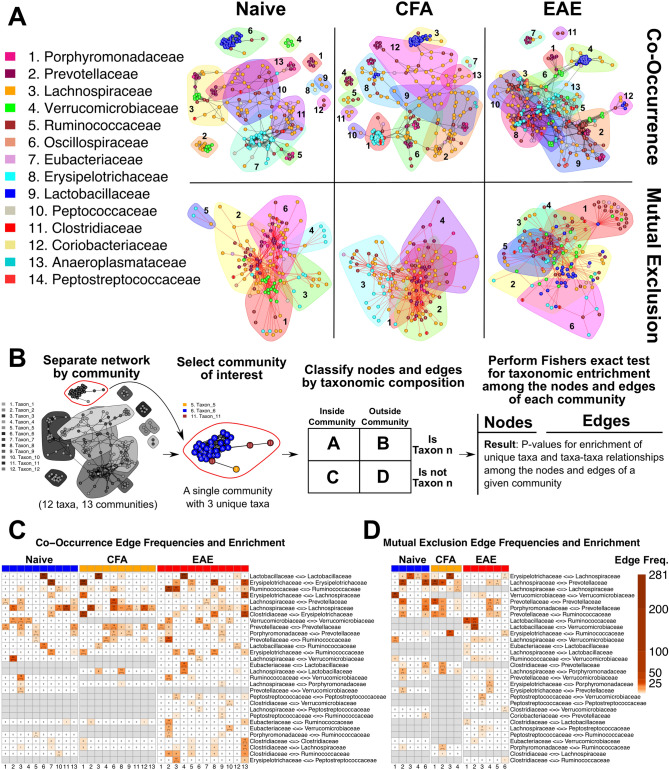
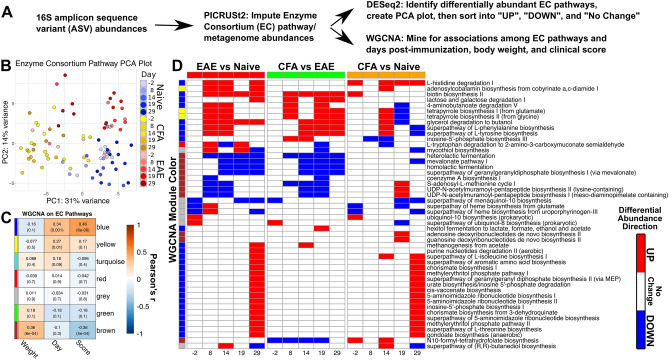
The gut microbiome is known to be sensitive to changes in the immune system, especially during autoimmune diseases such as Multiple Sclerosis (MS). Our study examines the changes to the gut microbiome that occur during experimental autoimmune encephalomyelitis (EAE), an animal model for MS. We collected fecal samples at key stages of EAE progression and quantified microbial abundances with 16S V3-V4 amplicon sequencing. Our analysis of the data suggests that the abundance of commensal Lactobacillaceae decreases during EAE while other commensal populations belonging to the Clostridiaceae, Ruminococcaceae, and Peptostreptococcaceae families expand. Community analysis with microbial co-occurrence networks points to these three expanding taxa as potential mediators of gut microbiome dysbiosis. We also employed PICRUSt2 to impute MetaCyc Enzyme Consortium (EC) pathway abundances from the original microbial abundance data. From this analysis, we found that a number of imputed EC pathways responsible for the production of immunomodulatory compounds appear to be enriched in mice undergoing EAE. Our analysis and interpretation of results provides a detailed picture of the changes to the gut microbiome that are occurring throughout the course of EAE disease progression and helps to evaluate EAE as a viable model for gut dysbiosis in MS patients.


Conflict of interest statement

The authors declare no competing interests.

Figures

Figure 1
Figure 1
Microbiome dysbiosis is initiated following CFA and MOG immunization. (A) EAE clinical scores and (B) Weights of the 3 groups (Two-way ANOVA revealed that Time and Treatment accounted for 15.40% and 41.01% of variation respectively. P = 0.0121 and P < 0.0001 for each source). Black triangles represent days of fecal collection for 16S-seq libraries during course of experiment. (C) Workflow representing the bioinformatics applications and analyses applied to the 16S-seq dataset. The three main approaches include: differential abundance analysis, co-occurrence network analysis, and PICRUSt2 metagenome imputation. (D) PCA plot representing the first two principal components of the 16S ASV dataset after normalization and application of the variance-stabilizing transformation in DESeq2. Point color represents treatment group and days since immunization. (E) The Shannon, Simpson, and Inverse Simpson alpha diversity metrics for each sample plotted against dpi and colored by treatment group. Values were calculated with Phyloseq and are available in Table S3. (F) Stacked barplot of the relative abundances of each identified bacterial family. Relative abundances were derived from raw ASV abundances that had been grouped by family. Family bars are stacked in alphabetical order as they appear in the legend.
Figure 2
Figure 2
Differential abundance analysis reveals key taxa changes. (A) Stacked barplot of DESeq2 log2 fold change values for pairwise comparisons across experimental group. Each bar represents an individual pairwise comparison between two experimental groups made at a specific time point. Tree represents approximate taxonomy of the bacterial families and was determined by manual supplementation of NCBI taxonomy. (B) Schematic illustrating the process of creating ternary patterns and performing taxonomic over-representation analysis on each ternary pattern and taxa pairing. Differential abundance analysis was performed at specified taxonomic levels allowing for the identification of ASVs with different patterns from their parental taxa. Fisher’s exact test for enrichment of ternary patterns among the ASVs of a given taxon was applied. Results were compared to the ternary pattern derived from the entire taxon as well, yielding new insight. This testing framework was applied independently for each ternary pattern. (C) Normalized abundances for four bacterial families of interest that were identified from differential abundance analysis results or taxonomic over-representation analysis results. Dots represent normalized count abundances of individual samples and are plotted against time. (D) Heatmap of taxonomic over-representation analysis results. Color is scaled from 0 to 0.05 and represents the BH-adjusted P-value derived from Fisher’s exact test for enrichment of ternary pattern among a taxon.
Figure 3
Figure 3
Treatment with L. reuteri is protective in EAE. (A) Mice fed with L. reuteri present with lower clinical scores than Broth control (Wilcoxon matched-pairs signed-rank test: p-value = 0.0132, n = 10 per group). (B) qPCR with Lactobacillus specific primers revealed that abundance of L. reuteri is elevated in mice fed with supplemented diet 20 dpi (Paired t-tests at − 1 and 20 dpi: P-values = 0.9716 and 0.0054, n = 10 per group).
Figure 4
Figure 4
Co-occurrence network analysis with the ReBoot algorithm reveals novel community interactions in EAE. (A) Color-coded network graph representations of the co-occurrence and mutual exclusion interactions among ASVs. White numbers within nodes correspond to numbering in the legend. Transparent shapes represent network communities determined by the Louvain modularity algorithm. Black numbering corresponds to the numbering given to distinguish communities within each network. (B) Schematic representing the process for calculating taxonomic over-representation with respect to the nodes and edges within a community. Networks are split by community membership and tested for over-representation of all taxa and all unique taxa-taxa pairings within the community of interest. Fisher’s exact test is applied on two-way contingency tables that distinguish nodes by community membership and taxonomic membership. Testing framework is performed independently for each network. (C) Heatmap of BH-adjusted P-values for over-representation of unique edges among the communities of each co-occurrence network. Each row represents a unique edge connecting two distinct families. Each column is a community in one of the three networks. Cell color corresponds to edge frequency within each network and each cell contains an edge frequency number followed by a significance level in parentheses (Blank = n.s., *P ≤ 0.05, **P ≤ 0.01, ***P ≤ 0.001, ****P ≤ 0.0001). Heatmap has been filtered to only contain edges of interest and communities with at least one significant P-value among these edges. Grey cells represent edges that were entirely absent from the network they appear under. Columns represent unique communities in each network. (D) Heatmap representing BH-adjusted P-values for over-representation of unique edges among the communities of each mutual exclusion network following the same construction methods and conventions as (B). Columns represent unique communities in each network. The manually selected edges of interest are different from those in (C).
Figure 5
Figure 5
Abundance derived metagenomics data highlight putative EAE induced metabolic changes. (A) Investigation of PICRUSt2-imputed data involved applications of WGCNA and DESeq2 differential abundance analysis to identify groups of MetaCyc EC accessions and pathways potentially associated with EAE. EC pathways and EC accessions were analyzed independently. (B) PCA plot of first two principal components of EC pathway data. Raw output from PICRUST2 was normalized and subject to a variance-stabilizing transformation within DESeq2. Samples from each groups diverge as dpi increases. (C) Heatmap of modules derived from WGCNA on EC pathways. Cell color represents Pearson’s r between the first principal component of each module and clinical score, dpi, and body weight. Vertical color bar represents the color for each WGCNA module. Cells contain the rounded Pearson’s r and P-values in parentheses. (D) Curated heatmap of log2 fold changes of DESeq2 differential abundance analysis when applied to the EC pathway abundances. Cell color represents the directionality and significance of the log2 fold change vales for each pairwise comparison. Red represents significant increase (P ≤ 0.05, L2FC > 0), blue represents significant decrease (P ≤ 0.05, L2FC < 0), and white represents no significant change (P > 0.05). Each row represents an EC pathway of interest and column numbering represents the dpi that a pairwise comparison was made. Vertical color bar conforms to the same convention as (C) and denotes the module membership of each EC pathway.

References

    1. Compston A, Coles A. Multiple sclerosis. Lancet. 2008;372:1502–1517. doi: 10.1016/S0140-6736(08)61620-7. - DOI - PubMed
    1. Bielekova B, et al. Expansion and functional relevance of high-avidity myelin-specific CD4+ T cells in multiple sclerosis. J. Immunol. 2004;172:3893–3904. doi: 10.4049/jimmunol.172.6.3893. - DOI - PubMed
    1. Berer K, et al. Gut microbiota from multiple sclerosis patients enables spontaneous autoimmune encephalomyelitis in mice. Proc. Natl. Acad. Sci. USA. 2017;114:10719–10724. doi: 10.1073/pnas.1711233114. - DOI - PMC - PubMed
    1. Hooper LV, Littman DR, Macpherson AJ. Interactions between the microbiota and the immune system. Science. 2012;336:1268–1273. doi: 10.1126/science.1223490. - DOI - PMC - PubMed
    1. Jangi S, et al. Alterations of the human gut microbiome in multiple sclerosis. Nat. Commun. 2016;7:12015. doi: 10.1038/ncomms12015. - DOI - PMC - PubMed

Publication types

Substances