. 2020 Sep 16;10(1):15161.
doi: 10.1038/s41598-020-72193-2.

New insights and best practices for the successful use of Empirical Mode Decomposition, Iterative Filtering and derived algorithms

Affiliations

New insights and best practices for the successful use of Empirical Mode Decomposition, Iterative Filtering and derived algorithms

Angela Stallone et al. Sci Rep. .

Abstract

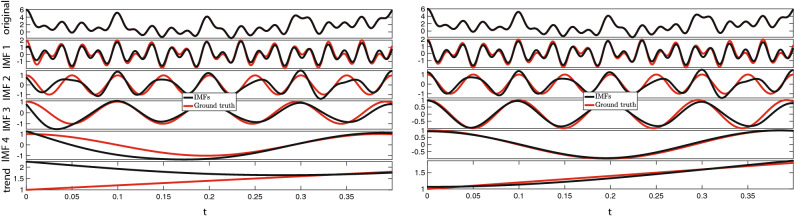
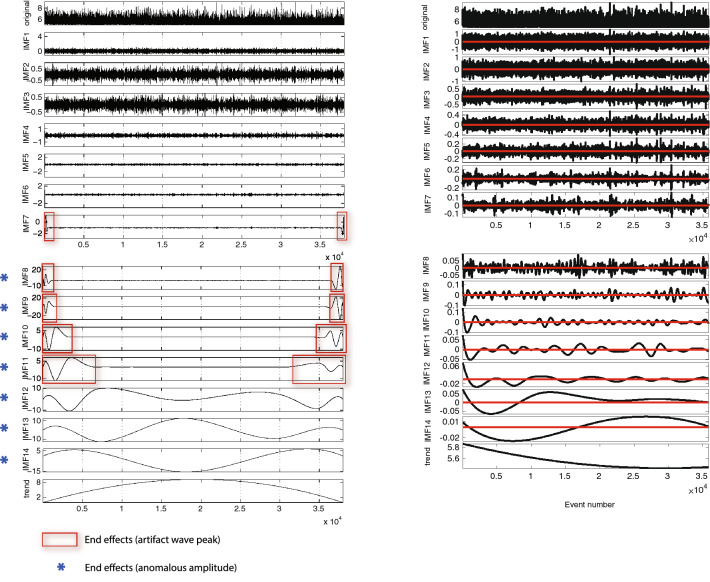
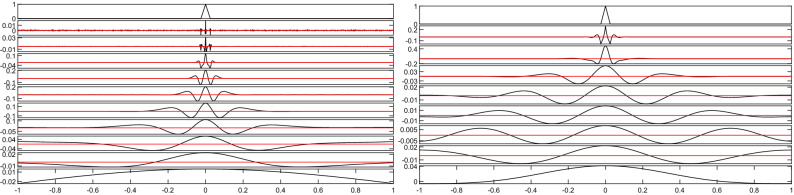
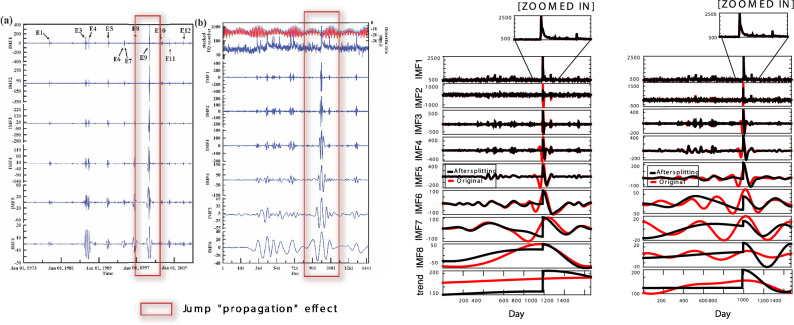
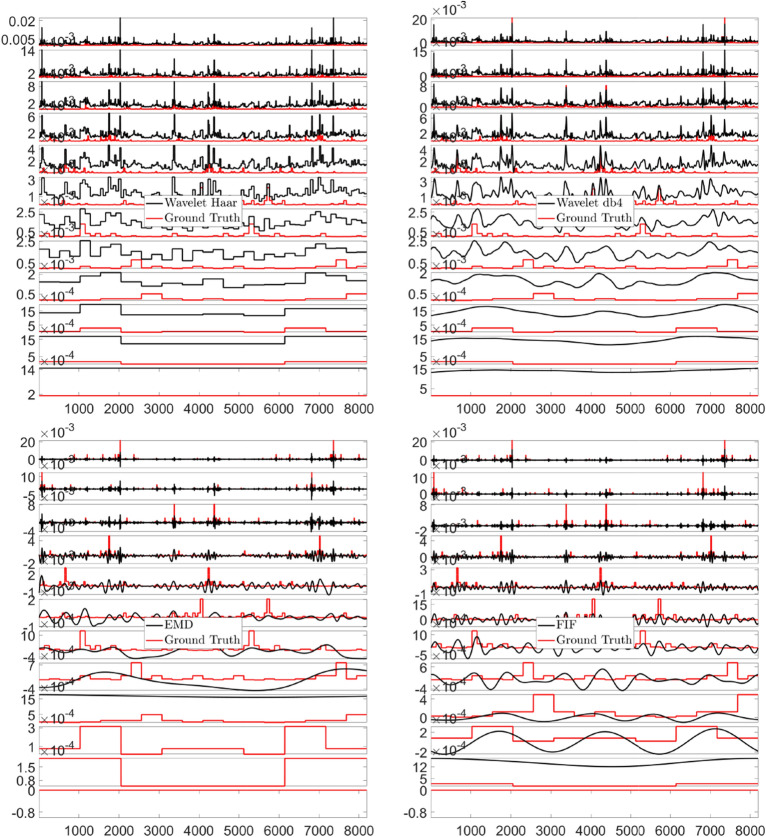
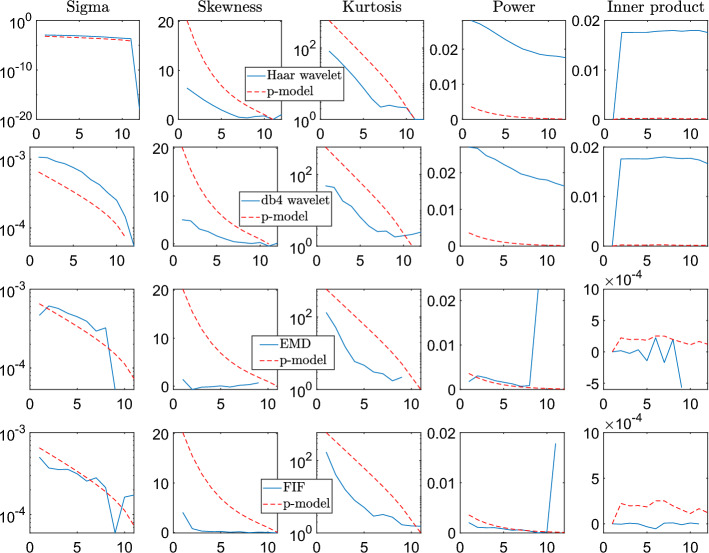
Algorithms based on Empirical Mode Decomposition (EMD) and Iterative Filtering (IF) are largely implemented for representing a signal as superposition of simpler well-behaved components called Intrinsic Mode Functions (IMFs). Although they are more suitable than traditional methods for the analysis of nonlinear and nonstationary signals, they could be easily misused if their known limitations, together with the assumptions they rely on, are not carefully considered. In this work, we examine the main pitfalls and provide caveats for the proper use of the EMD- and IF-based algorithms. Specifically, we address the problems related to boundary errors, to the presence of spikes or jumps in the signal and to the decomposition of highly-stochastic signals. The consequences of an improper usage of these techniques are discussed and clarified also by analysing real data and performing numerical simulations. Finally, we provide the reader with the best practices to maximize the quality and meaningfulness of the decomposition produced by these techniques. In particular, a technique for the extension of signal to reduce the boundary effects is proposed; a careful handling of spikes and jumps in the signal is suggested; the concept of multi-scale statistical analysis is presented to treat highly stochastic signals.


Conflict of interest statement

The authors declare no competing interests.

Figures

Figure 1
Figure 1
Boundary problems Synthetic Example. EMD results are compared with the analytical solution (“ground truth”). Left: EMD decomposition of the original signal (we show the first 1000 points). There are clear errors induced by EMD nearby the boundary. Right: EMD decomposition after pre-extending symmetrically left and right and made periodical the original signal, as described in “Problems with the boundaries”.
Figure 2
Figure 2
Boundary problems Real Life Example. Left: Adapted from Sarlis et al. paper. EMD decomposition of the magnitude time-series of GCMT collected from 1 January 1976 to 1 October 2014. The red boxes highlight artifact wave peaks at the boundaries of the IMFs, while the blue asterisks pinpoint anomalous IMFs amplitudes (larger than the original signal). Right: Decomposition of the GCMT magnitude time-series from January 1st 1976 to October 1st 2014 produced using the EEMD function released on March 04 2009 by Zhaohua Wu. The red line in each panel represents the zero reference line. Total computational time: 213.9069 s.
Figure 3
Figure 3
Spikes and jumps synthetic example. EEMD and FIF decompositions depicted in the left and right panels, respectively. The red line in each panel represents the zero reference line. Total computational time: 70.6450 s (EEMD), 0.1355 s (FIF).
Figure 4
Figure 4
Spikes and jumps real life example. Adapted from Chen et al.. Left: From top to bottom, the first six IMFs of the non-stacked data of the number of daily earthquakes from the Taiwanese catalog for events of magnitude ML3.0 from 1978 to 2008. Center Left: The top row shows the temporal variations in theoretical Earth tides at the center of Taiwan with a period of 1462 days (red) and the stacked data of daily earthquake numbers (blue). The second to seventh row display the first six IMFs that were extracted from the stacked time series by Chen et al. In both panels, red boxes highlight the artifacts induced by a jump, in the original time series, which “propagates” through all the IMFs. Center Right and Right: Comparisons of the IMFs produced using EMD and FIF, respectively. The time signal in the first panel is zoomed in to highlight the jump. In red the decompositions obtained using the original stacked data set, and in black the ones obtained after splitting the time series into two disjoint subsets. In particular, we split it at the highest jump, in position 988. We use symmetric extension to produce all the results. Total computational time: 0.3479 s (EMD—splitted signal), 0.0511 s (EMD—original data set), 0.3243 s (FIF—splitted signal), 0.0526 s (FIF—original data set).
Figure 5
Figure 5
Stochastic signals—P-model Example. From Top left to Bottom right corner, Haar and db4 Wavelet, EMD and FIF decompositions, respectively. In solid red the corresponding ground truth uk generations. In each panel, the x-axis plots the sample points, and the y-axis the IMFs ordered from top to bottom.
Figure 6
Figure 6
Stochastic signals—P-model Example. From Top to Bottom rows, multiscale statistical analysis of the Haar and Daubechies 4 Wavelet, EMD, and FIF decompositions, respectively. Different statistical quantities are plotted with respect to the IMF number, from left to right columns: standard deviation (sigma), skewness, kurtosis, power and inner product of two subsequent levels. In dashed red the ground truth values.

References

    1. Bracewell R. N, Bracewell R. N. The Fourier transform and its applications. New York: McGraw-Hill; 1986.
    1. Cicone, A. Nonstationary signal decomposition for dummies. in Advances in Mathematical Methods and High Performance Computing 69–82 (Springer, New York, 2019).
    1. Cohen L. Time-frequency analysis. New York: Prentice hall; 1995.
    1. Daubechies I, Lu J, Wu HT. Synchrosqueezed wavelet transforms: An empirical mode decomposition-like tool. Appl. Comput. Harmonic Anal. 2011;30:243–261. doi: 10.1016/j.acha.2010.08.002. - DOI
    1. Auger F, et al. Time-frequency reassignment and synchrosqueezing: An overview. IEEE Signal Process. Mag. 2013;30:32–41. doi: 10.1109/MSP.2013.2265316. - DOI