. 2020 Jun 19;9(1):1759926.
doi: 10.1080/20013078.2020.1759926.

Actin reorganization at the centrosomal area and the immune synapse regulates polarized secretory traffic of multivesicular bodies in T lymphocytes

Affiliations

Actin reorganization at the centrosomal area and the immune synapse regulates polarized secretory traffic of multivesicular bodies in T lymphocytes

Ana Bello-Gamboa et al. J Extracell Vesicles. .

Abstract

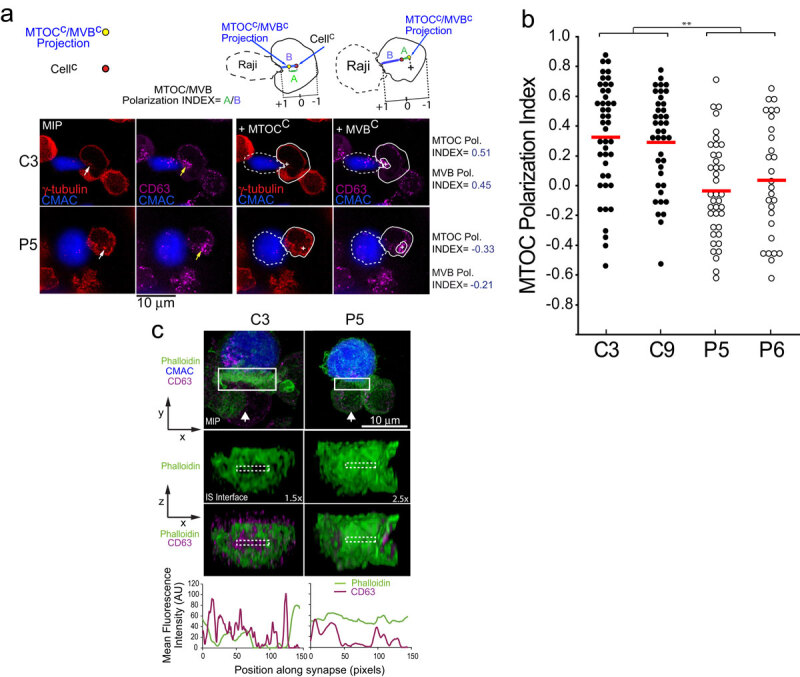
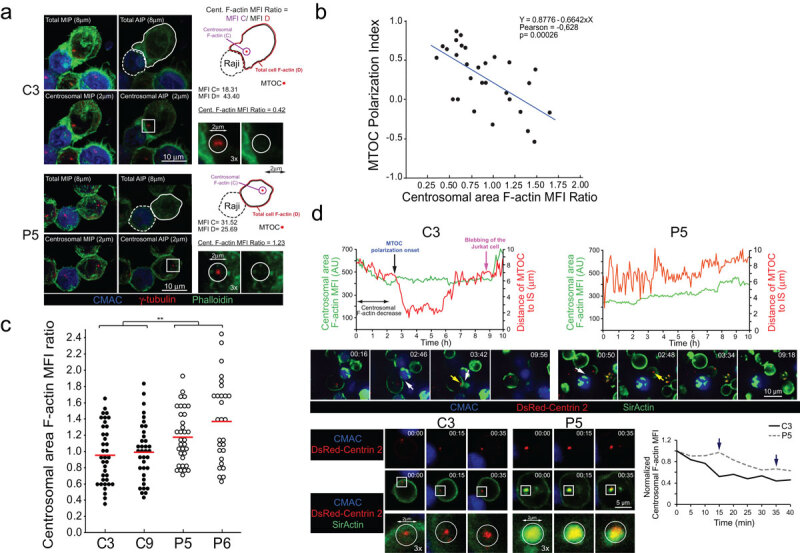
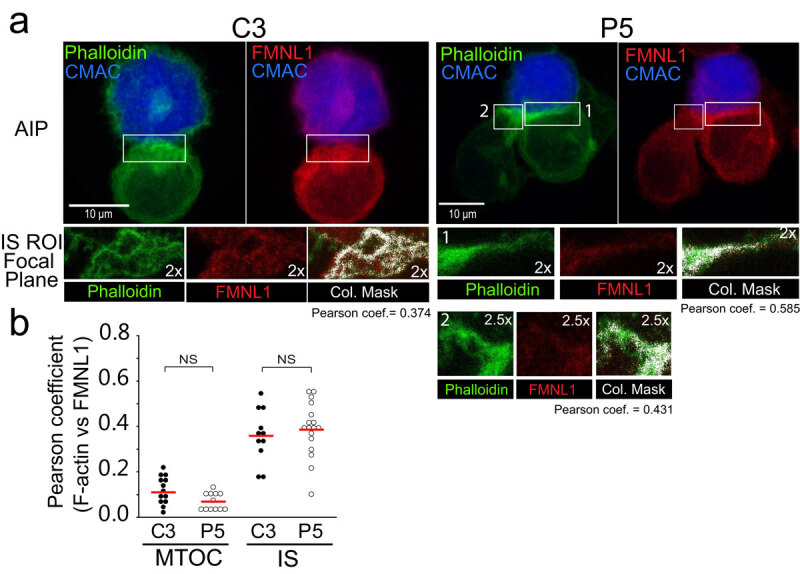
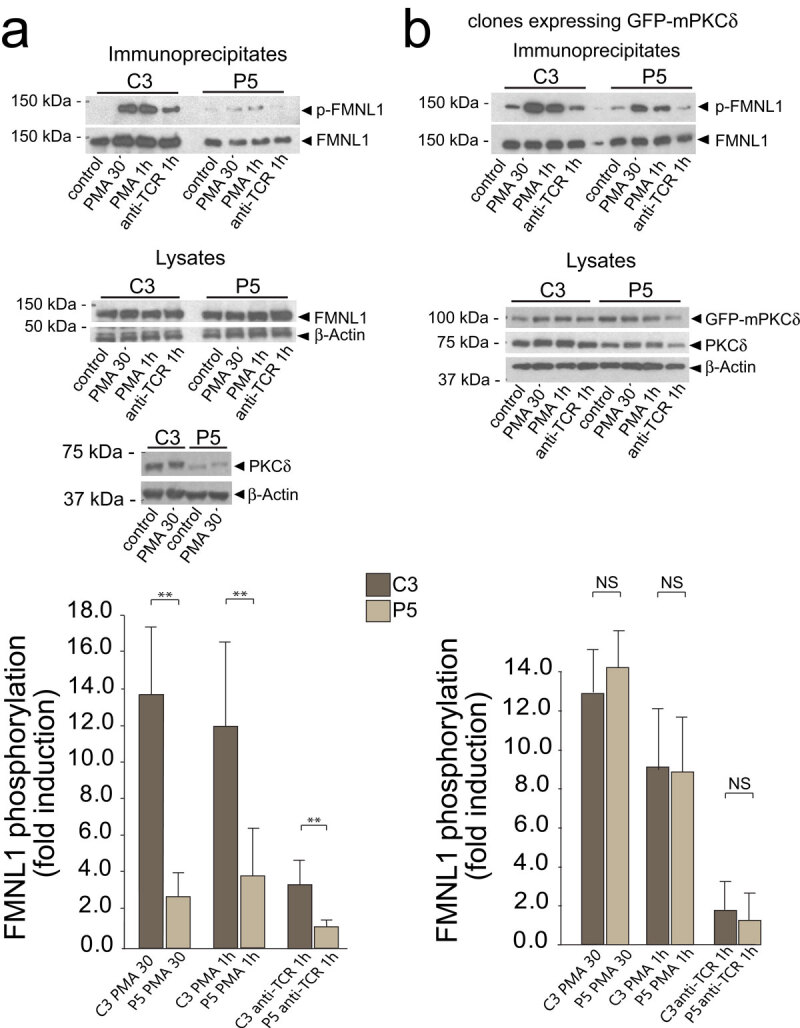
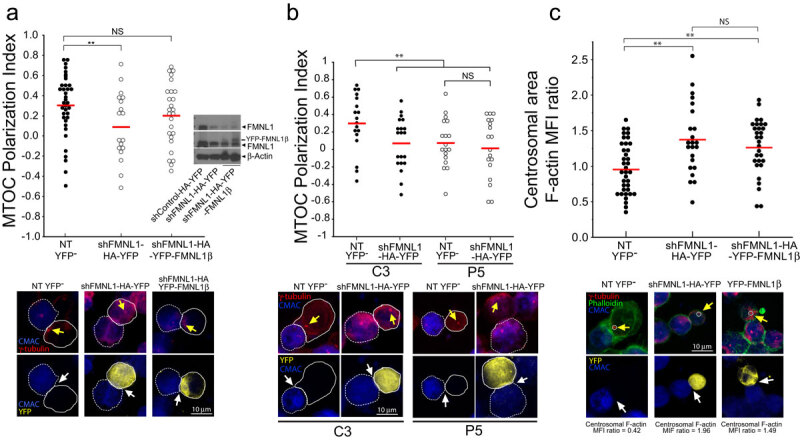
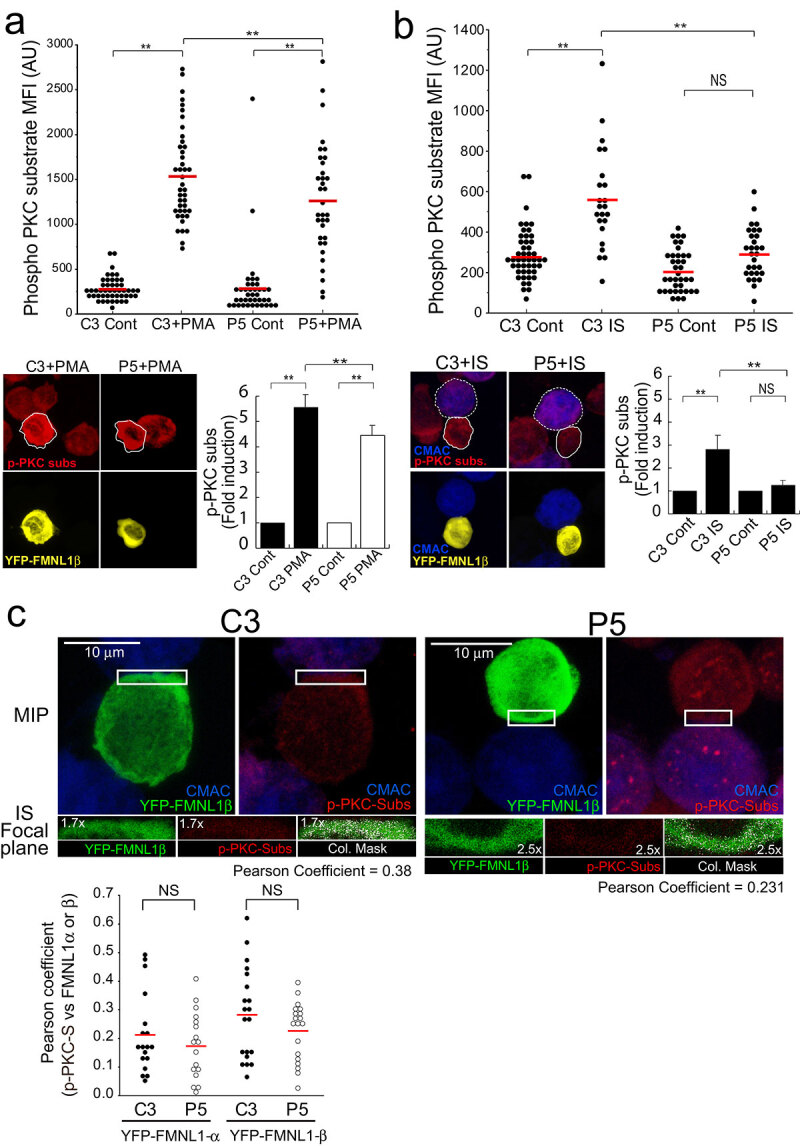
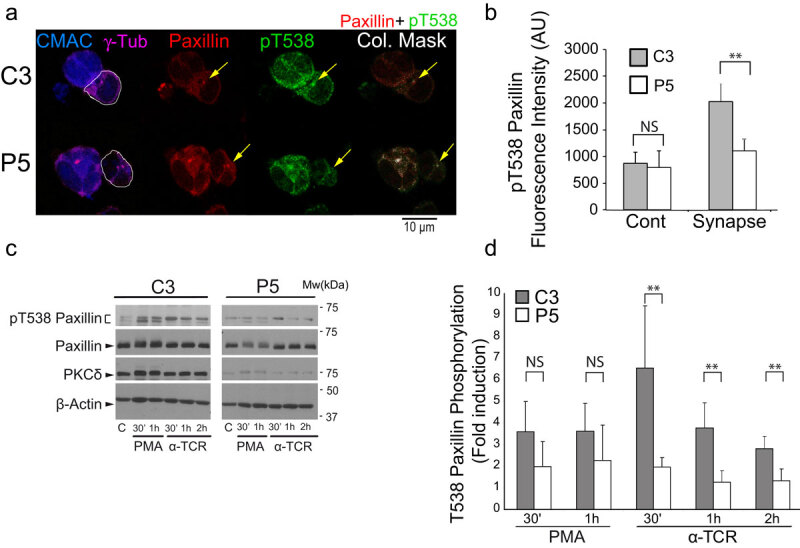
T-cell receptor stimulation induces the convergence of multivesicular bodies towards the microtubule-organizing centre (MTOC) and the polarization of the MTOC to the immune synapse (IS). These events lead to exosome secretion at the IS. We describe here that upon IS formation centrosomal area F-actin decreased concomitantly with MTOC polarization to the IS. PKCδ-interfered T cell clones showed a sustained level of centrosomal area F-actin associated with defective MTOC polarization. We analysed the contribution of two actin cytoskeleton-regulatory proteins, FMNL1 and paxillin, to the regulation of cortical and centrosomal F-actin networks. FMNL1 β phosphorylation and F-actin reorganization at the IS were inhibited in PKCδ-interfered clones. F-actin depletion at the central region of the IS, a requirement for MTOC polarization, was associated with FMNL1 β phosphorylation at its C-terminal, autoregulatory region. Interfering all FMNL1 isoforms prevented MTOC polarization; nonetheless, FMNL1 β re-expression restored MTOC polarization in a centrosomal area F-actin reorganization-independent manner. Moreover, PKCδ-interfered clones exhibited decreased paxillin phosphorylation at the MTOC, which suggests an alternative actin cytoskeleton regulatory pathway. Our results infer that PKCδ regulates MTOC polarization and secretory traffic leading to exosome secretion in a coordinated manner by means of two distinct pathways, one involving FMNL1 β regulation and controlling F-actin reorganization at the IS, and the other, comprising paxillin phosphorylation potentially controlling centrosomal area F-actin reorganization.

Abbreviations: Ab, antibody; AICD, activation-induced cell death; AIP, average intensity projection; APC, antigen-presenting cell; BCR, B-cell receptor for antigen; C, centre of mass; cent2, centrin 2; cIS, central region of the immune synapse; CMAC, CellTracker™ Blue (7-amino-4-chloromethylcoumarin); cSMAC, central supramolecular activation cluster; CTL, cytotoxic T lymphocytes; DAG, diacylglycerol; DGKα, diacylglycerol kinase α; Dia1, Diaphanous-1; dSMAC, distal supramolecular activation cluster; ECL, enhanced chemiluminescence; ESCRT, endosomal sorting complex required for traffic; F-actin, filamentous actin; Fact-low cIS, F-actin-low region at the centre of the immune synapse; FasL, Fas ligand; FMNL1, formin-like 1; fps, frames per second; GFP, green fluorescent protein; HBSS, Hank's balanced salt solution; HRP, horseradish peroxidase; ILV, intraluminal vesicles; IS, immune synapse; MFI, mean fluorescence intensity; MHC, major histocompatibility complex; MIP, maximal intensity projection; MVB, multivesicular bodies; MTOC, microtubule-organizing centre; NS, not significant; PBL, peripheral blood lymphocytes; PKC, protein kinase C; PKCδ, protein kinase C δ isoform; PLC, phospholipase C; PMA, phorbol myristate acetate; Pol. Index, polarization index; pSMAC, peripheral supramolecular activation cluster; PSF, point spread function; ROI, region of interest; SD, standard deviation; shRNA, short hairpin RNA; SEE, Staphylococcus enterotoxin E; SMAC, supramolecular activation cluster; TCR, T-cell receptor for antigen; T-helper (Th); TRANS, transmittance; WB, Western blot.

Keywords: FMNL1; T lymphocytes; actin cytoskeleton; centrosome; immune synapse; multivesicular bodies; paxillin; protein kinase C δ.


Conflict of interest statement

The authors report no conflict of interest.

Figures

Figure 1.
Figure 1.
PKCδ regulates MTOC and MVB polarization.
Figure 2.
Figure 2.
PKCδ regulates centrosomal area F-actin.
Figure 3.
Figure 3.
Subcellular localization of FMNL1.
Figure 4.
Figure 4.
PKCδ regulates FMNL1 phosphorylation.
Figure 5.
Figure 5.
FMNL1 interference affects both centrosomal area F-actin and MTOC polarization. FMNL1β regulates MTOC polarization. C3 control and P5 PKCδ-interfered clones were transfected with either control (shControl-HA-YFP), FMNL1 interfering (shFMNL1-HA-YFP), or FMNL1-interfering, YFP-FMNL1β expressing vector (shFMNL1-HA-YFP-FMNL1β). Subsequently, the transfected clones were challenged with CMAC-labelled SEE-pulsed Raji cells for 1 h, fixed, stained with anti-γ-tubulin AF546 (red) and phalloidin AF647 (green) to label F-actin, and imaged by confocal fluorescence microscopy. Yellow channel fluorescence identifies the transfected cells. Panel A, upper diagram, MTOC Pol. Index was calculated as indicated above, for the indicated number of synaptic conjugates made by C3 control clone, transfected or not (NT YFP cells). Dot plot distribution and average Pol. Index (red horizontal line) are represented. In the inset, WB of cell lysates from the different groups of cells used was developed with anti-FMNL1 (two different expositions) and anti-β-actin to check for both FMNL1 interference and HA-YFP-FMNL1β expression. Lower panels, representative synapses made by C3 clone, transfected or not (NT YFP). This group includes all non-transfected cells from both shFMNL1-HA-YFP and shFMNL1-HA-YFP-FMNL1β-tansfections as internal controls. AIPs of the indicated, merged channels for C3 clone forming synapses are represented. Raji cells and Jurkat clones are labelled with discontinuous and continuous white lines, respectively. Panel (b), upper diagram, MTOC Pol. Index was calculated as indicated in Figure 1, panels A and B, for the synaptic conjugates made by C3, (control) and P5 (PKCδ-interfered) clones, transfected or not (NT YFP). Dot plot distribution and average Pol. Index (red horizontal line) are represented. Lower panels, representative synapses made by the different clones, transfected or not (NT YFP). AIPs of the indicated, merged channels for both C3 and P5 clones forming synapses are represented. White arrows indicate the synaptic area, whereas yellow arrows indicate the MTOC position. Panel C, upper diagram, centrosomal area F-actin MFI ratio was calculated as indicated in Figure 2 for the indicated number of synaptic conjugates made by C3 control clone, transfected or not (NT YFP). The mean centrosomal area F-actin MFI ratio (red horizontal line) for each condition is represented. Lower panels, representative synapses made by C3 clone, transfected or not (NT YFP). AIPs of the indicated, merged channels for C3 clone forming synapses are represented. The centrosomal area F-actin MFI ratio value is indicated for each condition. The MTOC is labelled with yellow arrow and the synapses with white arrows. The white circle enclosing the MTOC labels the ROI used to calculate the centrosomal F-actin MFI. NS, not significant. **, p ≤ 0.05.
Figure 6.
Figure 6.
PKCδ induces FMNL1β phosphorylation. C3 control and P5 PKCδ-interfered clones were transfected with an FMNL1-interfering, HA-YFP-FMNL1β-expressing vector (shFMNL1-HA-YFP-FMNL1β). Subsequently, the transfected clones were either untreated (Cont), or stimulated with PMA (30 min), or challenged with CMAC-labelled SEE-pulsed Raji cells for 1 h, fixed, stained with anti-Phospho-(Ser) PKC substrate AF647 (magenta) and imaged by confocal fluorescence microscopy. Yellow channel fluorescence identifies the HA-YFP-FMNL1β−expressing  cells. (Panel A), upper plot, Phospho-(Ser) PKC substrate MFI in the indicated (white line) cell ROI was calculated as described in Materials and Methods for C3 control and P5 clones expressing HA-YFP-FMNL1β either non-stimulated (Cont) or PMA-stimulated. The red line indicates the average Phospho-(Ser) PKC substrate MFI for each group. In the lower panel, left side, representative AIPs of the indicated channels of the transfected clones, stimulated with PMA, are shown. In the right side, quantification of Phospho-(Ser) PKC substrate MFI in C3 control and P5 clones expressing HA-YFP-FMNL1β, either non-stimulated (Cont) or PMA-stimulated, represented as fold induction of Phospho-(Ser) PKC substrate MFI (mean±SD), summarizing the results obtained in several (n = 4) experiments. Panel B, upper diagram, calculation of the Phospho-(Ser) PKC substrate MFI in the specified (continuous white line) cell ROI was calculated as indicated in Materials and Methods, for C3 control and P5 PKCδ-interfered clones expressing HA-YFP-FMNL1β either non-stimulated (Cont) or IS-stimulated. The red line indicates the average Phospho-(Ser) PKC substrate MFI for each group. In the lower left panel, representative AIPs of the indicated channels of the IS-stimulated transfected clones (Raji cells are labelled with a white discontinuous line) are show. In the right side, quantification of Phospho-(Ser) PKC substrate MFI in C3 control and P5 PKCδ-interfered clones expressing HA-YFP-FMNL1β, either non-stimulated (Cont) or IS-stimulated, represented as fold induction of Phospho-(Ser) PKC substrate MFI (mean±SD), and summarizing the results obtained in several (n = 5) experiments. NS, not significant; **, p ≤ 0.05. (Panel C) IS conjugates made by C3 control and P5 PKCδ-interfered clones expressing HA-YFP-FMNL1β were imaged by confocal microscopy to analyse the colocalization of HA-YFP-FMNL1β and Phospho-(Ser) PKC substrate signals, as indicated in Materials and Methods. In the upper row, MIPs of the indicated channels are shown. The white rectangles enclose the IS ROIs that were used for colocalization analyses in the focal planes indicated in the lower row. Colocalization pixels are shown in white colour on the colocalizations masks, as well as the corresponding Pearson’s coefficients. The lower plot shows the Pearson’s coefficients corresponding to several analyses similar to the one shown in the upper row, for synapses made by C3 and P5 clones expressing HA-YFP-FMNL1β or HA-YFP-FMNL1α. The red line indicates the average Pearson’s coefficient for each cell group. NS, not significant.
Figure 7.
Figure 7.
PKCδ regulates the phosphorylation of paxillin at T538. (Panel A) C3 control and P5 PKCδ-interfered Jurkat clones were challenged with CMAC-labelled, SEE-pulsed Raji cells for 1 h, fixed, immunolabelled with anti-γ-tubulin, anti-paxillin and anti-phospho-T538 paxillin and imaged by confocal microscopy. White lines enclose Jurkat cells. In the right panels, colocalization masks of merged, paxillin and phospho-T538 paxillin channels, are represented in white. The yellow arrows indicate accumulations of paxillin and phospho-T538 paxillin. CMAC labelling of Raji cells in blue, γ-tubulin (MTOC) in magenta, paxillin in red and phospho-T538 paxillin in green. (Panel B)C3 control and P5 PKCδ-interfered Jurkat clones were either untreated (Cont) or challenge with SEE-pulsed Raji cells (synapse) and immunolabelled as in A. Phospho-T538 paxillin signals were internally normalized to paxillin signals as described in Materials and Methods. (Panel C) C3 control and P5 PKCδ-interfered Jurkat clones untreated (c), or stimulated with either PMA or plastic-bound anti-TCR, were lysed at the indicated times. Cell lysates were analysed by WB with antibodies against phospho-T538-paxillin, paxillin, PKCδ and β-actin. (Panel D) Fold induction of paxillin T538 phosphorylation, normalized to paxillin levels, was evaluated by WB quantification of several experiments similar to that described in panel C. Data are means plus SD (n = 3). NS, not significant; **, p ≤ 0.05.

References

    1. de la Roche M, Asano Y, Griffiths GM.. Origins of the cytolytic synapse. Nat Rev Immunol. 2016;16(7):421–21. - PubMed
    1. Huse M. Microtubule-organizing center polarity and the immunological synapse: protein kinase C and beyond. Front Immunol. 2012;3:235. - PMC - PubMed
    1. Billadeau DD, Nolz JC, Gomez TS. Regulation of T-cell activation by the cytoskeleton. Nat Rev Immunol. 2007;7(2):131–143. - PubMed
    1. Griffiths GM, Tsun A, Stinchcombe JC. The immunological synapse: a focal point for endocytosis and exocytosis. J Cell Biol. 2010;189(3):399–406. - PMC - PubMed
    1. Ritter AT, Asano Y, Stinchcombe JC, et al. Actin depletion initiates events leading to granule secretion at the immunological synapse. Immunity. 2015;42(5):864–876. - PMC - PubMed