. 2020 Aug 12;7(Pt 5):870-880.
doi: 10.1107/S2052252520008830. eCollection 2020 Sep 1.

Machine learning deciphers structural features of RNA duplexes measured with solution X-ray scattering

Affiliations

Machine learning deciphers structural features of RNA duplexes measured with solution X-ray scattering

Yen-Lin Chen et al. IUCrJ. .

Abstract

Macromolecular structures can be determined from solution X-ray scattering. Small-angle X-ray scattering (SAXS) provides global structural information on length scales of 10s to 100s of Ångstroms, and many algorithms are available to convert SAXS data into low-resolution structural envelopes. Extension of measurements to wider scattering angles (WAXS or wide-angle X-ray scattering) can sharpen the resolution to below 10 Å, filling in structural details that can be critical for biological function. These WAXS profiles are especially challenging to interpret because of the significant contribution of solvent in addition to solute on these smaller length scales. Based on training with molecular dynamics generated models, the application of extreme gradient boosting (XGBoost) is discussed, which is a supervised machine learning (ML) approach to interpret features in solution scattering profiles. These ML methods are applied to predict key structural parameters of double-stranded ribonucleic acid (dsRNA) duplexes. Duplex conformations vary with salt and sequence and directly impact the foldability of functional RNA molecules. The strong structural periodicities in these duplexes yield scattering profiles with rich sets of features at intermediate-to-wide scattering angles. In the ML models, these profiles are treated as 1D images or features. These ML models identify specific scattering angles, or regions of scattering angles, which correspond with and successfully predict distinct structural parameters. Thus, this work demonstrates that ML strategies can integrate theoretical molecular models with experimental solution scattering data, providing a new framework for extracting highly relevant structural information from solution experiments on biological macromolecules.

Keywords: computational modelling; machine learning; ribonucleic acids; solution X-ray scattering; wide-angle X-ray scattering.


Figures

Figure 1
Figure 1
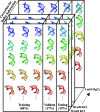
Schematic of the data pipeline. We used structures from unbiased MD simulations to calculate the SWAXS profiles and attached structural descriptors to the profiles using x3dna-dssr and Curves+. The XGBoost models were trained using 68% of the dataset and the hyperparameters were tuned based on the validation set. The unknown datasets, consisting of one synthesized profile from the testing set and two experimental SWAXS profiles, were sampled and fed into the trained models to predict the corresponding structural descriptors.
Figure 2
Figure 2
Data-splitting strategy. We split the models into training (68%), validation (17%) and testing (15%) sets based on dsRNA conformations. Each conformation is associated with nine buffer-subtraction-corrected SWAXS profiles that should be kept together.
Figure 3
Figure 3
Summary of training, validation and testing of five XGBoost models on different structural descriptors. The variances are reported in the last row. The 10-fold CV results report the averaged regression mean-squared error (MSE) or classification accuracy and the standard deviation among 10 folds. Note that we used 750 and 7500 CARTs in the 10-fold CV and training processes, respectively. The shaded models are identified subjectively as poor, based on 10-fold CV results, performance on all the datasets and comparison with other trained models on the same structural descriptor. Overall, the numbers suggest that the XGBoost model is able to learn or recognize the patterns in the training data and generalize for unknown testing data. This characteristic implies the potential to be applied to noisy experimental data and different molecular systems.
Figure 4
Figure 4
Confusion matrices reporting the performances of all the XGBoost models (noise-free, noisy, sparsely sampled, densely sampled in columns 2–5) on different structural descriptors. Compared with the truthtruth matrices in column 1, all the trained models perform well on both the training set and the testing set, suggesting the ability to generalize for unknown datasets.
Figure 5
Figure 5
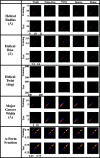
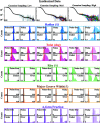
Performance of four trained XGBoost models on the noisy synthesized data from the testing set. Twenty sampled SWAXS profiles with low, medium and high error levels are shown in the top row. The subsequent rows show a number of boxed panels containing four histograms of predictions made by the different indicated models: noise-free, noisy, sparsely sampled and densely sampled. The vertical lines represent the real values, extracted from detailed molecular analysis. The transparency of the histograms is coded by the error levels: the higher the error, the more transparent the lines. Generally speaking, all the trained models perform well on noisy data with reasonable error levels (low and medium). As the error levels increase, corresponding to an unphysically low signal-to-noise ratio, outlier values start to appear, and the prediction distribution spreads. However, even under this extreme case, some of the peak values still recapitulate the real ones.
Figure 6
Figure 6
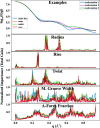
Performance of noise-free XGBoost models applied to experimental data acquired on dsRNA in 5.0 mM MgCl2 (top row) and 500 mM KCl (bottom row), respectively, using Gaussian sampling from medium-error levels. The real experimental values were obtained by curve-fitting using an extended ensemble optimization method. The major groove width was not reported in previous work, so its real value is missing. However, the predicted major groove width is about 3.5 and 7.5 Å for 5.0 mM MgCl2 and 500 mM KCl, respectively. For experimental data, the trained models still recapitulate the real values as means of prediction distributions.
Figure 7
Figure 7
Normalized ‘gain-importance’ traces for four trained models. The ‘gain-importance’ reports the significance of the scattering intensities in predicting a certain structural descriptor. Intensities at different locations along the q axis have different significance, suggesting that the information content is not uniformly distributed in q. A more detailed description is provided in the text.

References

    1. Bardhan, J., Park, S. & Makowski, L. (2009). J. Appl. Cryst. 42, 932–943. - PMC - PubMed
    1. Bezanson, J., Karpinski, S., Shah, V. B. & Edelman, A. (2012). SIAM Rev. 59, 1–27.
    1. Blanchet, C., Pasi, M., Zakrzewska, K. & Lavery, R. (2011). Nucleic Acids Res. 39, W68–W73. - PMC - PubMed
    1. Blanchet, C. E. & Svergun, D. I. (2013). Annu. Rev. Phys. Chem. 64, 37–54. - PubMed
    1. Cech, T. R., Zaug, A. J. & Grabowski, P. J. (1981). Cell, 27, 487–496. - PubMed