Randomized Controlled Trial
. 2020 Nov 19;150(11):3005-3012.
doi: 10.1093/jn/nxaa260.

High-Dose Neonatal Vitamin A Supplementation to Bangladeshi Infants Increases the Percentage of CCR9-Positive Treg Cells in Infants with Lower Birthweight in Early Infancy, and Decreases Plasma sCD14 Concentration and the Prevalence of Vitamin A Deficiency at Two Years of Age

Affiliations
Randomized Controlled Trial

High-Dose Neonatal Vitamin A Supplementation to Bangladeshi Infants Increases the Percentage of CCR9-Positive Treg Cells in Infants with Lower Birthweight in Early Infancy, and Decreases Plasma sCD14 Concentration and the Prevalence of Vitamin A Deficiency at Two Years of Age

Shaikh M Ahmad et al. J Nutr. .

Abstract

Background: Vitamin A (VA) stores are low in early infancy and may impair development of the immune system.

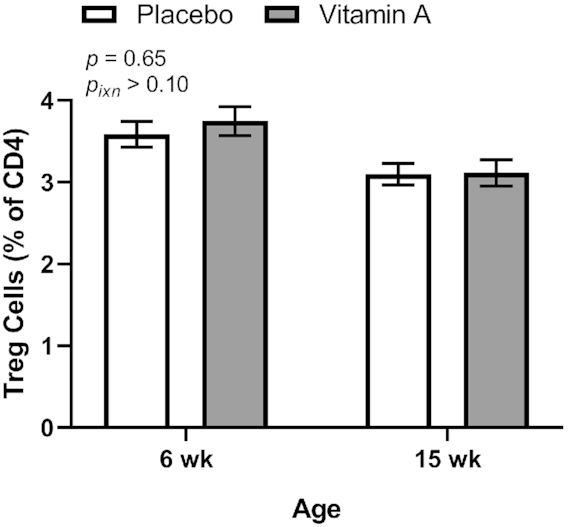
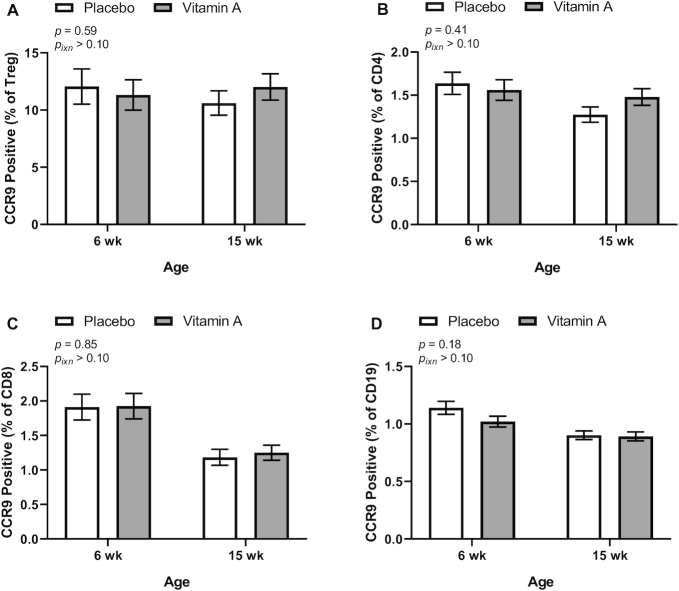
Objective: This study determined if neonatal VA supplementation (VAS) affects the following: 1) development of regulatory T (Treg) cells; 2) chemokine receptor 9 (CCR9) expression, which directs mucosal targeting of immune cells; and 3) systemic endotoxin exposure as indicated by changed plasma concentrations of soluble CD14 (sCD14). Secondarily, VA status, growth, and systemic inflammation were investigated.

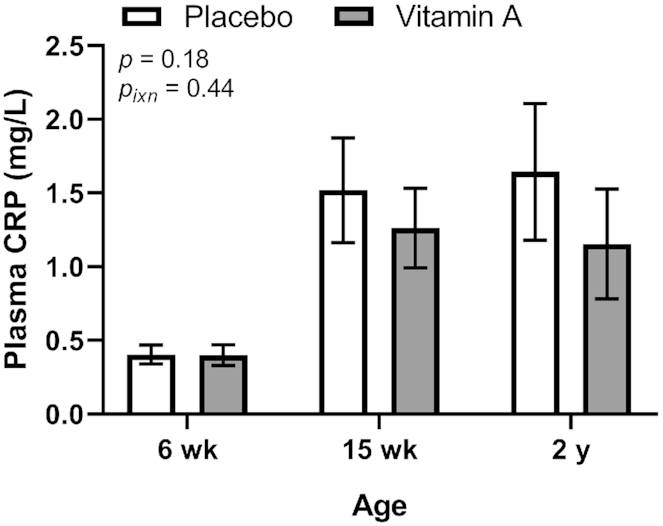
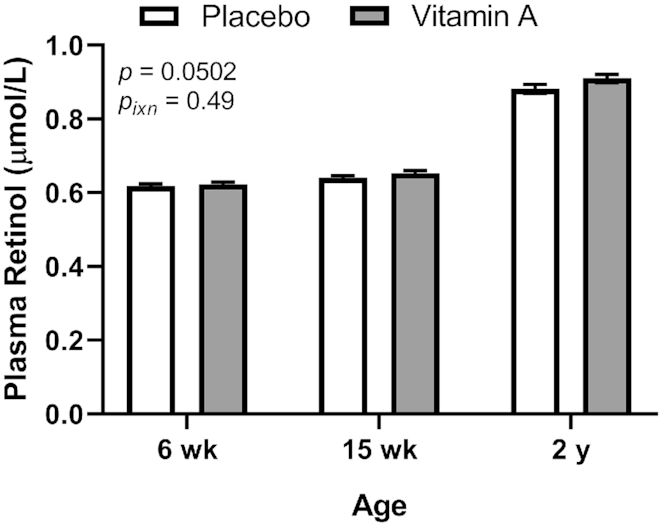
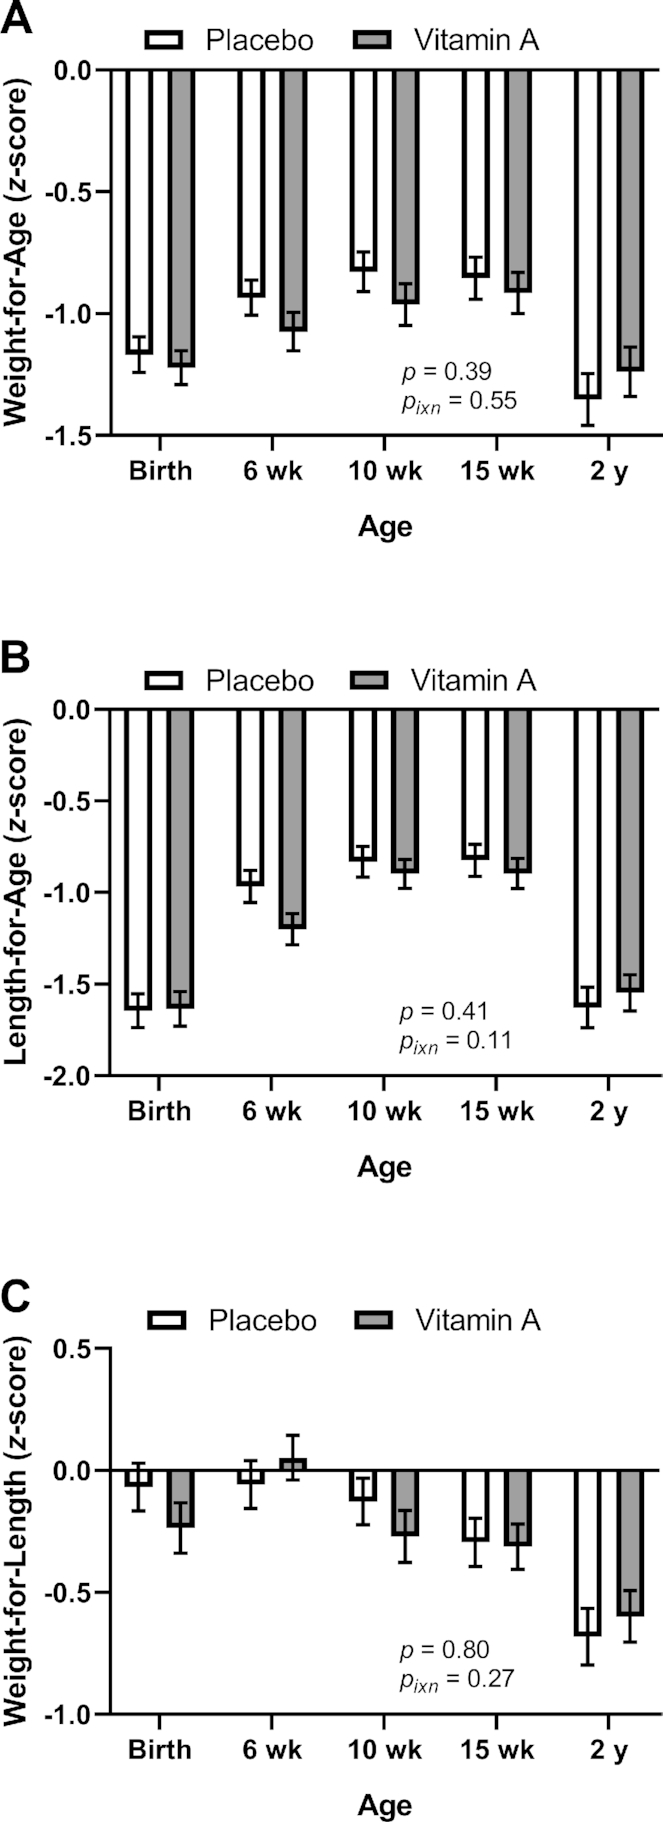
Methods: In total, 306 Bangladeshi infants were randomly assigned to receive 50,000 IU VA or placebo (PL) within 48 h of birth, and immune function was assessed at 6 wk, 15 wk, and 2 y. Primary outcomes included the following: 1) peripheral blood Treg cells; 2) percentage of Treg, T, and B cells expressing CCR9; and 3) plasma sCD14. Secondary outcomes included the following: 4) VA status measured using the modified relative dose-response (MRDR) test and plasma retinol; 5) infant growth; and 6) plasma C-reactive protein (CRP). Statistical analysis identified group differences and interactions with sex and birthweight.

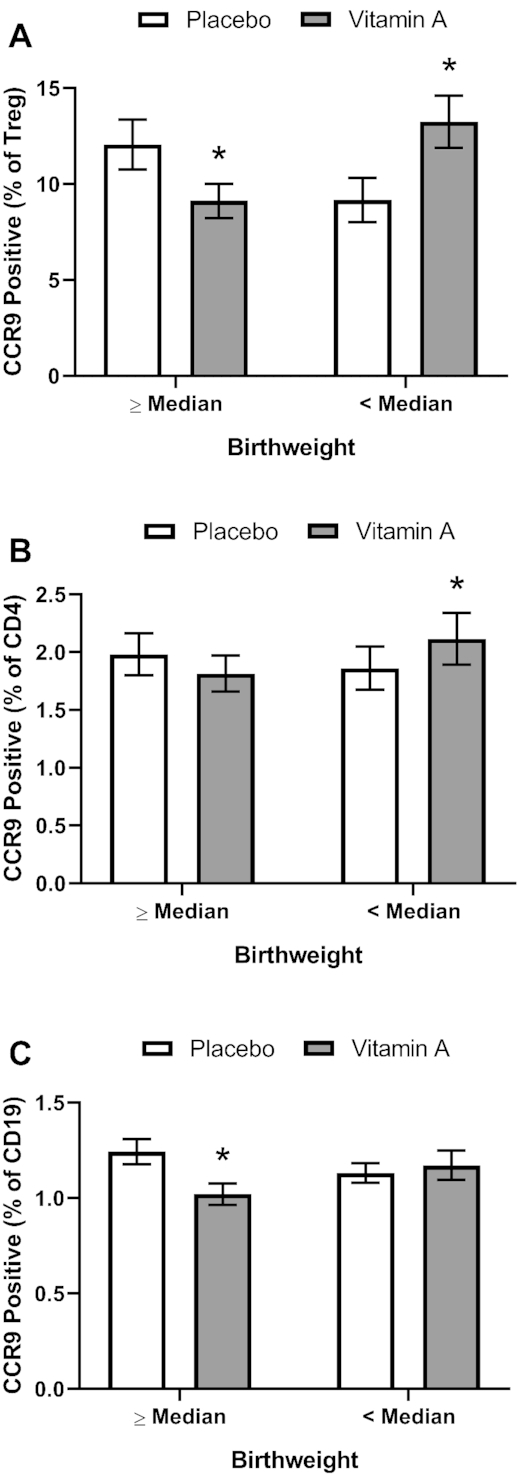
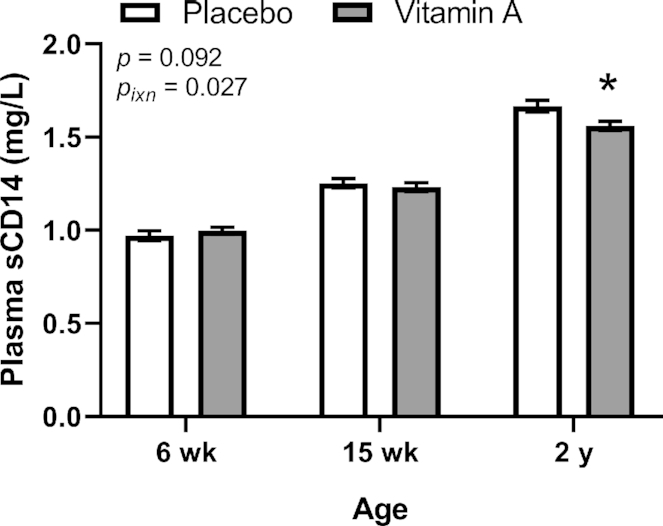
Results: VAS increased (P = 0.004) the percentage of CCR9+ Treg cells (13.2 ± 1.37%) relative to PL (9.17 ± 1.15%) in children below the median birthweight but had the opposite effect (P = 0.04) in those with higher birthweight (VA, 9.13 ± 0.89; PL, 12.1 ± 1.31%) at 6 and 15 wk (values are combined mean ± SE). VAS decreased (P = 0.003) plasma sCD14 (1.56 ± 0.025 mg/L) relative to PL (1.67 ± 0.032 mg/L) and decreased (P = 0.034) the prevalence of VA deficiency (2.3%) relative to PL (9.2%) at 2 y.

Conclusions: Neonatal VAS enhanced mucosal targeting of Treg cells in low-birthweight infants. The decreased systemic exposure to endotoxin and improved VA status at 2 y may have been due to VA-mediated improvements in gut development resulting in improved barrier function and nutrient absorption. This trial was registered at clinicaltrials.gov as NCT01583972 and NCT02027610.

Keywords: B cell; Bangladesh; CCR9; CRP; MRDR test; T cell; Treg cell; neonate; sCD14; vitamin A.


Figures

FIGURE 1
FIGURE 1
Treg cells in peripheral blood at 6 and 15 wk of age by treatment group in study infants receiving vitamin A (50,000 IU) or placebo capsules within 48 h of birth. P values indicate overall effect of treatment. Interaction P value (Pixn) is shown if P < 0.10 and indicates interaction of age with treatment group. Values are means ± SEs, n = 109 and 133 for the placebo group and n = 107 and 134 for the vitamin A group at 6 and 15 wk, respectively. Least square means derived from the regression model (see Supplemental Table 1 and Methods) are shown here (no transformation was required for normalization) and are thus adjusted for all covariates in the model. Treg, regulatory T.
FIGURE 2
FIGURE 2
Percentage of Treg cells (A), CD4 T cells (B), CD8 T cells (C), and B cells (D) positive for CCR9 expression in peripheral blood at 6 and 15 wk of age by treatment group in study infants receiving vitamin A (50,000 IU) or placebo capsules within 48 h of birth. P values indicate overall effect of treatment. Interaction P value (Pixn) is shown if P < 0.10 and indicates interaction of age with treatment group. Values are means ± SEs: For T reg cells, n = 109 and 133 for the placebo group and n = 107 and 134 for the vitamin A group at 6 and 15 wk, respectively (A). For CD4 and CD8 T cells and for B cells, n = 114 and 139 for the placebo group and n = 112 and 136 for the vitamin A group at 6 and 15 wk, respectively (B, C, D). Least-square means derived from the regression model (see Supplemental Table 1 and Methods) are shown here and are thus adjusted for all covariates in the model. Data were transformed for modeling (Treg, natural logarithm; CD4, natural logarithm + 0.3; CD8, natural logarithm; B cells, natural logarithm). Treg, regulatory T.
FIGURE 3
FIGURE 3
Percentage of Treg cells (A), CD4 T cells (B), and B cells positive for CCR9 expression (C) in peripheral blood by treatment group stratified by BWM category (below, P < 0.05. Significant interactions, P < 0.10, of treatment group with BWM category were seen for Treg cells (0.0005), CD4 T cells (0.021), and B cells (0.062); significant post hoc P values (<0.05) for comparing treatment group means are shown in the figure. Values are means ± SEs combining data from 6 and 15 wk for T reg cells, n = 121 and 121 for the placebo group and n = 120 and 121 for the vitamin A group above and below the BWM, respectively (A). For CD4 and CD8 T cells and for B cells, n = 129 and 124 for the placebo group and n = 115 and 125 for the above and below the BWM, respectively (B, C, D). Least square means derived from the regression model (see Supplemental Table 1 and Methods) are shown here and are thus adjusted for all covariates in the model. Data were transformed for modeling (Treg, natural logarithm; CD4, natural logarithm + 0.3; CD8, natural logarithm; B cells, natural logarithm). BWM, birthweight median; Treg, regulatory T.
FIGURE 4
FIGURE 4
Plasma sCD14 concentration at 6 wk, 15 wk, and 2 y of age by treatment group in study infants receiving vitamin A (50,000 IU) or placebo capsules within 48 h of birth. Asterisks (*) indicate significant difference from the placebo group at P < 0.05. Interaction P value (Pixn) is shown if P < 0.10 and indicates interaction of age with treatment group; significant post hoc P values (< 0.05) for comparing treatment group means are shown in the figure. Values are means ± SEs, n = 133, 145 and 130 for the placebo group and n = 134, 138 and 128 for the vitamin A group at 6 wk, 15 wk and 2 y, respectively. Least square means derived from the regression model (see Supplemental Table 1 and Methods) are shown here (no transformation was required for normalization) and are thus adjusted for all covariates in the model.
FIGURE 5
FIGURE 5
Plasma CRP concentration at 6 wk, 15 wk, and 2 y of age by treatment group in study infants receiving vitamin A (50,000 IU) or placebo capsules within 48 h of birth. P value indicate overall effect of treatment. Interaction P value (Pixn) is shown if P < 0.10 and indicates interaction of age with treatment group; significant post hoc P values (<0.05) for comparing treatment group means are shown in the figure. Values are means ± SEs, n = 133, 145 and 130 for the placebo group and n = 134, 138, and 128 for the vitamin A group at 6 wk, 15 wk, and 2 y, respectively. Least square means derived from the regression model (see Supplemental Table 1 and Methods) are shown here and are thus adjusted for all covariates in the model. A natural logarithm transformation was used for CRP data to normalize data. CRP, C-reactive protein.
FIGURE 6
FIGURE 6
Plasma retinol concentrations at 6 wk, 15 wk, and 2 y of age by treatment group in study infants receiving vitamin A (50,000 IU) or placebo capsules within 48 h of birth. P value indicate overall effect of treatment. Interaction P value (Pixn) is shown if P < 0.10 and indicates interaction of age with treatment group. Values are means ± SEs, n = 133, 141, and 130 for the placebo group and n = 133, 134, and 128 for the vitamin A group at 6 wk, 15 wk and 2 y, respectively. Least square means derived from the regression model (see Supplemental Table 1 and Methods) are shown here (no transformation was required for normalization) and are thus adjusted for all covariates in the model.
FIGURE 7
FIGURE 7
Anthropometric indicators of growth by treatment group in study infants receiving vitamin A (50,000 IU) or placebo capsules within 48 h of birth: weight-for-age (A), length-for-age (B), and weight-for-length (C) z scores. P value indicate overall effect of treatment. Interaction P value (Pixn) is shown if P < 0.10 and indicates interaction of age with treatment group. Values are means ± SEs for weight-for-age n = 153, 147, 144, 146, and 133 for the placebo group and n = 153, 144, 143, 144, and 131 for the vitamin A group at birth, 6 wk, 10 wk, 15 wk, and 2 y, respectively (A); for length-for-age, n = 153, 147, 144, 146, and 131 for the placebo group and n = 153, 144, 143, 144 and 128 for the vitamin A group at birth, 6 wk, 10 wk, 15 wk, and 2 y, respectively (B); and for weight-for-length, n = 129, 147, 144, 146, and 133 for the placebo group and n = 129, 144, 143, 144, and 131 for the vitamin A group at birth, 6 wk, 10 wk, 15 wk and 2 y, respectively (C). Least square means derived from the regression model (see Supplemental Table 1 and Methods) are shown here (no transformation was required for normalization) and are thus adjusted for all covariates in the model.

References

    1. Mellanby E, Green HN. Vitamin a as an anti-infective agent: its use in the treatment of puerperal septigaemia. Br Med J. 1929;1:984–6. - PMC - PubMed
    1. Semba RD. Vitamin A as “anti-infective” therapy, 1920–1940. J Nutr. 1999;129:783–91. - PubMed
    1. Imdad A, Mayo-Wilson E, Herzer K, Bhutta ZA. Vitamin A supplementation for preventing morbidity and mortality in children from six months to five years of age. Cochrane Database Syst Rev. 2017;3:CD008524. - PMC - PubMed
    1. Brown CC, Noelle RJ. Seeing through the dark: new insights into the immune regulatory functions of vitamin A. Eur J Immunol. 2015;45:1287–95. - PMC - PubMed
    1. Larange A, Cheroutre H. Retinoic acid and retinoic acid receptors as pleiotropic modulators of the immune system. Annu Rev Immunol. 2016;34:369–94. - PubMed

Publication types

Associated data