Review
. 2021 Feb;238(2):489-507.
doi: 10.1111/joa.13309. Epub 2020 Sep 16.

Tissue clearing technique: Recent progress and biomedical applications

Affiliations
Review

Tissue clearing technique: Recent progress and biomedical applications

Ting Tian et al. J Anat. 2021 Feb.

Abstract

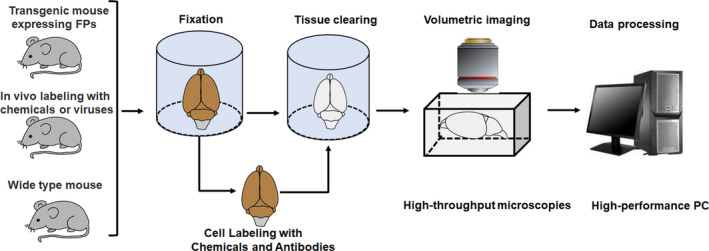
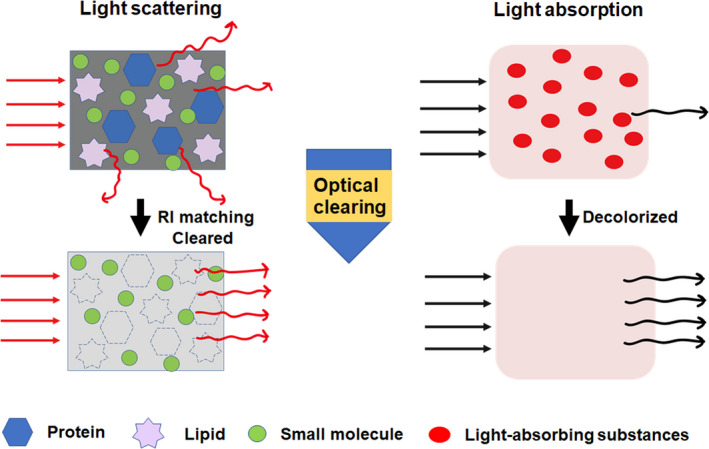
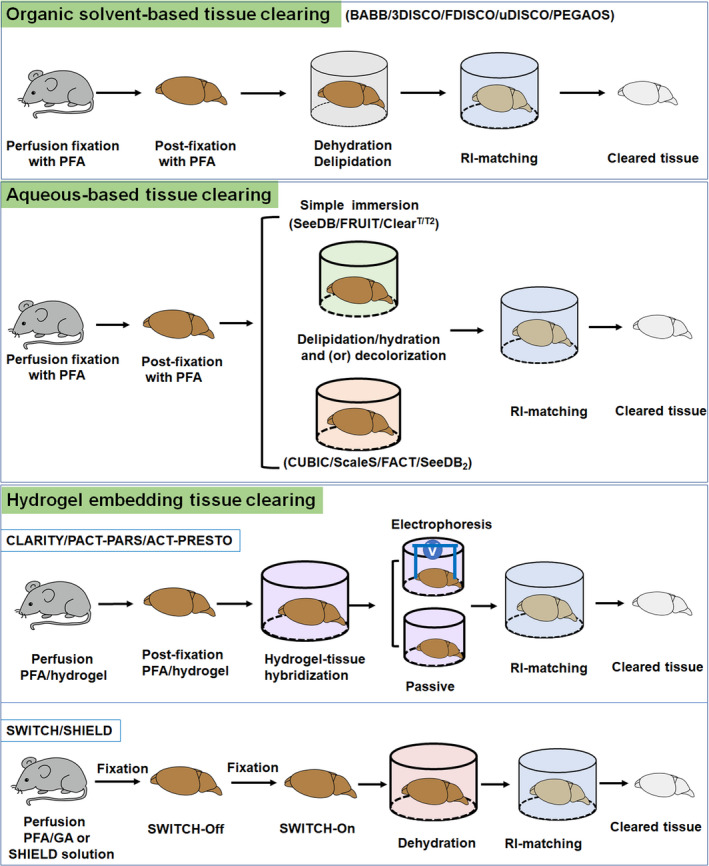
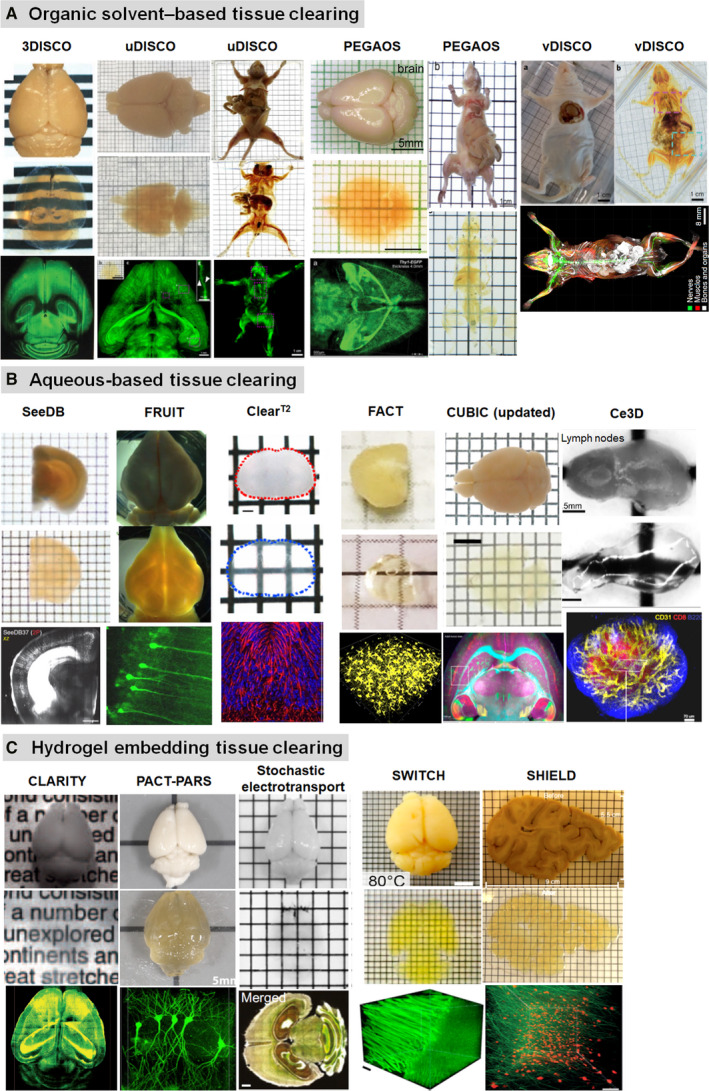
Organisms are inherently three dimensional, thus comprehensive understanding of the complicated biological system requires analysis of organs or even whole bodies in the context of three dimensions. However, this is a tremendous task since the biological specimens are naturally opaque, a major obstacle in whole-body and whole-organ imaging. Tissue clearing technique provides a prospective solution and has become a powerful tool for three-dimensional imaging and quantification of organisms. Tissue clearing technique aims to make tissue transparent by minimizing light scattering and light absorption, thus allowing deep imaging of large volume samples. When combined with diverse molecular labeling methods and high-throughput optical sectioning microscopes, tissue clearing technique enables whole-body and whole-organ imaging at cellular or subcellular resolution, providing detailed and comprehensive information about the intact biological systems. Here, we give an overview of recent progress and biomedical applications of tissue clearing technique. We introduce the mechanisms and basic principles of tissue clearing, and summarize the current tissue clearing methods. Moreover, the available imaging techniques and software packages for data processing are also presented. Finally, we introduce the recent advances in applications of tissue clearing in biomedical fields. Tissue clearing contributes to the investigation of structure-function relationships in intact mammalian organs, and opens new avenues for cellular and molecular mapping of intact human organs. We hope this review contributes to a better understanding of tissue clearing technique and can help researchers to select the best-suited clearing protocol for their experiments.

Keywords: data processing; light scattering; optical sectioning microscope; tissue clearing technique; whole-body imaging.


Conflict of interest statement

The authors declare no conflict of interest.

Figures

FIGURE 1
FIGURE 1
Tissue clearing technique and steps for volumetric imaging
FIGURE 2
FIGURE 2
Mechanisms and principles of tissue clearing technique. Light scattering and light absorption are the leading causes of tissue opacity, which blocks light propagation. Light scattering is caused by heterogeneous components such as lipids and proteins. Light absorption is resulted from endogenous light absorbers like hemoglobin and melanin. Tissue clearing technique makes tissue optically transparent by minimizing light scattering and light absorption
FIGURE 3
FIGURE 3
Methodology of tissue clearing technique
FIGURE 4
FIGURE 4
Optical clearing and imaging of diverse tissue clearing techniques. (a) Organic solvent‐based tissue clearing and volumetric imaging. Images adapted from Refs (Erturk et al., 2012; Pan et al., 2016; Jing et al., 2018; Cai et al., 2019). (b) Aqueous‐based tissue clearing and optical imaging. Images adapted from Refs (Ke et al., 2013; Kuwajima et al., 2013; Hou et al., 2015; Ke et al., 2016; Li et al., 2017; Xu et al., 2017; Tainaka et al., 2018). (c) Hydrogel embedding tissue clearing and 3D imaging. Images adapted from Refs (Chung et al., 2013; Yang et al., 2014; Kim et al., 2015; Murray et al., 2015; Park et al., 2019)
FIGURE 5
FIGURE 5
Applications of tissue clearing in neuroscience. (A) Overview of construction of mouse brain atlas with single‐cell annotation (CUBIC‐Atlas), and the volume‐rendered images of the CUBIC‐Atlas from the horizontal, sagittal, and coronal view. (B) 3D visualization of amyloid plaques in AD using iDISCO clearing. a, Amyloid plaques and neurofilament H imaging in a cleared cortex slice of 10‐month‐old 2xTg AD mouse (500 μm thick). b, Maximum projection of vasculature, amyloid plaques, and microglia staining from an 11‐month‐old 2xTg AD mouse brain (1 mm thick). The insert is the magnification of the indicated region (white rectangle). c, The magnified optical section from the AD brain in b, the circles indicate the plaques surrounded by reactive microglia and vessels. d, The magnified surface render in c. (C) Multiplexed detection of mRNAs in EDC‐CLARITY. a, Multiplexed in situ hybridization of coronal section (0.5 mm thick) using somatostatin (red), parvalbumin (blue), and tyrosine hydroxylase (green) probe sets. b, c, Magnified view of indicated boxes. (D) 3D imaging of mouse brain vasculature labeled with Texas Red through the transparent skull window. Images adapted from Refs (Liebmann et al., 2016; Sylwestrak et al., 2016; Murakami et al., 2018; Chen et al., 2019)
FIGURE 6
FIGURE 6
Applications of tissue clearing in soft tissue organs. (a)Tridimensional imaging of the vasculatures in white adipose tissues (WAT) after optical clearing, and the vascular plasticity in WAT (right) in response to cold challenge. (b) Spatial distribution of sympathetic nerves (TH, green) and arteries (a‐SMA, magenta) in the kidney. (c) 3D Analysis of the developing peripheral nerves, heart, and lung in solvent‐cleared human embryos. (d) 3D whole‐mount images (top) and magnified view (bottom) of human colonic and airway organoids. Images adapted from Refs (Belle et al., 2017; Cao et al., 2018; Hasegawa et al., 2019; Dekkers et al., 2019)
FIGURE 7
FIGURE 7
Applications of tissue clearing in hard tissue organs. (a) Maximum intensity projection (MIP) fluorescence image of the femur revealing Sox9+ cells distribution in the vicinity of the third trochanter. Dotted boxed regions in the MIP represent progressive magnification. (b) Spatial distribution of nerves and arteries within the marrow space of the tibia. Dotted areas are magnified in e‐g. Arrows in f and h show nerve fibers penetrating the cortical bone. SHG, second harmonic generation signal. (c) Volumetric imaging of immune cell distributions in an upper third molar from a CX3CR1‐GFP transgenic mouse, with lectin labeled (red) endothelial cells in blood vessels. Maximal intensity Z‐projection image (left) and 3D reconstruction image (right) in the dotted area. (d) Tridimensional innervation of a human premolar (left) and high‐magnification images (right) of distinctive nerve splitting patterns in coronal and furcation direction. Images adapted from Refs (Greenbaum et al., 2017; Jing et al., 2018; Franca et al., 2019; Hong et al., 2019)
FIGURE 8
FIGURE 8
Applications of tissue clearing in tumor research. (A) Whole‐body and whole‐organ (lung and brain) imaging of cancer metastasis at single‐cell resolution. (B) Whole lung clearing allows identification of tumors and visualization of tumor burden. a‐b, Whole lung clearing and identification of small tumors (small arrows); c, Whole lung imaging of KP tumour‐bearing mouse; d, Magnification of a tumor from box in c; e, Magnification imaging from box in d. (C) 3D reconstruction image of multiple tumor immune microenvironment components and biomarkers in an intact mammary tumor from a BALBNeuT mouse. Images adapted from Refs (Cuccarese et al., 2017; Kubota et al., 2017; Lee et al., 2017)

References

    1. Acar, M. , Kocherlakota, K.S. , Murphy, M.M. , Peyer, J.G. , Oguro, H. , Inra, C.N. et al (2015) Deep imaging of bone marrow shows non‐dividing stem cells are mainly perisinusoidal. Nature, 526, 126–130. - PMC - PubMed
    1. Alnuami, A.A. , Zeedi, B. , Qadri, S.M. & Ashraf, S.S. (2008) Oxyradical‐induced GFP damage and loss of fluorescence. International Journal of Biological Macromolecules, 43, 182–186. 10.1016/j.ijbiomac.2008.05.002 - DOI - PubMed
    1. Belle, M. , Godefroy, D. , Couly, G. , Malone, S.A. , Collier, F. , Giacobini, P. et al (2017) Tridimensional visualization and analysis of early human development. Cell, 169, 161–173. 10.1016/j.cell.2017.03.008 - DOI - PubMed
    1. Briggman, K.L. , Helmstaedter, M. & Denk, W. (2011) Wiring specificity in the direction‐selectivity circuit of the retina. Nature, 471, 183–188. 10.1038/nature09818 - DOI - PubMed
    1. Cai, R. , Pan, C. , Ghasemigharagoz, A. , Todorov, M.I. , Forstera, B. , Zhao, S. et al (2019) Panoptic imaging of transparent mice reveals whole‐body neuronal projections and skull‐meninges connections. Nature Neuroscience, 22, 317–327. 10.1038/s41593-018-0301-3 - DOI - PMC - PubMed

Publication types

LinkOut - more resources