

Systematic analysis of bypass suppression of essential genes
- PMID: 32939983
- PMCID: PMC7507402
- DOI: 10.15252/msb.20209828
Systematic analysis of bypass suppression of essential genes
Abstract
Essential genes tend to be highly conserved across eukaryotes, but, in some cases, their critical roles can be bypassed through genetic rewiring. From a systematic analysis of 728 different essential yeast genes, we discovered that 124 (17%) were dispensable essential genes. Through whole-genome sequencing and detailed genetic analysis, we investigated the genetic interactions and genome alterations underlying bypass suppression. Dispensable essential genes often had paralogs, were enriched for genes encoding membrane-associated proteins, and were depleted for members of protein complexes. Functionally related genes frequently drove the bypass suppression interactions. These gene properties were predictive of essential gene dispensability and of specific suppressors among hundreds of genes on aneuploid chromosomes. Our findings identify yeast's core essential gene set and reveal that the properties of dispensable essential genes are conserved from yeast to human cells, correlating with human genes that display cell line-specific essentiality in the Cancer Dependency Map (DepMap) project.
Keywords: compensatory evolution; gene essentiality; genetic interactions; genetic networks; genetic suppression.
© 2020 The Authors. Published under the terms of the CC BY 4.0 license.
Conflict of interest statement
The authors declare that they have no conflict of interest.
Figures
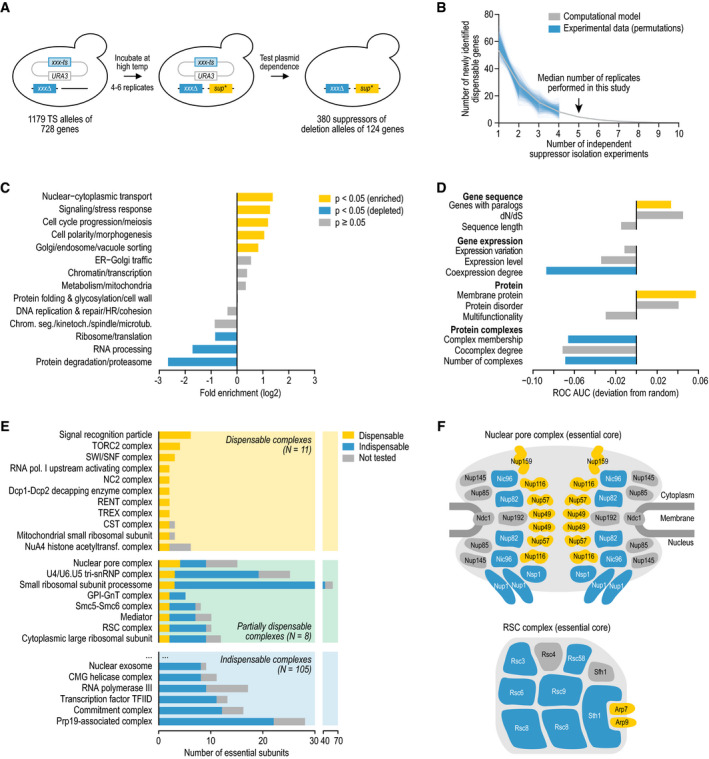
- A
Strategy for isolating bypass suppressors of essential gene deletion mutant alleles.
- B
The number of newly identified dispensable essential query genes is plotted against the number of independent suppressor isolation experiments (1 experiment = ˜ 25 million query mutant cells). Shown are the 1,000 random permutations of the experimental results and a computational model that was fit to these data. Note that we used at most four independent suppressor isolation experiments per query gene for the random permutations, while a median of five experiments was performed.
- C, D
Enrichment of dispensable essential genes among tested essential genes (C) for annotation to a biological functional class and (D) for various gene‐ and protein‐level properties. Fisher's exact or Mann–Whitney U‐tests were performed to determine statistical significance of the results.
- E
Dispensability of essential protein complexes. For each protein complex, the number of subunits encoded by an essential gene is shown, subdivided by their dispensability.
- F
The essential subunits of the nuclear pore complex and the chromatin remodeling complex RSC (Hodges et al, 2016) are shown. Subunits are color‐coded according to their dispensability, using the same color scheme as in (E). Although the essential gene SEC13 encodes a subunit of the nuclear pore complex, it is not included in the figure as its essentiality results from Sec13's role in another complex, the coat protein complex II (Copic et al, 2012).
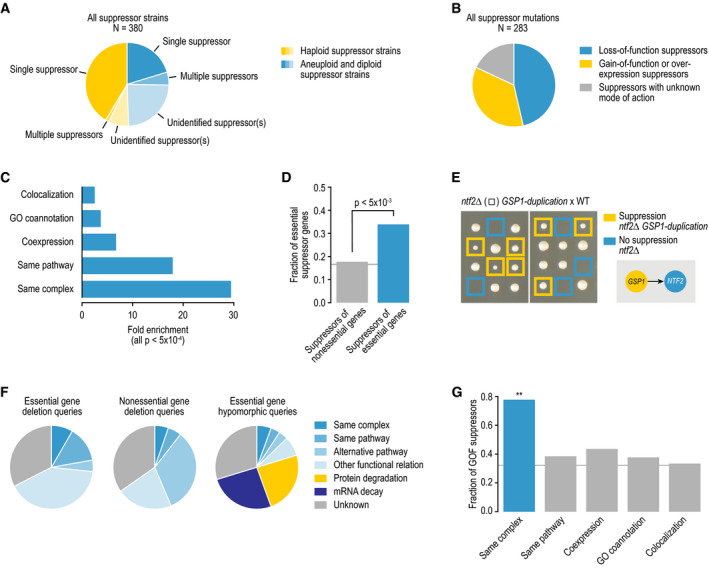
The fraction of all suppressor strains in which we identified one single suppressor, multiple co‐occurring suppressors, or in which we were unable to identify a suppressor gene, divided by the genome content of the strain.
The fraction of all suppressor mutations that involve loss‐of-function, gain‐of-function, or unknown modes of action.
Fold enrichment for colocalization, GO coannotation, coexpression, same pathway membership, and same complex membership for gene pairs involved in a suppression interaction.
The fraction of unique suppressor mutations that map to an essential gene, for the suppressors of essential gene deletion mutants identified in this study or suppressors of nonessential gene deletion mutants identified previously (Van Leeuwen et al, 2016).
An example of a bypass suppressor of an essential gene deletion mutant. Tetrad dissection analysis of a strain heterozygous for a ntf2∆ deletion allele and a GSP1‐duplication allele. Blue squares highlight the lack of colony growth associated with nft2∆ single‐mutant cells. Yellow squares highlight colony growth of nft2∆ GSP1‐duplication double mutants. WT, wild type.
Distribution of suppression interactions across different mechanistic suppression classes, for the suppressors of essential gene deletion mutants identified in this study or suppressors of nonessential gene deletion mutants and essential gene hypomorphic alleles identified previously (Van Leeuwen et al, 2016).
The fraction of gain‐of-function (GOF) suppressor mutations for suppressor interactions showing different types of functional connection between the suppressor and the query gene.
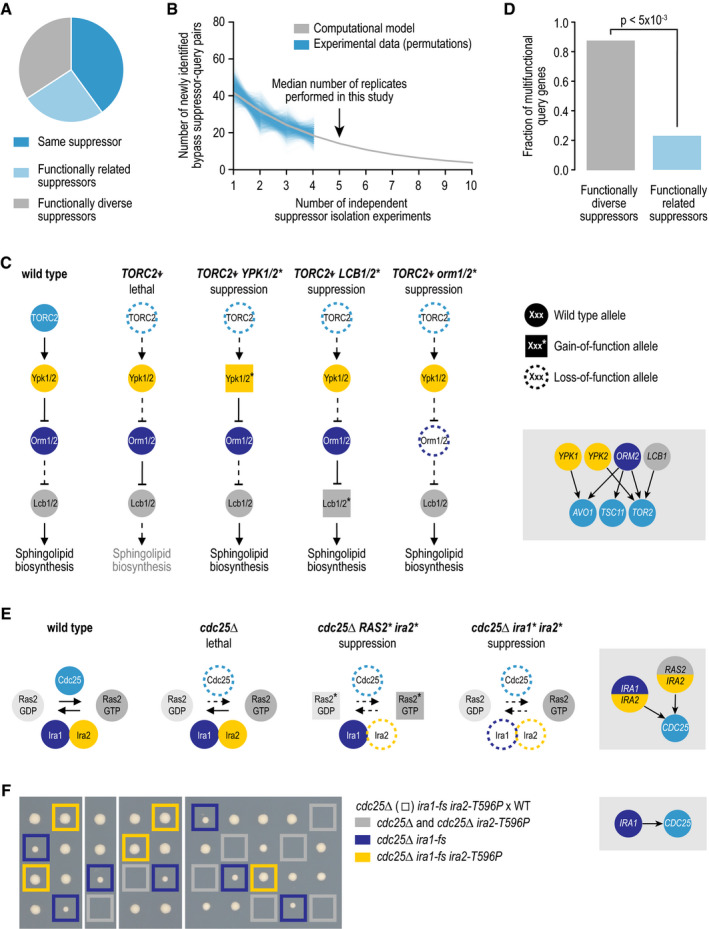
- A
The fraction of query genes for which suppressor mutations were identified in multiple independent suppressor strains that were suppressed by mutations within the same suppressor gene, within multiple functionally related suppressor genes, or within multiple unrelated suppressor genes.
- B
The number of newly identified query–suppressor gene pairs is plotted against the number of independent suppressor isolation experiments. Shown are the 1,000 random permutations of the experimental results and a computational model that was fit to these data. Note that we used at most four independent suppressor isolation experiments per query gene for the random permutations, while a median of five experiments was performed.
- C
An example of multiple suppressor genes within a pathway that can each individually suppress the same query gene mutant.
- D
The fraction of query genes that are considered to be multifunctional (assigned to two or more biological processes), for queries for which multiple suppressor genes have been identified that can individually suppress the query mutant. Query genes are split into those that are suppressed by suppressor genes that are functionally diverse and those that are suppressed by functionally related suppressor genes. Significance was determined using Fisher's exact test.
- E, F
(E) Examples of complex suppression interactions, in which two suppressor genes are mutated. (F) Tetrad dissection analysis of a strain heterozygous for cdc25∆, ira1‐fs (fs, frameshift), and ira2‐T596P mutant alleles. Gray squares highlight the lack of colony growth associated with cdc25∆ or cdc25∆ ira2‐T596P double mutants. Blue squares highlight the colony growth of cdc25∆ ira1‐fs double mutants. Yellow squares highlight the colony growth associated with cdc25∆ ira1‐fs ira2‐T596P triple‐mutant cells. WT, wild type.
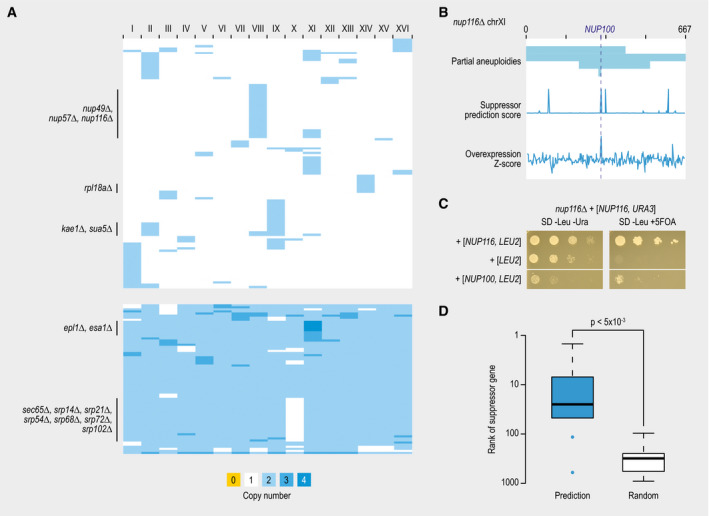
Heatmap showing chromosomal copy numbers of suppressor strains that carried an aneuploidy. Each row represents a different suppressor strain. Columns correspond to each of the 16 yeast chromosomes.
An example of a query gene showing recurrent aneuploidies. Suppressor strains of nup116∆ lethality frequently show an amplification of chromosome XI. In some cases, this amplification is only partial (top). A suppressor prediction algorithm was used to predict the causal suppressor gene on chromosome XI based on functional information (middle). Overexpression of each gene on chromosome XI individually confirmed one of the predicted suppressor genes (NUP100) as the actual suppressor (bottom).
Suppression of nup116∆ lethality by overexpression of NUP100. Cultures of the indicated strains were diluted to an optical density at 600 nm of 0.1, and a series of 10‐fold dilutions was spotted on agar plates and incubated at 30°C for 2–3 days.
Comparison of the median rank of confirmed suppressor genes (N = 10), either in a list of genes ranked by the likeliness of being a suppressor gene using our suppression prediction algorithm or in a random gene list. Statistical significance was determined using a Mann–Whitney U‐test. The central bands in the box plot are the median values. Boxes represent data between the first and third quartiles. Upper and lower whiskers extend to the largest and smallest values, respectively, excluding outliers which are shown as dots. Outliers are values outside the range [Q1 − (1.5 × IQR), Q3 + (1.5 × IQR)].
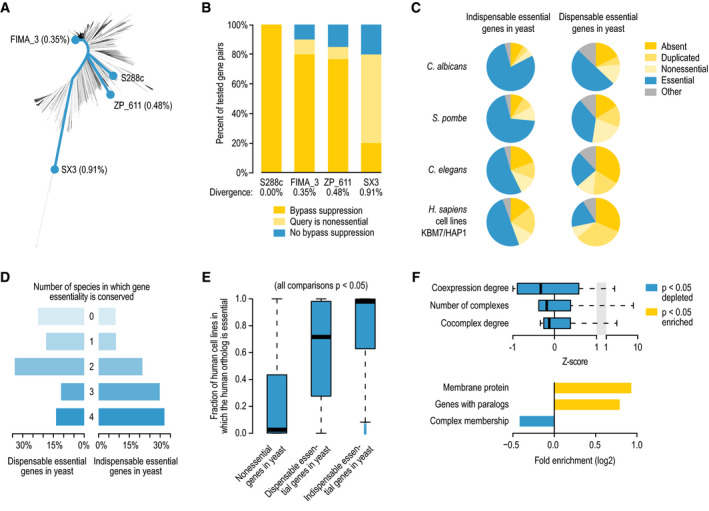
Phylogenetic tree of 1,011 Saccharomyces cerevisiae strains, highlighting the laboratory strain S288c, and three strains isolated from a winery (FIMA_3) and from the bark of oak (ZP_611) and hickory (SX3) trees (Peter et al, 2018). Percentages indicate the genetic divergence from S288c.
The fraction of bypass suppression interactions that are conserved in three different S. cerevisiae strains.
The fraction of dispensable and indispensable essential genes in S. cerevisiae that have orthologs that are absent, duplicated, nonessential, or essential in Candida albicans, Schizosaccharomyces pombe, Caenorhabditis elegans, or Homo sapiens cell lines KBM7/HAP1.
The fraction of dispensable or indispensable essential query genes that are not essential in 0, 1, 2, 3, or 4 of the species indicated in (C).
Distribution of the fraction of human cell lines in which 1‐to-1 orthologs of nonessential, dispensable essential, and indispensable essential yeast genes are essential, using a set of 739 human cell lines (Meyers et al, 2017). Statistical significance was determined using Mann–Whitney U‐tests. The central bands in the box plot are the median values. Boxes represent data between the first and third quartiles. Upper and lower whiskers extend to the largest and smallest values, respectively, excluding outliers which are shown as dots. Outliers are values outside the range [Q1 − (1.5 × IQR), Q3 + (1.5 × IQR)].
Enrichment of context‐dependent essential human genes for various gene‐ and protein‐level properties. Fisher's exact or Mann–Whitney U‐tests were performed to determine statistical significance of the results. Box plot: The central band is the median value. Boxes represent data between the first and third quartiles. Upper and lower whiskers extend to the largest and smallest values, respectively.
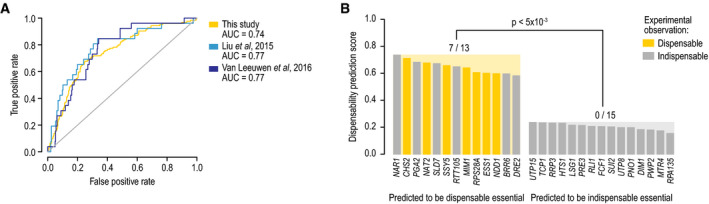
A dispensable essential gene prediction model was developed based on the distinct functional and evolutionary properties of dispensable essential genes compared to other essential genes, and the performance of the model was evaluated. The true‐positive rate was plotted against the false‐positive rate of the dispensable essential gene prediction model. True‐positive dispensable essential genes were defined either by excluding a subset of dispensable essential genes found in this study from the training set (“this study”) or by using dispensable essential gene sets identified in other studies but not tested in our experiment (Liu et al, ; Van Leeuwen et al, 2016).
For 13 essential genes that were predicted to be dispensable and 15 genes predicted to be indispensable, we experimentally tested whether we could identify viable suppressor strains that lacked an essential gene. In each case, we tested for bypass suppression in two independent assays. Experimentally observed dispensable essential genes are highlighted in yellow. The P value indicates the statistical significance of the difference between the number of observed dispensable essential genes between the gene sets predicted to be dispensable or indispensable (Fisher's exact test).
References
-
- Babu M, Vlasblom J, Pu S, Guo X, Graham C, Bean BD, Burston HE, Vizeacoumar FJ, Snider J, Phanse S et al (2012) Interaction landscape of membrane‐protein complexes in Saccharomyces cerevisiae . Nature 489: 585–589 - PubMed
-
- Baryshnikova A, Costanzo M, Dixon S, Vizeacoumar FJ, Myers CL, Andrews B, Boone C (2010a) Synthetic genetic array (SGA) analysis in Saccharomyces cerevisiae and Schizosaccharomyces pombe . Methods Enzymol 470: 145–179 - PubMed
Publication types
MeSH terms
Substances
Grants and funding
LinkOut - more resources
Full Text Sources
Molecular Biology Databases
