. 2021 May 20;22(3):bbaa203.
doi: 10.1093/bib/bbaa203.

Scanning window analysis of non-coding regions within normal-tumor whole-genome sequence samples

Affiliations

Scanning window analysis of non-coding regions within normal-tumor whole-genome sequence samples

J P Torcivia et al. Brief Bioinform. .

Abstract

Genomics has benefited from an explosion in affordable high-throughput technology for whole-genome sequencing. The regulatory and functional aspects in non-coding regions may be an important contributor to oncogenesis. Whole-genome tumor-normal paired alignments were used to examine the non-coding regions in five cancer types and two races. Both a sliding window and a binning strategy were introduced to uncover areas of higher than expected variation for additional study. We show that the majority of cancer associated mutations in 154 whole-genome sequences covering breast invasive carcinoma, colon adenocarcinoma, kidney renal papillary cell carcinoma, lung adenocarcinoma and uterine corpus endometrial carcinoma cancers and two races are found outside of the coding region (4 432 885 in non-gene regions versus 1 412 731 in gene regions). A pan-cancer analysis found significantly mutated windows (292 to 3881 in count) demonstrating that there are significant numbers of large mutated regions in the non-coding genome. The 59 significantly mutated windows were found in all studied races and cancers. These offer 16 regions ripe for additional study within 12 different chromosomes-2, 4, 5, 7, 10, 11, 16, 18, 20, 21 and X. Many of these regions were found in centromeric locations. The X chromosome had the largest set of universal windows that cluster almost exclusively in Xq11.1-an area linked to chromosomal instability and oncogenesis. Large consecutive clusters (super windows) were found (19 to 114 in count) providing further evidence that large mutated regions in the genome are influencing cancer development. We show remarkable similarity in highly mutated non-coding regions across both cancer and race.

Keywords: cancer; cancer hotspots; non-coding region; pan-cancer analysis; whole-genome sequencing.


Figures

Figure 1
Figure 1
Variant calling pipeline from within Google Cloud. (A) Flowchart of the pipeline structure built in Google Cloud Engine. This required access to the TCGA data set hosted there as well as construction of a queuing system main node (Slurm was chosen), a variable series of computational nodes, a datastore to hold output data, an analytics database to track computations and a basic visualization system (web page) to inspect computation progress. Compute nodes were created using a custom Ubuntu image with appropriate bioinformatics and queuing software installed and configured. (B) Flowchart of the internal working on a single computational node. The main node submits a sample request to the computational node which then is able to parallelize the computation by splitting the BAM file and running the variant calling pipeline (panel C) in parallel. Information is saved to the analytics database, and output data is moved to the datastore. (C) Full pipeline for variant calling. This follows the canonical TCGA variant calling pipeline using VarScan as well as some custom metadata extraction and storage. (D) Pipeline of Manhattan plot generation pipeline for quality control metrics. Variant output files are downloaded from the datastore, file size is checked for quality control purposes, high confidence VCF files are extracted and indexed with tabix software. Variant calls per 10 000 base window are counted and used as the locations for plotting purposes and the counts are used as the y axis. Output data is arranged in the appropriate form and generated into Manhattan plots using R software.
Figure 2
Figure 2
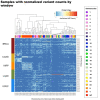
Visualization of each sample w/ normalized counts when whole gene structure is masked: heat map of individual samples’ windows. SNVs within gene regions are masked and therefore removed from this analysis to focus on the non-coding region. SNV density of each window is shown in the color histogram key as normalized counts (normalized as described in the Methods section). Samples (X legend, right) are sorted by cancer type (Y legend, left) and clustered based on chromosome position (X legend, bottom) and chromosome (X legend, top). Dendrogram is based off of similarity of regions that are clustered (top). There is noticeable similarity on specific chromosome windows with high levels of SNV density across BRCA, LUAD and UCEC cancers. COAD and KIRP appear to have different footprints in this sample set versus the other cancers and each other. Clustering among this dimension (not shown) did not reveal any obvious pattern, however. Groups of windows with high levels of SNV density also cluster within each cancer group separately. This is the dimension clustered with the dendrogram and shows segments (specifically on the Y chromosome represented by the pink color in the top axis) where groups of windows with high density SNV counts appear across many if not all of the samples inter-cancer group. The Y chromosome group within KIRP has exceptionally consistent high SNV density that falls on a single chromosome suggesting an active and localized region of onco-related activity.
Figure 3
Figure 3
Significantly mutated 10k base regions found in all race-cancer groupings. (A) visualization of significantly mutated 10k base regions throughout the genome. Chromosomes sizes are proportional to nucleotide length and shown in a circular plot with nucleotide position labels. Each orange bar marks a set of one or more significantly mutated 10k region (P < 0.05) that was found in all 10 cancer and race combinations in the location as labeled. Purple circles represent the average level of variant counts found in those marked regions and are proportional by size (as per the legend in the center of the diagram). Because of overlap, only the largest average in overlapping regions is visible (if a single orange line is representing five in close proximity, significantly mutated 10k regions, only the largest average variant count will be visible at the genome level). These regions exclude gene defined regions and are inclusive of significantly mutated 10k base regions that were found in all cancer and races. A total of 59 windows are shown, although many are clustered around each creating 16 distinct regions from a high-level view. (B) Zoomed in visualization of chromosome X, highlighting the additional windows found that are collapsed on the full genome visualization. Chromosome is shown in circular notation with significantly mutated 10k regions (P < 0.05) that were found across all 10 cancer and race combinations. This visualization shows that the 11 regions found highly mutated in Chromosome X are clustered into two proximate regions around base 60 000 000. (C) Number of 10k base regions found across all cancers and races with counts per chromosome (only chromosomes with at least one 10k window are shown). Chromosome X had the largest count although 12 chromosomes were represented. (D) Table view of the number of universal windows found for each chromosome.
Figure 4
Figure 4
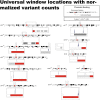
Universal window locations with normalized variant counts. Universal windows are shown across the affected chromosomes here. Giemsa staining regions are also shown, including red regions representing the centromeric regions. Sections of super windows are drawn out for each chromosome. For each of the zoomed in regions, the individual super windows are shown (they are typically clustered, with a few exceptions) with the individual super windows height representing the variation level. These are drawn proportionally across all chromosomes, even though the zoomed region is of different base length size in a few of the illustrations. As shown, many of the super windows across the genome (a strong majority) fall within the centromeric regions or are proximate to them.
Figure 5
Figure 5
Overlaps of super windows between race for each cancer type for gene-masked results. Display of super windows overlap between races for each cancer type. Red represents African American super windows while blue represents White super windows. Super windows are defined as regions where there were statistically significant levels of mutations for stretches of 10k base windows within 10 windows of each other with a minimum of four windows in a stretch. Chromosomes are shown with Giemsa staining regions highlighted. This shows heterochromatic regions staining more darkly depending on how condensed and AT rich they are. These regions are typically gene poor. Gene rich euchromatin regions, on the other hand, are stained lightly or not at all. These regions are typically more transcriptionally active and often associated with the gene coding regions of the genome. Since gene regions have been masked in the super window regions, we anticipate a higher proportion of windows in the stained regions—which is what is seen. The red coloring specifically shows the centromeric regions (for illustration, this does not map to the staining results). There are notable visual similarities in where these highly mutated regions fall, not only within both races for many of them, but even between cancer types themselves suggesting some common areas of structural mutation related to oncogenesis.

Similar articles

Cited by

References

    1. Delseny M, Han B, Hsing YI. High throughput DNA sequencing: the new sequencing revolution. Plant Sci 2010;179:407–22. - PubMed
    1. Koboldt DC, Steinberg KM, Larson DE, et al. . The next-generation sequencing revolution and its impact on genomics. Cell 2013;155:27–38. - PMC - PubMed
    1. Doolittle WF. Is junk DNA bunk? A critique of ENCODE. Proc Natl Acad Sci 2013;5294–5300. - PMC - PubMed
    1. Palazzo AF, Gregory TR. The case for junk DNA. PLoS Genet 2014;10:e1004351. - PMC - PubMed
    1. Pennisi E. Genomics. ENCODE project writes eulogy for junk DNA. Science 2012;1159(1161):337. - PubMed

Publication types