. 2020 Nov;61(11):2593-2608.
doi: 10.1111/epi.16692. Epub 2020 Sep 17.

Microglial phagocytosis dysfunction in the dentate gyrus is related to local neuronal activity in a genetic model of epilepsy

Affiliations

Microglial phagocytosis dysfunction in the dentate gyrus is related to local neuronal activity in a genetic model of epilepsy

Virginia Sierra-Torre et al. Epilepsia. 2020 Nov.

Abstract

Objective: Microglial phagocytosis of apoptotic cells is an essential component of the brain regenerative response during neurodegeneration. Whereas it is very efficient in physiological conditions, it is impaired in mouse and human mesial temporal lobe epilepsy, and now we extend our studies to a model of progressive myoclonus epilepsy type 1 in mice lacking cystatin B (CSTB).

Methods: We used confocal imaging and stereology-based quantification of apoptosis and phagocytosis of the hippocampus of Cstb knockout (KO) mice, an in vitro model of phagocytosis and siRNAs to acutely reduce Cstb expression, and a virtual three-dimensional (3D) model to analyze the physical relationship between apoptosis, phagocytosis, and active hippocampal neurons.

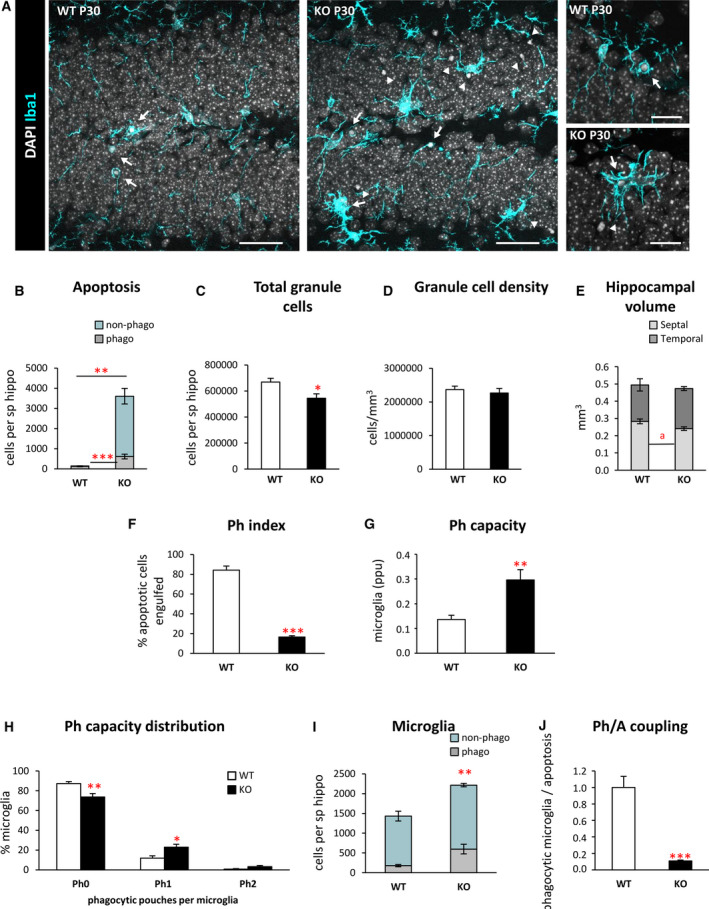
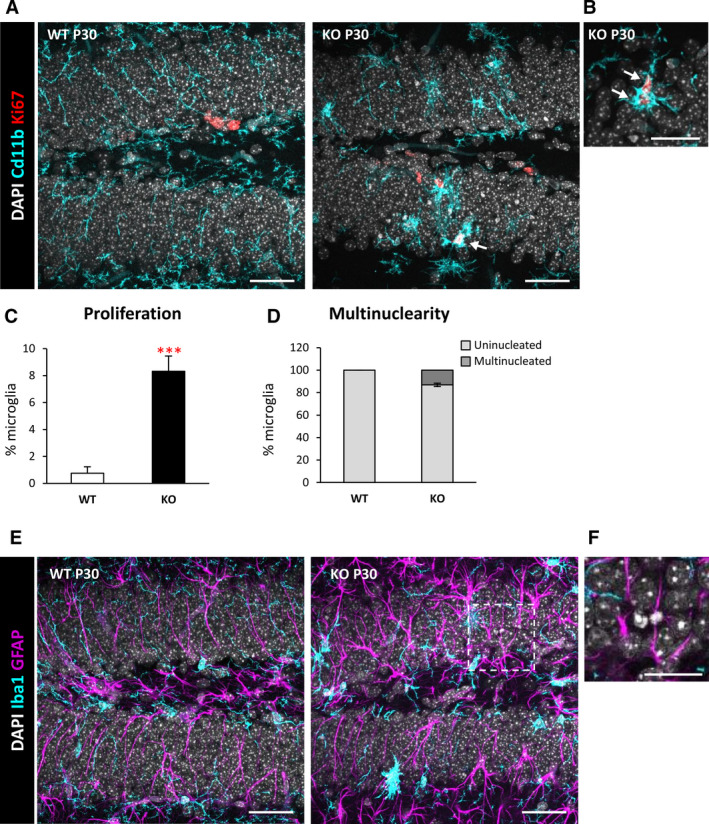
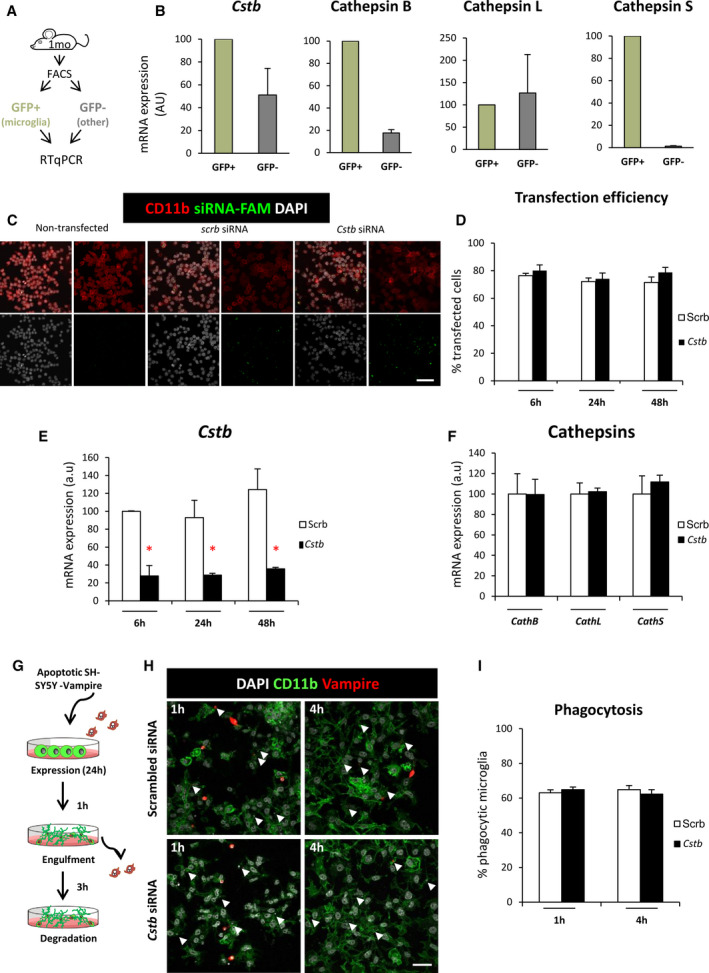
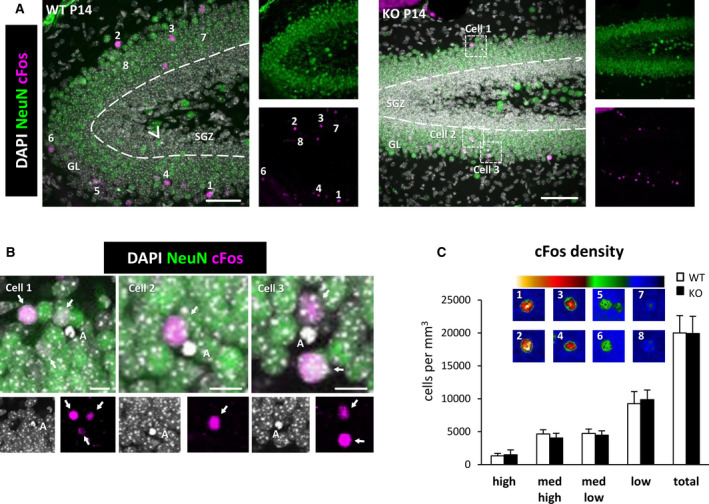
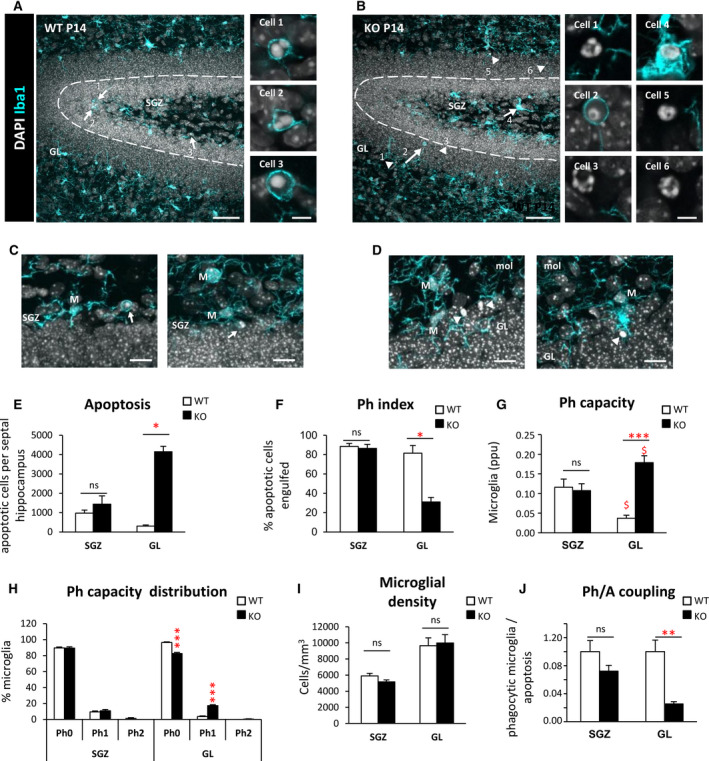
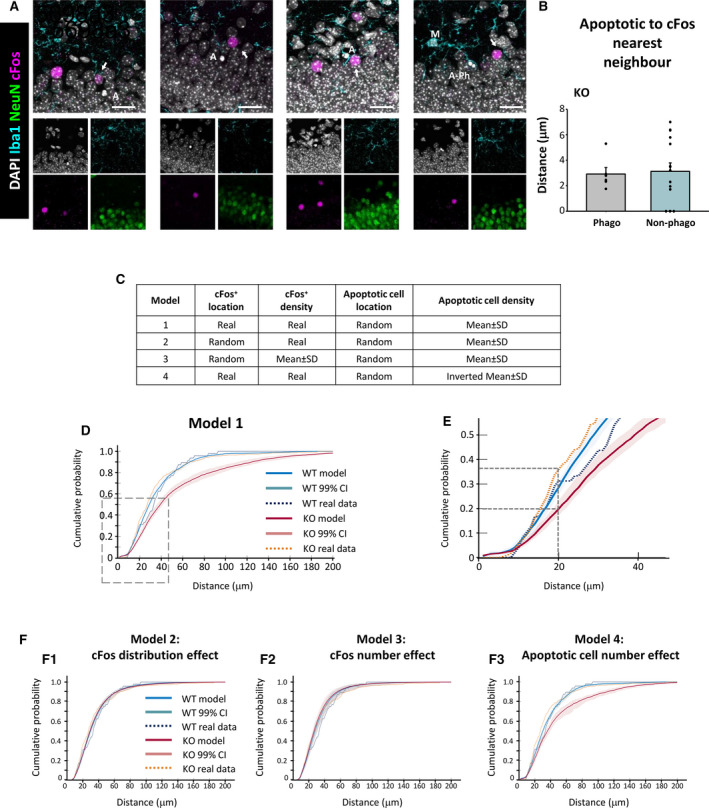
Results: Microglial phagocytosis was impaired in the hippocampus of Cstb KO mice at 1 month of age, when seizures arise and hippocampal atrophy begins. This impairment was not related to the lack of Cstb in microglia alone, as shown by in vitro experiments with microglial Cstb depletion. The phagocytosis impairment was also unrelated to seizures, as it was also present in Cstb KO mice at postnatal day 14, before seizures begin. Importantly, phagocytosis impairment was restricted to the granule cell layer and spared the subgranular zone, where there are no active neurons. Furthermore, apoptotic cells (both phagocytosed and not phagocytosed) in Cstb-deficient mice were at close proximity to active cFos+ neurons, and a virtual 3D model demonstrated that the physical relationship between apoptotic cells and cFos+ neurons was specific for Cstb KO mice.

Significance: These results suggest a complex crosstalk between apoptosis, phagocytosis, and neuronal activity, hinting that local neuronal activity could be related to phagocytosis dysfunction in Cstb KO mice. Overall, these data suggest that phagocytosis impairment is an early feature of hippocampal damage in epilepsy and opens novel therapeutic approaches for epileptic patients based on targeting microglial phagocytosis.

Keywords: apoptosis; epilepsy; hippocampus; microglia; phagocytosis; seizures.


Conflict of interest statement

None of the authors has any conflict of interest to disclose.

Figures

FIGURE 1
FIGURE 1
Microglial phagocytosis is impaired in the dentate gyrus (DG) of postnatal day 30 (P30) Cstb knockout (KO) mice. A, Representative confocal images of the DG in wild‐type (WT) and Cstb KO P30 mice. Healthy or apoptotic (pyknotic/karyorrhectic) nuclear morphology was visualized with 4,6‐diamidino‐2‐phenylindole (DAPI; white), and microglia were stained for Iba1 (cyan). High‐magnification examples of phagocytic microglia following the typical “ball‐and‐chain” form (upper right panel), with the tip of their processes or phagocytosing with their soma (lower right panel). Arrows point to apoptotic cells engulfed by microglia (Iba1+), and arrowheads point to nonphagocytosed apoptotic cells. B, Number of apoptotic cells (pyknotic/karyorrhectic) in the septal hippocampus (sp hippo; n = 6 animals per condition) showing both phagocytosed (phago) and nonphagocytosed (non‐phago) apoptotic cells. C, Total number of granule cells per septal hippocampus. D, Density of granule cells (per mm3) in the septal hippocampus of both WT and Cstb KO P30 mice. E, Proportion (in mm3) between the volume of the septal and the temporal portions of the hippocampus in WT and Cstb KO P30 mice. F, Phagocytic index (Ph index; in % of apoptotic cells being engulfed by microglia) in the septal hippocampus. G, Weighted phagocytic capacity (Ph capacity) of DG microglia (in parts per unit [ppu]). H, Histogram showing the Ph capacity distribution of DG microglia (in % of microglial cells with 0‐2 phagocytic pouches [Ph]). I, Number of phagocytic (Iba1 + with DAPI inclusions) and nonphagocytic microglial cells (Iba1 + with no DAPI inclusions) per septal hippocampus. J, Phagocytosis/apoptosis (Ph/A; in fold change) in the septal hippocampus. Bars represent the mean ± standard error of the mean. *P < .05, **P < .01, ***P < .001, a P = .052 by one‐tailed Student t test. Scale bars = 40 µm (A, low magnification), 20 µm (A, high magnification); z‐thickness = 7 µm (A, low magnification), 3.5 µm (A, high magnification)
FIGURE 2
FIGURE 2
Increased proliferation and multinuclearity in the dentate gyrus (DG) of postnatal day 30 (P30) Cstb knockout (KO) mice. A, DG general view of both wild‐type (WT) and Cstb KO P30 mice. Proliferating cells were stained for Ki67 (marker for all the active phases of the cell cycle), nuclei (4,6‐diamidino‐2‐phenylindole [DAPI]), and microglia (CD11b). B, High‐magnification image of proliferating Ki67+ microglia in P30 Cstb KO mice. Arrows in A and B point to Ki67+ microglia. C, Percentage of proliferating microglia assessed by the marker Ki67. D, Proportion (in %) between uninucleated and multinucleated microglia in the septal hippocampus of WT and Cstb KO P30 mice. E, Representative images of the DG in WT and Cstb KO mice stained for DAPI (nuclei), microglia (Iba1), and astrocytes (glial fibrillary acidic protein [GFAP]). F, High‐magnification image of an apoptotic cell not phagocytosed by either microglia or astrocytes in Cstb KO mice. Bars represent the mean ± standard error of the mean. ***P < .001 by one‐tailed Student t test. Scale bars = 40 µm (A), 20 µm (B), 40 µm (E), 20 µm (F); z‐thickness = 7 μm (A, E), 3.5 μm (B)
FIGURE 3
FIGURE 3
Cstb knockdown in microglia does not alter phagocytosis in vitro. A, Experimental design used to isolate microglia (green fluorescent protein [GFP]+) from nonmicroglial cells (GFP−) for the hippocampi of 1‐month‐old mice using flow cytometry and quantitative reverse transcription polymerase chain reaction (RT‐qPCR) for gene expression analysis. B, Expression of CSTB gene and cathepsins B, L, and S in microglia (GFP+) versus nonmicroglial cells (GFP−) in flow‐activated cell sorting (FACS)‐sorted cells from fms‐EGFP mice, in which the promoter of the fms gene, encoding for the macrophage colony stimulating factor receptor 1, drives the expression of the enhanced green fluorescent protein mouse hippocampi. Ornithine decarboxylase antizyme 1 (OAZ1) was selected as a reference gene. C, Representative confocal images of nontransfected (left panels) and scrambled/Cstb siRNA transfected BV2 microglia (middle and right panels). Nuclei are stained with 4,6‐diamidino‐2‐phenylindole (DAPI; white), BV2 microglia were stained for CD11b (red), and siRNA transfection was assessed by 6‐carboxyfluorescein (green) labeling. D, Percentage of scrambled/Cstb siRNA transfected cells along a time course (6, 24, and 48 hours). E, RT‐qPCR Cstb gene expression in BV2 cells after Cstb siRNA silencing through a time course (6, 24, and 48 hours), using OAZ1 as a reference gene. F, RT‐qPCR cathepsins B, L, and S gene expression in BV2 cells 24 hours after siRNA Cstb silencing, using OAZ1 as a reference gene. G, Experimental design of the phagocytosis assay performed 24 hours after BV2 siRNA transfection. Knockdown BV2 cells are fed for 1 and 4 hours with apoptotic SH‐SY5Y vampire neurons. H, Representative confocal images of scrambled and Cstb siRNA transfected BV2 cells (CD11b staining, green) fed with apoptotic SH‐SY5Y vampire neurons (red) for 1 and 4 hours. Arrowheads show phagocytosed SH‐SY5Y vampire fragments or full cells. I, Percentage of phagocytic BV2 cells after 1 and 4 hours of phagocytosis. Only particles fully enclosed by BV2 pouches were identified as phagocytosis. Bars represent the mean ± standard error of the mean. *P < .05 by two‐way analysis of variance. Scale bars = 60 µm (C), 40 µm (H)
FIGURE 4
FIGURE 4
cFos+ cells in the dentate gyrus (DG) of wild‐type (WT) and Cstb knockout (KO) postnatal day 14 (P14) mice. A, Representative confocal images of the DG of WT and Cstb KO mice. Healthy or apoptotic (pyknotic/karyorrhectic) nuclear morphology was visualized with 4,6‐diamidino‐2‐phenylindole (DAPI; white), neurons were identified with the neuronal marker NeuN (green), and activated neurons were stained for the early expression gene cFos (magenta). Arrowhead points to an apoptotic cell in the subgranular zone (SGZ) in WT mice; framed apoptotic cells in Cstb KO mice are shown in B. Numbered cFos+ cells are shown in C, as cells with high (1, 2), medium‐high (3, 4), medium‐low (5, 6), and low (7,8) cFos intensity. GL, granular layer. (B) High‐magnification examples showing the close proximity between apoptotic cells (DAPI, white) and cFos+ neurons (magenta) in Cstb KO mice. Granular neurons are stained with NeuN (green). Arrows point to cFos+ neurons. C, Distribution of cFos+ cells in WT and Cstb KO mice (per mm3). The color code indicates the classification criteria of the cFos+ cells based on their intensity (high, medium‐high, medium‐low, low). A total of 1046 cells for WT P14 mice and 713 cells for Cstb KO mice were quantified and classified according to their cFos expression. No significant differences were found. Scale bars = 50 μm (A), 10 μm (B); z‐thickness = 28 µm (A, WT), 17.5 µm (A, KO)
FIGURE 5
FIGURE 5
Phagocytosis impairment is specific to the granule cell layer in Cstb knockout (KO) mice at postnatal day 14 (P14). A, B, Dentate gyrus (DG) general view of both wild‐type (WT) and Cstb KO P14 mice. Nuclei are stained with 4,6‐diamidino‐2‐phenylindole (DAPI; white) and microglia with Iba1 (cyan). Closeup images show phagocytosed and nonphagocytosed apoptotic cells in WT and Cstb KO P14 mice. GL, granular layer; SGZ, subgranular zone. C, D, Representative images of apoptotic cells (condensed DAPI) engulfed by microglia (M; cyan) in the SGZ of WT P14 mice (C) and nonphagocytosed cells in the GL of Cstb KO P14 mice (D). Arrows point to phagocytosed apoptotic cells and arrowheads to nonphagocytosed apoptotic cells (A‐D). E, Number of apoptotic cells (pyknotic/karyorrhectic) both in the SGZ and GL, per septal hippocampus (n = 12 animal for each condition). F, Phagocytic index (Ph index; in % of apoptotic cells being engulfed by microglia) in the SGZ and GL of the septal hippocampus in WT and Cstb KO P14 mice. G, Histogram showing the phagocytic capacity (Ph capacity) distribution of DG microglia (in % of microglial cells) in the SGZ and GL. H, Weighted Ph capacity of DG microglia (in parts per unit). I, Microglial density (cells/mm3) per septal hippocampus in both WT and Cstb KO P14 mice, distinguishing between SGZ and GL. J, Phagocytosis/apoptosis (Ph/A; in fold change) in the SGZ and GL of the septal hippocampus in WT and Cstb KO P14 mice. Bars represent the mean ± standard error of the mean. *P < .05, **P < .01, ***P < .001 by Student t test comparing WT versus KO. ns, not significant. Scale bars = 50 μm (A, B), 5 μm (inserts in A, B), 30 μm (C, D); z‐thickness = 18.9 µm (A, B), 9.8 µm (C left), 16.1 (C right), 11.2 µm (D left), 12.6 µm (D right). $ means P < .005 comparing GL vs SGL
FIGURE 6
FIGURE 6
Proximal relationship between apoptotic cells and cFos+ neurons in the granule cell layer of Cstb knockout (KO) mice. A, Representative confocal images of the granular layer of Cstb KO mice. Healthy or apoptotic (pyknotic/karyorrhectic) nuclear morphology was visualized with 4,6‐diamidino‐2‐phenylindole (DAPI; white), neurons were identified with the neuronal marker NeuN (green), microglia (M) were identified with Iba1 (cyan), and activated neurons were stained for the early expression gene cFos (magenta). Both phagocytosed (A‐Ph) and nonphagocytosed apoptotic cells (A) were close to cFos+ neurons (arrows). B, Quantification of distance from phagocytosed (Phago) and nonphagocytosed (Non‐phago) apoptotic cells to the cFos+ nearest neighbor (NN), for those cells that met the inclusion criteria (see Materials and Methods). C, Summary of the different simulation models based on the location and density of cFos+ and apoptotic cells. D, Cumulative probability of the distances between apoptotic cells and NN cFos+ neurons for wild‐type (WT; blue) and Cstb KO mice (red), resulting from 10 000 simulations of a virtual three‐dimensional (3D) model, indicating the 99% confidence interval (CI). The cumulative probability for real (measured) data is shown for WT (dotted blue) and Cstb KO (dotted orange). E, Amplification of the area shown in D. F, Cumulative probabilities of the distances between apoptotic cells and NN cFos+ neurons for WT (blue) and Cstb KO mice (red), resulting from 10 000 simulations of the indicated virtual 3D model. Scale bars indicate 20 μm. z‐thickness = 9.1 µm, 7.7 µm, 16.8 µm, 9.1 µm (A, from left to right)

Similar articles

Cited by

References

    1. Joensuu T, Lehesjoki AE, Kopra O. Molecular background of EPM1‐Unverricht‐Lundborg disease. Epilepsia. 2008;49:557–63. - PubMed
    1. Lalioti MD, Scott HS, Buresi C, Rossier C, Bottani A, Morris MA, et al. Dodecamer repeat expansion in cystatin B gene in progressive myoclonus epilepsy. Nature. 1997;386:847–51. - PubMed
    1. Pennacchio LA, Lehesjoki A‐E, Stone NE, Willour VL, Virtaneva K, Miao J, et al. Mutations in the gene encoding cystatin B in progressive myoclonus epilepsy (EPM1). Science. 1996;271:1731–4. - PubMed
    1. Riccio M, Di Giaimo R, Pianetti S, Palmieri PP, Melli M, Santi S. Nuclear localization of cystatin B, the cathepsin inhibitor implicated in myoclonus epilepsy (EPM1). Exp Cell Res. 2001;262:84–94. - PubMed
    1. Koskenkorva P, Niskanen E, Hyppönen J, Könönen M, Mervaala E, Soininen H, et al. Sensorimotor, visual, and auditory cortical atrophy in Unverricht‐Lundborg disease mapped with cortical thickness analysis. AJNR Am J Neuroradiol. 2012;33:878–83. - PMC - PubMed

Publication types