

Quantification of cancer driver mutations in human breast and lung DNA using targeted, error-corrected CarcSeq
- PMID: 32940377
- PMCID: PMC7756507
- DOI: 10.1002/em.22409
Quantification of cancer driver mutations in human breast and lung DNA using targeted, error-corrected CarcSeq
Abstract
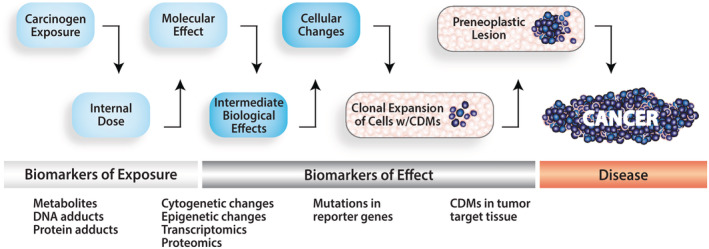
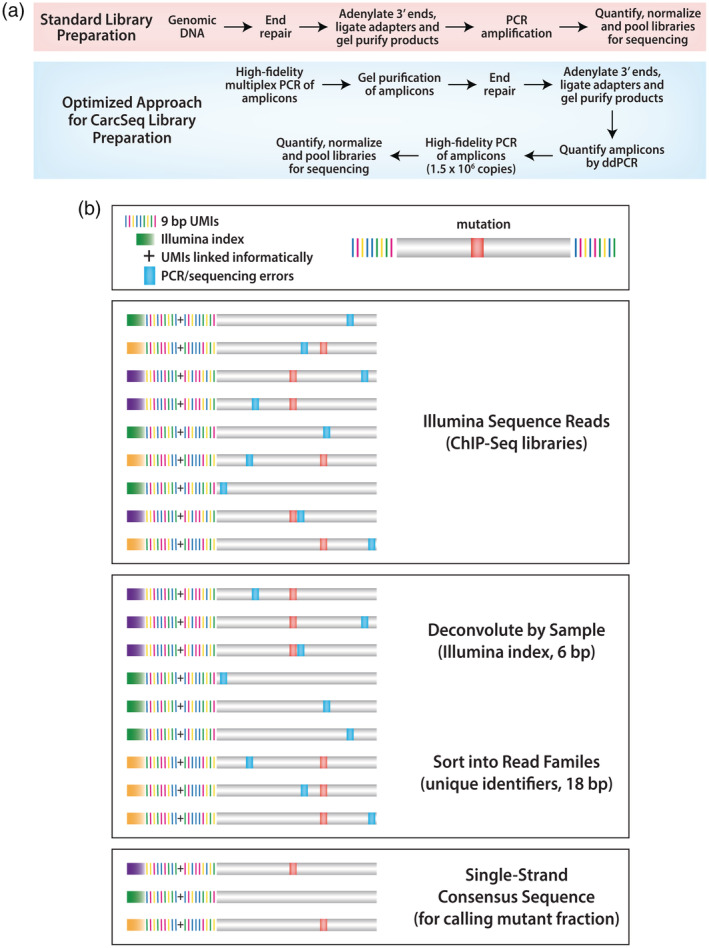
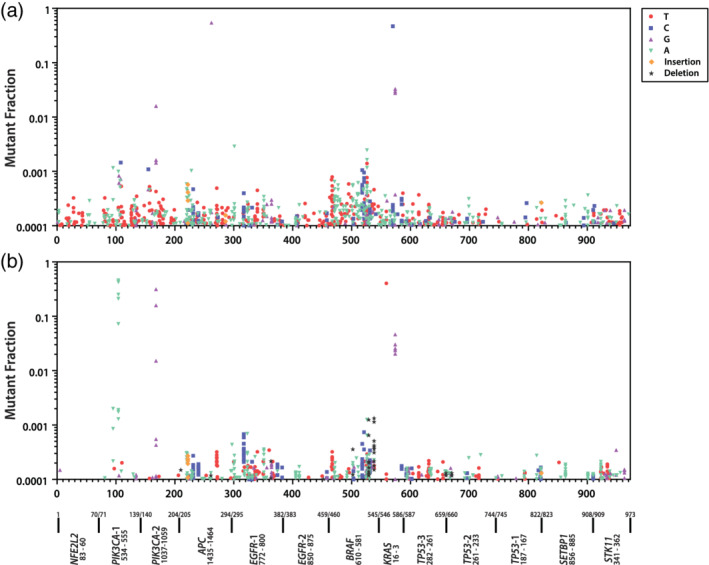
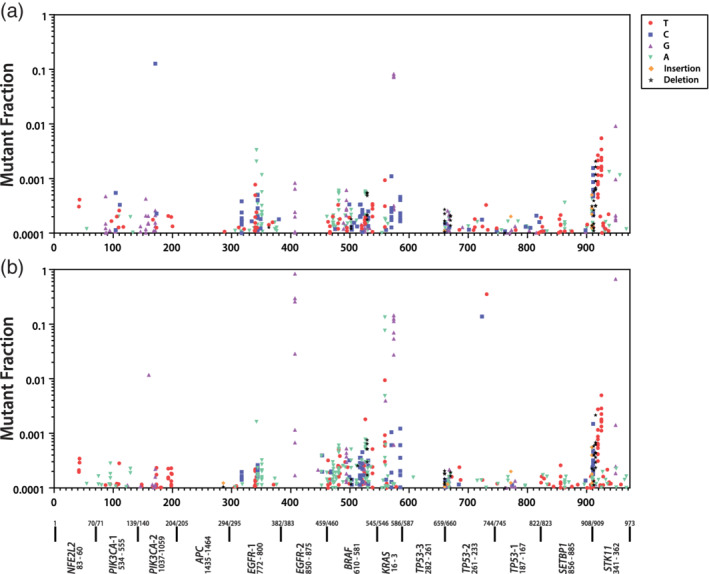
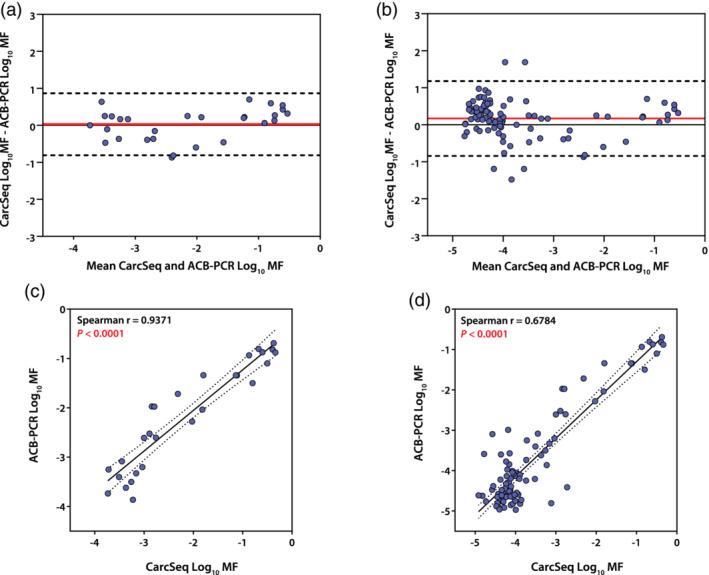
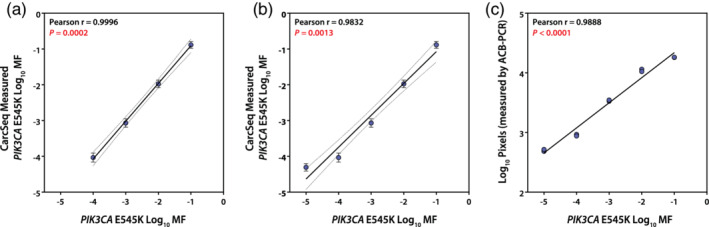
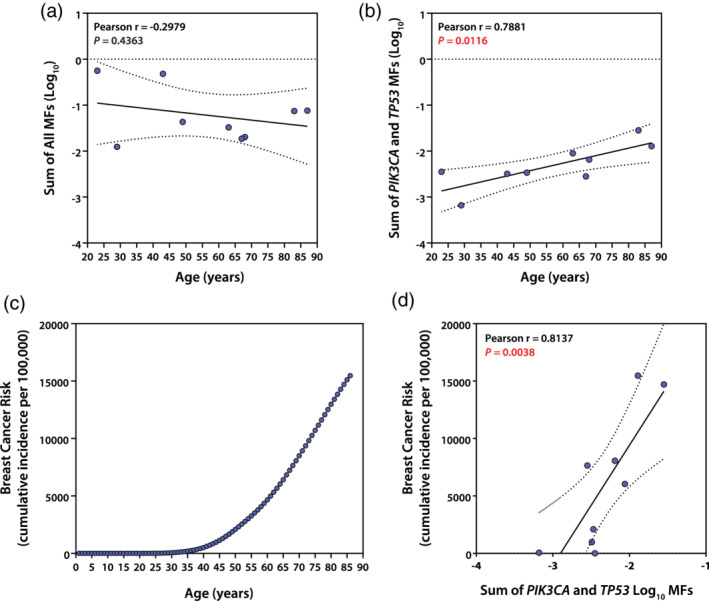
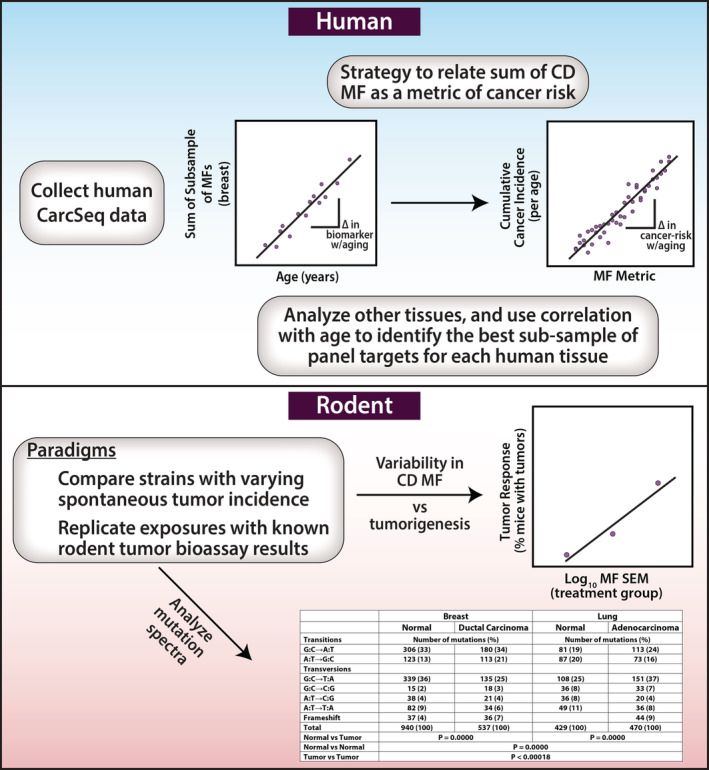
There is a need for scientifically-sound, practical approaches to improve carcinogenicity testing. Advances in DNA sequencing technology and knowledge of events underlying cancer development have created an opportunity for progress in this area. The long-term goal of this work is to develop variation in cancer driver mutation (CDM) levels as a metric of clonal expansion of cells carrying CDMs because these important early events could inform carcinogenicity testing. The first step toward this goal was to develop and validate an error-corrected next-generation sequencing method to analyze panels of hotspot cancer driver mutations (hCDMs). The "CarcSeq" method that was developed uses unique molecular identifier sequences to construct single-strand consensus sequences for error correction. CarcSeq was used for mutational analysis of 13 amplicons encompassing >20 hotspot CDMs in normal breast, normal lung, ductal carcinomas, and lung adenocarcinomas. The approach was validated by detecting expected differences related to tissue type (normal vs. tumor and breast vs. lung) and mutation spectra. CarcSeq mutant fractions (MFs) correlated strongly with previously obtained ACB-PCR mutant fraction (MF) measurements from the same samples. A reconstruction experiment, in conjunction with other analyses, showed CarcSeq accurately quantifies MFs ≥10-4 . CarcSeq MF measurements were correlated with tissue donor age and breast cancer risk. CarcSeq MF measurements were correlated with deviation from median MFs analyzed to assess clonal expansion. Thus, CarcSeq is a promising approach to advance cancer risk assessment and carcinogenicity testing practices. Paradigms that should be investigated to advance this strategy for carcinogenicity testing are proposed.
Keywords: ACB-PCR; cancer risk assessment; carcinogenesis; clonal expansion; next-generation sequencing.
Published 2020. This article is a U.S. Government work and is in the public domain in the USA. Environmental and Molecular Mutagenesis published by Wiley Periodicals LLC on behalf of Environmental Mutagen Society.
Conflict of interest statement
The authors declare they have no actual or potential competing financial interests.
Figures
Similar articles
-
Assessment of Clonal Expansion Using CarcSeq Measurement of Lung Cancer Driver Mutations and Correlation With Mouse Strain- and Sex-Related Incidence of Spontaneous Lung Neoplasia.Toxicol Sci. 2021 Oct 27;184(1):1-14. doi: 10.1093/toxsci/kfab098. Toxicol Sci. 2021. PMID: 34373914
-
CarcSeq Measurement of Rat Mammary Cancer Driver Mutations and Relation to Spontaneous Mammary Neoplasia.Toxicol Sci. 2021 Jul 16;182(1):142-158. doi: 10.1093/toxsci/kfab040. Toxicol Sci. 2021. PMID: 33822199
-
Tissue and Sex-Specific Performance of a Cancer Driver Based Biomarker in rasH2-Tg Mice.Environ Mol Mutagen. 2025 Aug 13. doi: 10.1002/em.70027. Online ahead of print. Environ Mol Mutagen. 2025. PMID: 40799151
-
Rationale and Roadmap for Developing Panels of Hotspot Cancer Driver Gene Mutations as Biomarkers of Cancer Risk.Environ Mol Mutagen. 2020 Jan;61(1):152-175. doi: 10.1002/em.22326. Epub 2019 Oct 6. Environ Mol Mutagen. 2020. PMID: 31469467 Free PMC article. Review.
-
Clonal expansion of cancer driver gene mutants investigated using advanced sequencing technologies.Mutat Res Rev Mutat Res. 2024 Jul-Dec;794:108514. doi: 10.1016/j.mrrev.2024.108514. Epub 2024 Oct 5. Mutat Res Rev Mutat Res. 2024. PMID: 39369952 Review.
Cited by
-
Antiprogestins reduce epigenetic field cancerization in breast tissue of young healthy women.Genome Med. 2022 Jun 15;14(1):64. doi: 10.1186/s13073-022-01063-5. Genome Med. 2022. PMID: 35701800 Free PMC article. Clinical Trial.
-
Early NOTCH1 mutation is positively selected but epistatically suppresses evolution of later esophageal squamous-cell carcinoma drivers.bioRxiv [Preprint]. 2025 Jun 25:2023.11.03.565535. doi: 10.1101/2023.11.03.565535. bioRxiv. 2025. PMID: 40667321 Free PMC article. Preprint.
-
Low-Frequency Mutational Heterogeneity of Invasive Ductal Carcinoma Subtypes: Information to Direct Precision Oncology.Int J Mol Sci. 2019 Feb 26;20(5):1011. doi: 10.3390/ijms20051011. Int J Mol Sci. 2019. PMID: 30813596 Free PMC article.
-
Outgrowth of erlotinib-resistant subpopulations recapitulated in patient-derived lung tumor spheroids and organoids.PLoS One. 2020 Sep 8;15(9):e0238862. doi: 10.1371/journal.pone.0238862. eCollection 2020. PLoS One. 2020. PMID: 32898185 Free PMC article.
-
CarcSeq detection of lorcaserin-induced clonal expansion of Pik3ca H1047R mutants in rat mammary tissue.Toxicol Sci. 2024 Sep 1;201(1):129-144. doi: 10.1093/toxsci/kfae070. Toxicol Sci. 2024. PMID: 38851877 Free PMC article.
References
-
- Adams, W.T. and Skopek, T.R. (1987) Statistical test for the comparison of samples from mutational spectra. Journal of Molecular Biology, 194(3), 391–396. - PubMed
-
- Boorman, G.A. , Maronpot, R.R. and Eustis, S.L. (1994) Rodent carcinogenicity bioassay: past, present, and future. Toxicologic Pathology, 22(2), 105–111. - PubMed
-
- Brash, D.E. (2016) How do mutant clones expand in Normal tissue? In: Maley C.C. and Greaves M. (Eds.) Frontiers in cancer research: evolutionary foundations, revolutionary directions. New York, NY: Springer New York, pp. 61–98.
Publication types
MeSH terms
Grants and funding
LinkOut - more resources
Full Text Sources
Medical
Miscellaneous
