

Validation and comparison of the National Eye Institute Visual Functioning Questionnaire-25 (NEI VFQ-25) and the Visual Function Index-14 (VF-14) in patients with cataracts: a multicentre study
- PMID: 32940410
- PMCID: PMC8359188
- DOI: 10.1111/aos.14606
Validation and comparison of the National Eye Institute Visual Functioning Questionnaire-25 (NEI VFQ-25) and the Visual Function Index-14 (VF-14) in patients with cataracts: a multicentre study
Abstract
Purpose: The present study aimed to investigate and compare the psychometric properties of the National Eye Institute Visual Functioning Questionnaire-25 (NEI VFQ-25) and the Visual Function Index-14 (VF-14) in a large sample of patients with cataracts.
Methods: A total of 1052 patients with bilateral age-related cataracts were recruited in the study. Patients with other comorbidities that severely impacted vision were excluded. Participants completed the two questionnaires in random order. Classical test theory and Rasch analyses were used to assess the psychometric properties of the questionnaires.
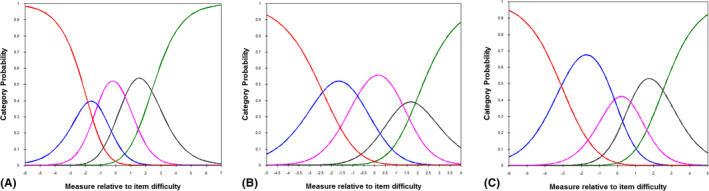
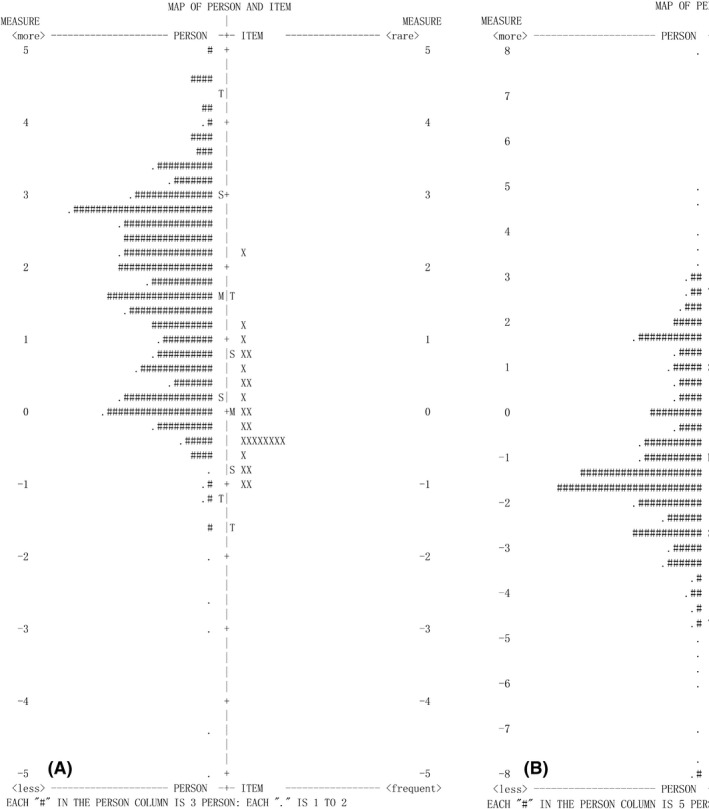
Results: Complete data were obtained from 899 patients. The mean overall index score on the NEI VFQ-25 was 76.1 ± 19.0, while that on the VF-14 was 46.5 ± 15.0. Cronbach's α-values for the NEI VFQ-25 and VF-14 were 0.89 and 0.95, respectively. Ceiling effects were observed on nine of the 12 subscales in the NEI VFQ-25. The correlation between total scores on the NEI VFQ-25 and VF-14 was moderate (r = 0.600; p < 0.001), and subscales of the NEI VFQ-25 were weakly or moderately correlated with the similar domains on the VF-14. Rasch analysis revealed ordered category thresholds and sufficient person separation for both instruments, while the two questionnaires had critical deficiencies in unidimensionality, targeting and differential item functioning.
Conclusion: Neither the NEI VFQ-25 nor VF-14 is optimal for the assessment of vision-related quality of life in typical Chinese patients with cataracts. The potential deficiencies of the questionnaires should be taken into consideration prior to application of the instruments or interpretation of the results.
Keywords: NEI VFQ-25; Rasch analysis; VF-14; cataract; psychometric properties; vision-related quality of life.
© 2020 The Authors. Acta Ophthalmologica published by John Wiley & Sons Ltd on behalf of Acta Ophthalmologica Scandinavica Foundation.
Figures
Similar articles
-
Cross-cultural validation of the National Eye Institute Visual Function Questionnaire.J Cataract Refract Surg. 2014 May;40(5):774-84. doi: 10.1016/j.jcrs.2013.10.040. J Cataract Refract Surg. 2014. PMID: 24767911
-
Remediating serious flaws in the National Eye Institute Visual Function Questionnaire.J Cataract Refract Surg. 2010 May;36(5):718-32. doi: 10.1016/j.jcrs.2009.11.019. J Cataract Refract Surg. 2010. PMID: 20457362
-
Development of a new Rasch-based scoring algorithm for the National Eye Institute Visual Functioning Questionnaire to improve its interpretability.Health Qual Life Outcomes. 2017 Aug 14;15(1):157. doi: 10.1186/s12955-017-0726-5. Health Qual Life Outcomes. 2017. PMID: 28807029 Free PMC article.
-
A Review of Studies of the Association of Vision-Related Quality of Life with Measures of Visual Function and Structure in Patients with Glaucoma in the United States.Ophthalmic Epidemiol. 2021 Jun;28(3):265-276. doi: 10.1080/09286586.2020.1863992. Epub 2021 Feb 3. Ophthalmic Epidemiol. 2021. PMID: 33530788 Free PMC article. Review.
-
Assessment of patient-reported outcome measures used in corneal transplantation: a systematic review.Clin Exp Optom. 2022 Nov;105(8):783-792. doi: 10.1080/08164622.2022.2033106. Epub 2022 Mar 6. Clin Exp Optom. 2022. PMID: 35253619
Cited by
-
Vision-related quality of life after surgery for vitreoretinal disorders in a Mexican population: an observational study.Sci Rep. 2023 Mar 25;13(1):4885. doi: 10.1038/s41598-023-32152-z. Sci Rep. 2023. PMID: 36966208 Free PMC article.
-
Cognitive Behavioral Therapy Improves the Quality of Life for Patients with Mild to Moderate Depression due to Glaucoma or Cataracts: A Retrospective Study.Actas Esp Psiquiatr. 2025 Mar;53(2):245-252. doi: 10.62641/aep.v53i2.1673. Actas Esp Psiquiatr. 2025. PMID: 40071378 Free PMC article.
-
A prospective study of a new presbyopia pseudophakic intraocular lens: Safety, efficacy and satisfaction.Indian J Ophthalmol. 2022 Sep;70(9):3305-3310. doi: 10.4103/ijo.IJO_2795_21. Indian J Ophthalmol. 2022. PMID: 36018109 Free PMC article.
-
Validation and comparison of EQ-5D-5L and SF-6Dv1 in myopic patients requiring corneal refractive surgery in China.Health Qual Life Outcomes. 2025 Aug 22;23(1):78. doi: 10.1186/s12955-025-02411-w. Health Qual Life Outcomes. 2025. PMID: 40847350
-
Exploring Vision-Related Quality of Life: A Qualitative Study Comparing Patients' Experience of Cataract Surgery with a Standard Monofocal IOL and an Enhanced Monofocal IOL.Clin Ophthalmol. 2022 May 27;16:1641-1652. doi: 10.2147/OPTH.S358386. eCollection 2022. Clin Ophthalmol. 2022. PMID: 35656389 Free PMC article.
References
-
- Andrich D (1978): A rating formulation for ordered response categories. Psychometrika 43: 561–573.
-
- Chiang PP, Fenwick E, Marella M, Finger R & Lamoureux E (2011): Validation and reliability of the VF‐14 questionnaire in a German population. Invest Ophthalmol Vis Sci 52: 8919–8926. - PubMed
-
- Chylack LT Jr, Wolfe JK, Singer DM et al. (1993): The Lens Opacities Classification System III. The Longitudinal Study of Cataract Study Group. Arch Ophthalmol (Chicago, Ill : 1960) 111: 831–836. - PubMed
Publication types
MeSH terms
Grants and funding
LinkOut - more resources
Full Text Sources
Medical
