. 2020 Nov 1;129(5):1193-1202.
doi: 10.1152/japplphysiol.00452.2020. Epub 2020 Sep 17.

Traube-Hering waves are formed by interaction of respiratory sinus arrhythmia and pulse pressure modulation in healthy men

Affiliations

Traube-Hering waves are formed by interaction of respiratory sinus arrhythmia and pulse pressure modulation in healthy men

William H Barnett et al. J Appl Physiol (1985). .

Abstract

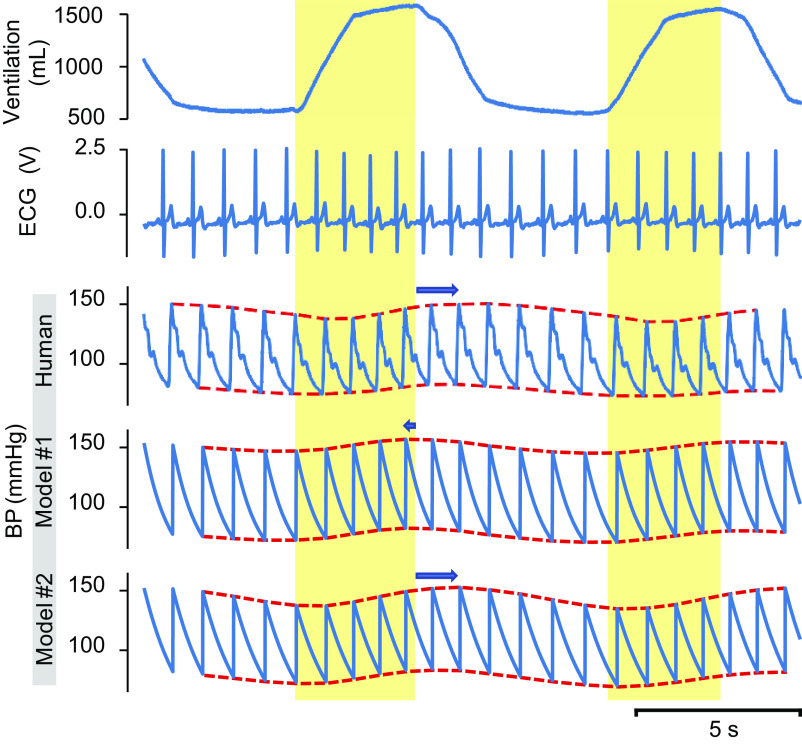
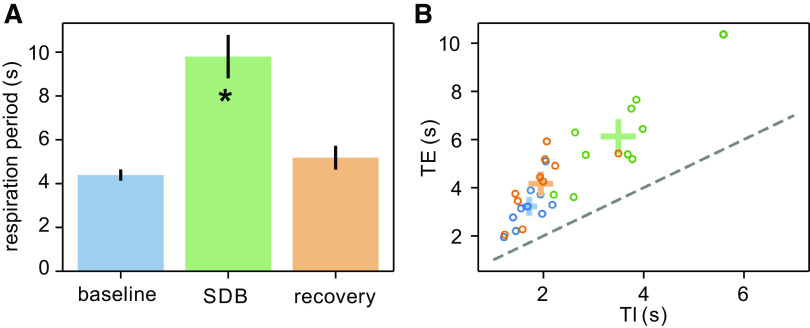
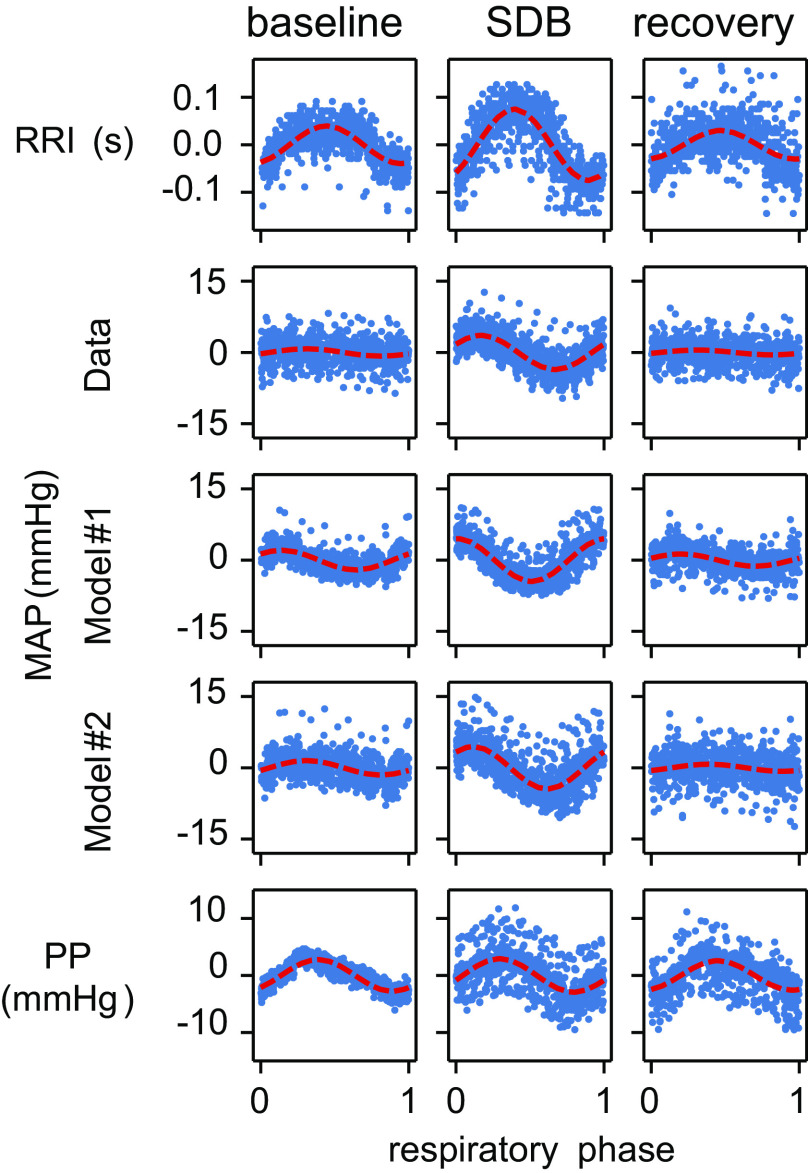
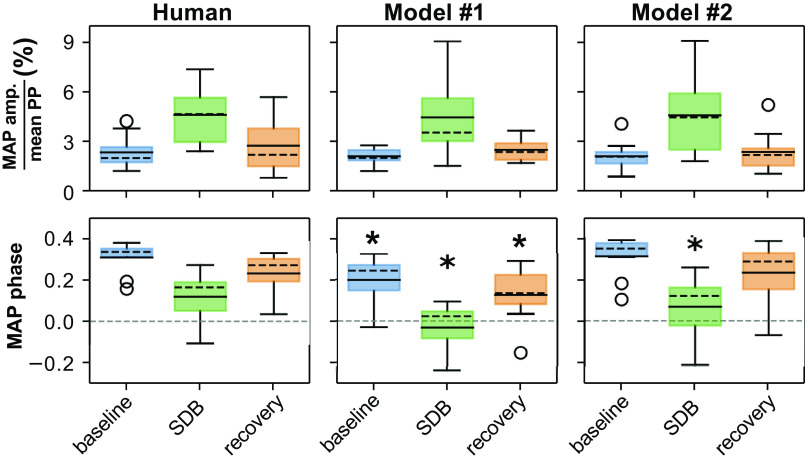
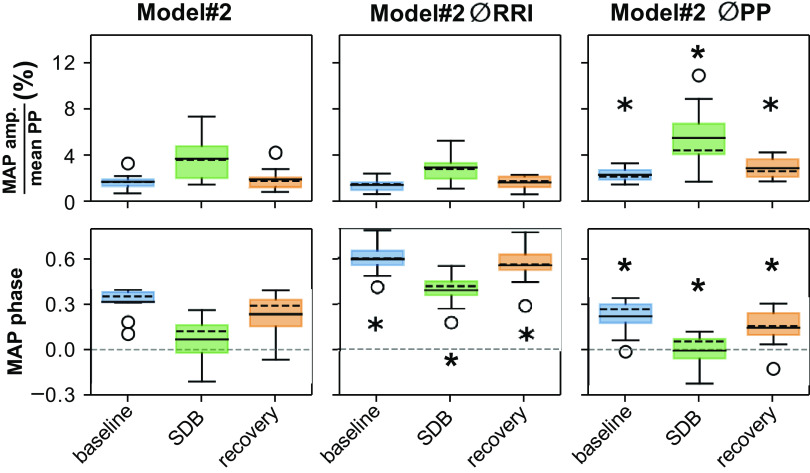
Excessive blood pressure variation is linked to the development of hypertension and other diseases. This study assesses the relative role of respiratory sinus arrhythmia (RSA) and pulse pressure (PP) on the amplitude and timing of blood pressure variability with respiration [Traube-Hering (TH) waves]. We analyzed respiratory, electrocardiogram, and blood pressure traces from healthy, supine male subjects (n = 10, mean age = 26.7 ± 1.4) during 20-min epochs of resting, slow deep breathing (SDB), and recovery. Across all epochs, blood pressure and heart rate (HR) were modulated with respiration and the magnitude of RSA; TH waves increased during SDB. The data were deconstructed using a simple mathematical model of blood pressure to dissect the relative roles of RSA and PP on TH waves. We constructed the time series of the R-wave peaks and compared the recorded TH waves with that predicted by the model. Given that cardiac output is determined by both heart rate and stroke volume, it was surprising that the magnitude of the TH waves could be captured by only HR modulation. However, RSA alone did not accurately predict the timing of TH waves relative to the respiratory cycle. Adding respiratory modulation of PP to the model corrected the phase shift showing the expected pattern of BP rising during inspiration with the peak of the TH wave during early expiration. We conclude that short-term variability of blood pressure referred to as TH waves has at least two independent mechanisms whose interaction forms their pattern: RSA and respiratory-driven changes in PP.NEW & NOTEWORTHY Variability in blood pressure has become an important metric to consider as more is learned about the link between excessive blood pressure variability and adverse health outcomes. In this study using slow deep breathing in human subjects, we found that heart rate and pulse pressure variations have comparable effects on the amplitude of blood pressure waves, and it is the common action of the two that defines the phase relationship between respiration and blood pressure oscillations.

Keywords: blood pressure; cardiorespiratory coupling; heart rate variability; pulse pressure.


Conflict of interest statement

No conflicts of interest, financial or otherwise, are declared by the authors.

Figures

Fig. 1.
Fig. 1.
Physiological recordings from a volunteer participant during slow deep breathing. Recordings include tidal volume [VT, 1st (top) trace], electrocardiogram (ECG, 2nd trace), and arterial blood pressure (BP, 3rd trace). Simulations of blood pressure from Model 1 (4th trace) and Model 2 [5th (bottom) trace] use features of the participant’s cardiovascular data as an input. The yellow-shaded intervals correspond to inspiration. The red dotted lines superimpose on the human BP tracing, and model BP traces delineate the modulation of the end-systolic and end-diastolic BP. The blue arrows show a shift of the BP modulation envelope relative to the transition time from inspiration to expiration.
Fig. 2.
Fig. 2.
The blue, green, and orange data, respectively, correspond to the baseline, slow deep breathing (SDB), and recovery epochs. A: respiratory duration increases during SDB. B: expiratory durations (TE) and inspiratory durations (TI) for each participant are depicted as points color coded for each epoch. The standard error for TE and TI of participants in each epoch is depicted as a colored cross at the mean TE and mean TI for each epoch. The dashed line indicates a line of slope one emerging from the origin. *Significant difference from baseline (P < 0.05).
Fig. 3.
Fig. 3.
The epoch mean, the modulation amplitude, and the modulation phase characterize the respiratory modulation of the RR interval (RRI), the mean arterial pressure (MAP), and the pulse pressure (PP) by experimental epoch in human participants. These quantities are determined by the three coefficients of the cosine tuning curve (see methods). Data are depicted as box-and-whisker plots with both mean (solid black horizontal line) and median (dashed black horizontal line). *Significant difference from baseline (P < 0.05).
Fig. 4.
Fig. 4.
Exemplar scatter plots depicting model-dependent respiratory modulation of the RR interval (RRI), mean arterial pressure (MAP), and pulse pressure (PP) for a single human participant as well as the respiratory modulation of MAP in two computational models of blood pressure. In all panels, the mean metric value for that epoch is represented by 0 on the vertical axis. The dashed red curves represent the cosine tuning curve fit to the data set depicted in each panel. Note that the difference between the modulatory phase of human MAP and Model 1 MAP is strikingly apparent during the slow deep breathing (SDB) epoch.
Fig. 5.
Fig. 5.
The amplitude of modulation of mean arterial pressure (MAP) as a percent of the pulse pressure (PP) (upper row) and the respiratory phase of MAP modulation (lower row) is used to evaluate model performance against human participant data. Data are depicted as box-and-whisker plots with both mean (solid black horizontal line) and median (dashed black horizontal line). *Significant difference compared with the corresponding epoch in the human data (P < 0.025).
Fig. 6.
Fig. 6.
Modulation amplitude and modulation phase of MAP in Model #2 without respiratory modulation of the RR interval (Model #2 ØRRI) and without respiratory modulation of arterial pulse pressure (Model #2 ØPP). Data are depicted as box-and-whisker plots with both mean (solid black horizontal line) and median (dashed black horizontal line). *Significant difference compared with the corresponding epoch in the Model #2 (P < 0.025).

Similar articles

Cited by

References

    1. Baker SE, Limberg JK, Ranadive SM, Joyner MJ. Neurovascular control of blood pressure is influenced by aging, sex, and sex hormones. Am J Physiol Regul Integr Comp Physiol 311: R1271–R1275, 2016. doi:10.1152/ajpregu.00288.2016. - DOI - PMC - PubMed
    1. Ben-Tal A, Shamailov SS, Paton JF. Central regulation of heart rate and the appearance of respiratory sinus arrhythmia: new insights from mathematical modeling. Math Biosci 255: 71–82, 2014. doi:10.1016/j.mbs.2014.06.015. - DOI - PMC - PubMed
    1. Ben-Tal A, Shamailov SS, Paton JF. Evaluating the physiological significance of respiratory sinus arrhythmia: looking beyond ventilation-perfusion efficiency. J Physiol 590: 1989–2008, 2012. doi:10.1113/jphysiol.2011.222422. - DOI - PMC - PubMed
    1. Chadachan VM, Ye MT, Tay JC, Subramaniam K, Setia S. Understanding short-term blood-pressure-variability phenotypes: from concept to clinical practice. Int J Gen Med 11: 241–254, 2018. doi:10.2147/IJGM.S164903. - DOI - PMC - PubMed
    1. Chenniappan M. Blood pressure variability: assessment, prognostic significance and management. J Assoc Physicians India 63: 47–53, 2015. - PubMed

Publication types

LinkOut - more resources