. 2020 Sep 17:9:e54348.
doi: 10.7554/eLife.54348.

Topological constraints in early multicellularity favor reproductive division of labor

Affiliations

Topological constraints in early multicellularity favor reproductive division of labor

David Yanni et al. Elife. .

Abstract

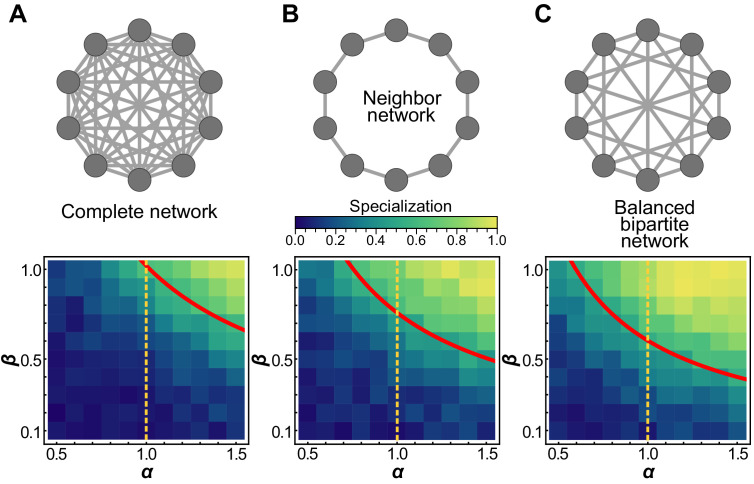
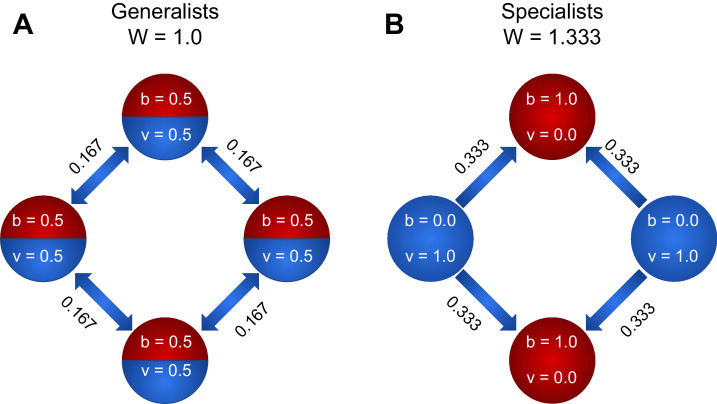
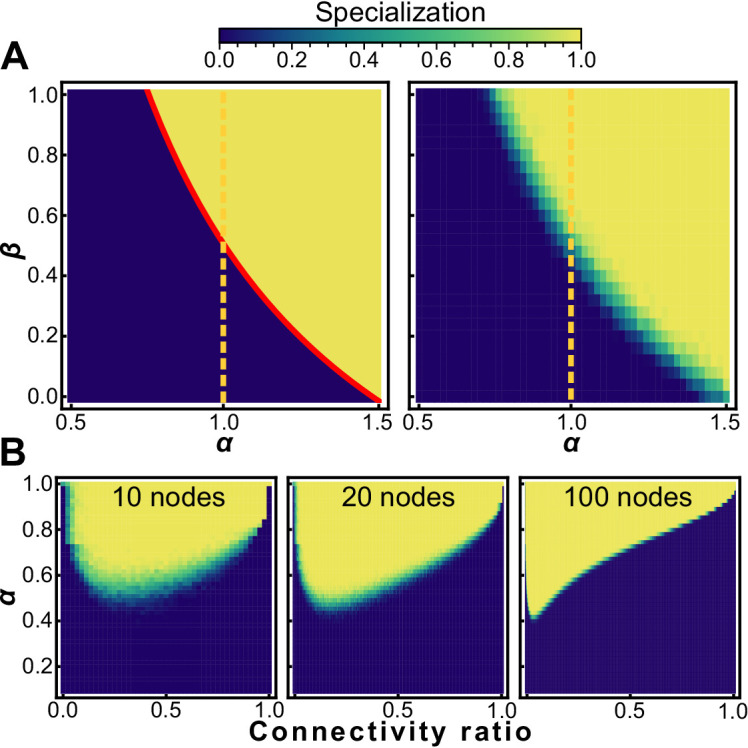
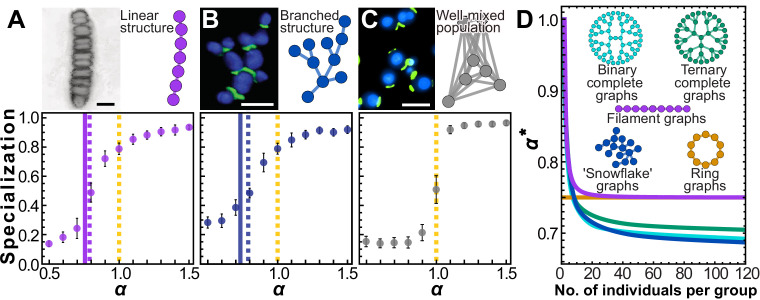
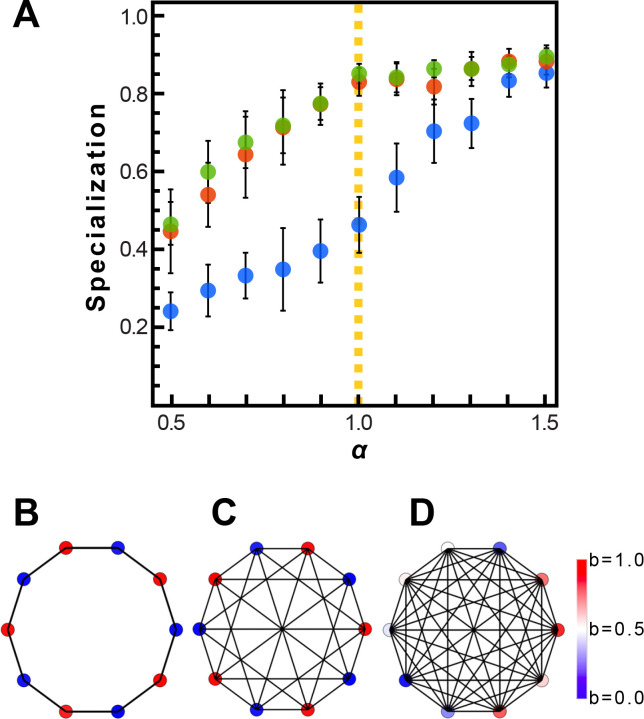
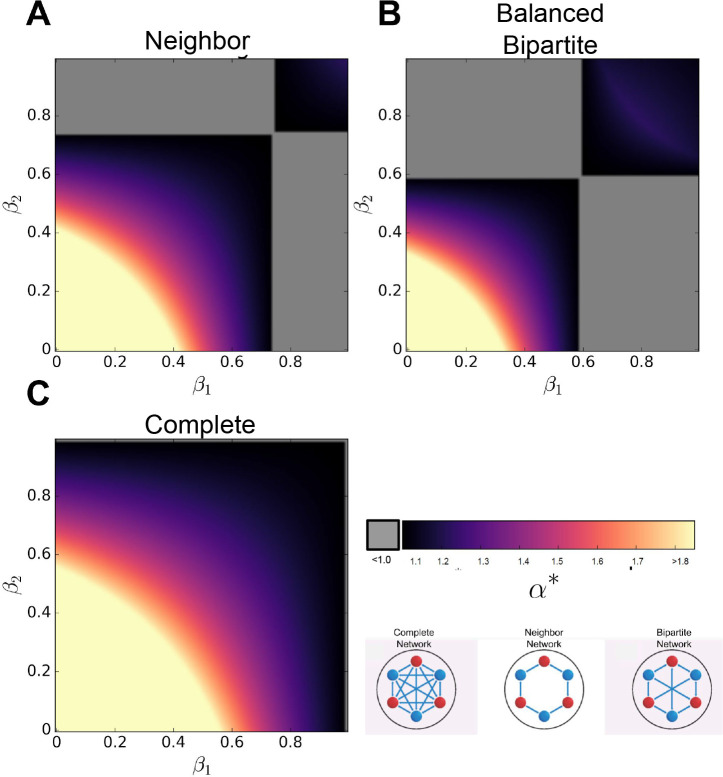
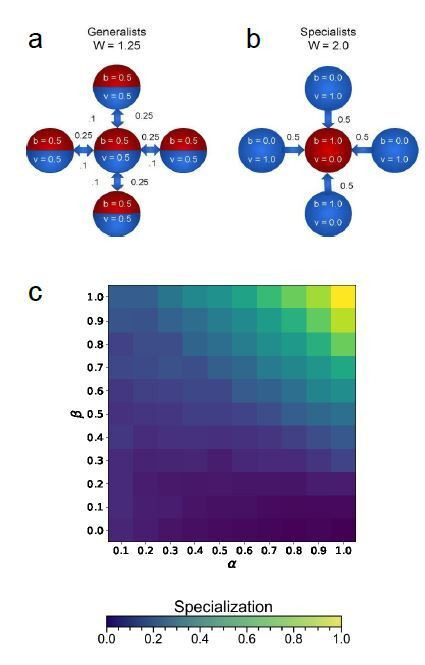
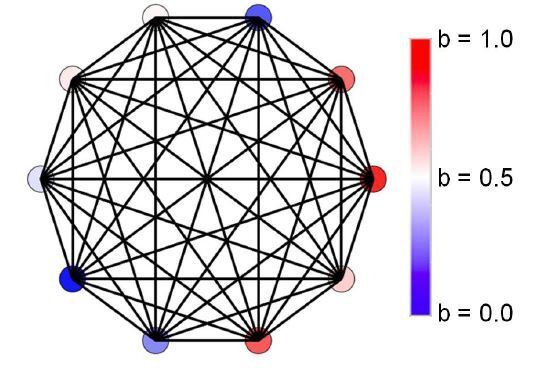
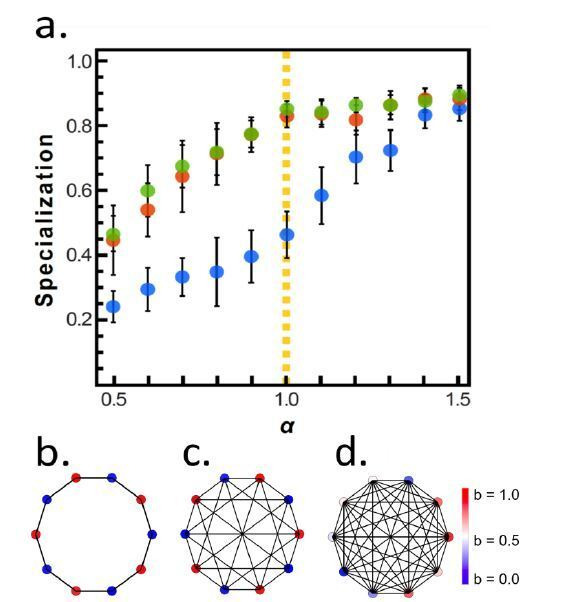
Reproductive division of labor (e.g. germ-soma specialization) is a hallmark of the evolution of multicellularity, signifying the emergence of a new type of individual and facilitating the evolution of increased organismal complexity. A large body of work from evolutionary biology, economics, and ecology has shown that specialization is beneficial when further division of labor produces an accelerating increase in absolute productivity (i.e. productivity is a convex function of specialization). Here we show that reproductive specialization is qualitatively different from classical models of resource sharing, and can evolve even when the benefits of specialization are saturating (i.e. productivity is a concave function of specialization). Through analytical theory and evolutionary individual-based simulations, we demonstrate that reproductive specialization is strongly favored in sparse networks of cellular interactions that reflect the morphology of early, simple multicellular organisms, highlighting the importance of restricted social interactions in the evolution of reproductive specialization.

Keywords: evolution; evolutionary biology; none; reproductive specialization; topology.


Conflict of interest statement

DY, SJ, PM, JW, WR, PY No competing interests declared

Figures

Figure 1.
Figure 1.. Schematic of topology for a simplified ten cell group (first row), and mean specialization as a function of specialization power α and interaction strength β across the entire population.
(A) When each cell in the group is connected to all others, specialization is favored only when α>1. (B) For the nearest neighbor topology, specialization is favorable for a wider range of parameters, including for some values of α<1. Specifically, specialization is advantageous when α>34β. (C) Connecting alternating specialists creates a bipartite graph which maximizes the benefits of specialization and the range of parameters for which it is advantageous. In this case, specialization is favorable wherever α>35β. The red curves represent analytical predictions for α*, the lowest value of α for which complete generalization is disfavored, and the orange vertical lines are at α=1 to guide the eye. While analysis shows that some degree of specialization must occur in the regime upward and to the right of the red curves, simulations reveal that when complete generalization is disfavored complete specialization is favored in these networks.
Figure 2.
Figure 2.. To explore how specialization can be favored by the nearest-neighbor topology, we compare the fitness of a four member system when cells are (A) generalists and (B) specialists.
We first consider the case of linear functional returns (α=1). For the case of generalists (A), each cell receives as much viability as it shares, and all nodes contribute equally to the fitness of the group. Therefore, the fitness of the group is W=41212=1. For the case of specialists, however, the viability specialist cells (blue) have v~b~=0, while the fecundity specialist cells have nonzero v~b~ due to the fact that they receive 13 of each viability specialist’s output. Thus the fitness of the group is W=2(213)=43. Thus, fitness is higher for the group of specialists, so specialization is favored. For α=0.9, the fitness of generalists is 1.15, and the fitness of specialists is 1.33. Thus, even though the returns on investment are saturating (i.e. concave), specialization is favored.
Figure 3.
Figure 3.. Sparsity encourages specialization.
Heat maps showing conditions that favor specialists (white) and generalists (black) for nearest neighbor topologies (A, left) and randomly generated graphs with the same connectivity as nearest neighbor topologies (A, right). Specialization is adaptive on a neighbor network for α>34β; random networks with the same mean connectivity as the nearest neighbor topology behave similarly. (B) The sparsity of a random graph affects how likely it is to favor specialization. We numerically maximize fitness for random graphs of size N=10 (left), N=20 (middle), and N=100 (right) at different levels of sparsity, and subsequently measure the specialization 𝒮 of the fitness maximizing investment strategy. The horizontal axis is the fraction of possible connections present ranging from 0 (none) to 1 (all). The vertical axis is the specialization power α, and the colormap shows mean specialization.
Figure 4.
Figure 4.. Simple multicellular organisms with sparse topologies.
We show two examples of simple multicellular organisms with linear and branched topologies. The image in (A) is a fossilized rhodophyte specimen of Bangiomorpha pubescens, courtesy of Prof. Nicholas Butterfield (see e.g. Butterfield, 2000); the image in (B) is a confocal image of ‘snowflake yeast’ showing cell volumes in blue and cell-cell connections in green; the image in (C) is an epifluorescence image of individual yeast cells from a planktonic culture, with the same staining technique as in (B). Scale bars in pictures = 10 µm. Panels include cartoons depicting simplified topologies. Topologically similar to the two-neighbor configuration, these configurations yield similar simulation results. Specialization is plotted as a function of α. Solid (A) and blue (B) vertical lines (A and B) indicate analytical solutions for the transition point where the Hessian evaluated at v=121 stops being negative definite, that is, α*; dotted lines indicate roughly where the simulation curves cross specialization of 0.5, that is, the 'true' transition value of α where specialization becomes favored. (C) In contrast, for a well-mixed group with fully connected topology, α=0.5, indicating specialization only occurs when there are accelerating returns on investment. (D) To further explore trees and filaments we analytically solved for α* for various types of trees and filaments of different sizes. α* is plotted versus group size for several topologies. This is a proxy measure of how amenable a network structure is to specialization.
Appendix 1—figure 1.
Appendix 1—figure 1.. Evolution of resource sharing.
(A) Initially, individuals do not share resources; however, they may evolve to do so via random mutations. Here, the mean specialization of the fittest of 100 groups each with 10 cells after 100,000 steps is plotted as a function of specialization power. Error bars are standard deviations across 10 replicates. Blue is the fully connected network, red is the neighbor network, and green is the balanced bipartite topology. (B-D) The final distribution of specialization values for individual cells in fully connected (B), nearest-neighbor (C), and balanced bipartite topologies (D). The color of cells in B-D represents their degree of specialization, as indicated in the scale bar.
Appendix 1—figure 2.
Appendix 1—figure 2.. Effect of sharing two resources.
When two resources are shared to different degrees, specified by (β1,β2), specialization is sometimes favored under conditions of sublinear returns on investment α*<1.0. Interestingly, specialization is favored when one resource is shared liberally while the other resource is shared sparingly (though it is not necessary to have one resource remain totally unshared).
Appendix 1—figure 3.
Appendix 1—figure 3.. Rings with odd numbers of cells are frustrated.
α* plotted versus the number of cells in the ring, for rings with even and odd numbers of cells.
Author response image 1.
Author response image 2.
Author response image 2.. Cartoon image generalists (a) and specialists (b) in a five cell star graph topology.
Wright-Fisher simulations of five cell star topologies for a range of 𝛼 and 𝛽 values.
Author response image 3.
Author response image 4.
Author response image 5.
Author response image 6.
Author response image 7.
Author response image 7.. Evolution of resource sharing.
(a) Initially, individuals do not share resources; however, they may evolve to do so via random mutations. Here, the mean specialization of the fittest of 100 groups each with 10 cells after 100,000 steps is plotted as a function of specialization power. Error bars are standard deviations across 10 replicates. Blue is the fully connected network, red is the neighbor network, and green is the balanced bipartite topology. (b-d) The final distribution of specialization values for individual cells in fully connected (b), nearest-neighbor (c), and balanced bipartite topologies (d). The color of cells in b-d represents their degree of specialization, as indicated in the scale bar.

Comment in

References

    1. Allen B, Lippner G, Chen YT, Fotouhi B, Momeni N, Yau ST, Nowak MA. Evolutionary dynamics on any population structure. Nature. 2017;544:227–230. doi: 10.1038/nature21723. - DOI - PubMed
    1. Amado A, Batista C, Campos PRA. A theoretical approach to the size-complexity rule. Evolution. 2018;72:18–29. doi: 10.1111/evo.13392. - DOI - PubMed
    1. Bengtson S, Rasmussen B, Ivarsson M, Muhling J, Broman C, Marone F, Stampanoni M, Bekker A. Fungus-like mycelial fossils in 2.4-billion-year-old vesicular basalt. Nature Ecology & Evolution. 2017a;1:141. doi: 10.1038/s41559-017-0141. - DOI - PubMed
    1. Bengtson S, Sallstedt T, Belivanova V, Whitehouse M. Three-dimensional preservation of cellular and subcellular structures suggests 1.6 billion-year-old crown-group red algae. PLOS Biology. 2017b;15:e2000735. doi: 10.1371/journal.pbio.2000735. - DOI - PMC - PubMed
    1. Berman-Frank I, Quigg A, Finkel ZV, Irwin AJ, Haramaty L. Nitrogen-fixation strategies and fe requirements in cyanobacteria. Limnology and Oceanography. 2007;52:2260–2269. doi: 10.4319/lo.2007.52.5.2260. - DOI

Publication types