. 2020 Sep 17:9:e61056.
doi: 10.7554/eLife.61056.

Antibody escape by polyomavirus capsid mutation facilitates neurovirulence

Affiliations

Antibody escape by polyomavirus capsid mutation facilitates neurovirulence

Matthew D Lauver et al. Elife. .

Abstract

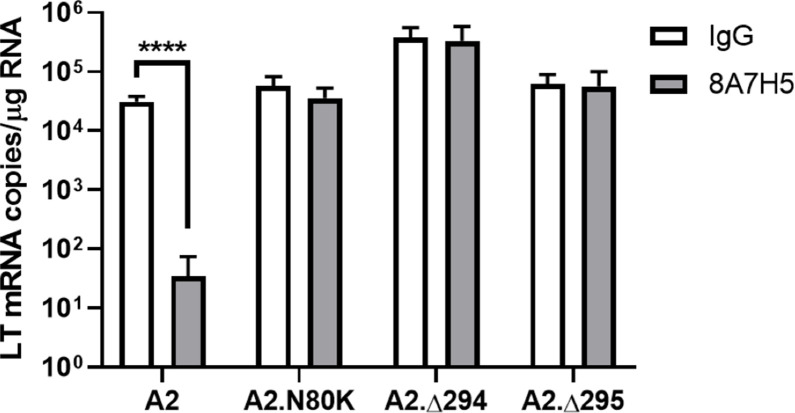
JCPyV polyomavirus, a member of the human virome, causes progressive multifocal leukoencephalopathy (PML), an oft-fatal demyelinating brain disease in individuals receiving immunomodulatory therapies. Mutations in the major viral capsid protein, VP1, are common in JCPyV from PML patients (JCPyV-PML) but whether they confer neurovirulence or escape from virus-neutralizing antibody (nAb) in vivo is unknown. A mouse polyomavirus (MuPyV) with a sequence-equivalent JCPyV-PML VP1 mutation replicated poorly in the kidney, a major reservoir for JCPyV persistence, but retained the CNS infectivity, cell tropism, and neuropathology of the parental virus. This mutation rendered MuPyV resistant to a monoclonal Ab (mAb), whose specificity overlapped the endogenous anti-VP1 response. Using cryo-EM and a custom sub-particle refinement approach, we resolved an MuPyV:Fab complex map to 3.2 Å resolution. The structure revealed the mechanism of mAb evasion. Our findings demonstrate convergence between nAb evasion and CNS neurovirulence in vivo by a frequent JCPyV-PML VP1 mutation.

Keywords: Cryo EM; fab:capsid complex; immunology; inflammation; mouse; neutralizing antibody; polyomavirus; progressive multifocal leukoencephalopathy; subvolume refinement.


Conflict of interest statement

ML, DG, CN, KA, GJ, DH, EF, SC, CB, SB, NC, SH, AL No competing interests declared

Figures

Figure 1.
Figure 1.. The V296F VP1 mutation in MuPyV impairs kidney, but not brain, infection.
(A) Structural comparison of JCPyV.S268 (PDB 3NXG) and MuPyV.V296 (PDB 5CPU) VP1 residues (Buch et al., 2015; Neu et al., 2010). (B) A2 and A2.V296F LT mRNA levels 4 dpi in the kidneys of mice infected s.c. Data are from three independent experiments, n = 17 mice (p<0.0001). (C) Left: 40x images of kidneys from CD8 T cell-depleted, Stat1–/– mice 7 dpi stained for VP1. Inset is a 400x image of the region outlined in black. Right: Quantification of VP1+ foci per sagittal kidney section. Data are the average of two sagittal kidney sections per mouse from three independent experiments, n = 6–11. For Sham vs. A2 p<0.0001, Sham vs. A2.V296F p=0.5801, A2 vs. A2.V296F p<0.0001. (D) A2 and A2.V296F LT mRNA levels four dpi in the brains of mice infected i.c. Data are from three independent experiments, n = 12–13 mice (p=0.1366). (E) 400x images of brains 4 dpi with A2 or A2.V296F i.c. VP1+ cells are indicated with white arrows. Representative of three independent experiments. (F and G) Ratio of A2.V296F to A2 in various organs of mice 14 dpi with a 1:1 PFU inoculum of A2:A2.V296F s.c. (F) or i.c. (G). The dotted line indicates the ratio of A2:A2.V296F DNA in the inoculum. Data are from 2 to 3 independent experiments, n = 16–26 mice. For (F) Brain vs. Kidney p<0.0001, Brain vs. Bone Marrow p<0.0001, Kidney vs. Bone Marrow p=0.9443; for (G) p<0.0001. Data were analyzed by Mann–Whitney U test (B, D, G) or one-way ANOVA (F). ****p<0.0001.
Figure 1—figure supplement 1.
Figure 1—figure supplement 1.. The A2.V296F VP1 mutant virus retains infectivity in vitro.
(A) Single-cycle replication assay in A31 fibroblasts. Cells were infected with an multiplicity of infection (MOI) of 0.1 and virus was collected 60 hpi and measured by plaque assay. Data are from two independent experiments, n = 15 (p=0.0013).(B) LT mRNA levels in cell lines and primary MEFs 24 hpi with an MOI of 2. Data are from two independent experiments, n = 6. For NMuMG p=0.8088, A31 p=0.5975, mIMCD-3 p=0.8088, MEF p=0.9081. Data analyzed by Mann–Whitney U test (A) or multiple t tests (B). **p<0.01.
Figure 1—figure supplement 2.
Figure 1—figure supplement 2.. Discrimination of A2 and A2.V296F DNA by PCR.
PCR products after amplification of A2 or A2.V296F DNA with a combination of PCR primers for LT or the V296F-VP1 mutation.
Figure 2.
Figure 2.. Persistent infection with either A2 or A2.V296F results in CNS pathology.
(A) Left: LFB-PAS-stained brain sections 30 dpi with A2 or A2.V296F. Right: Hydrocephalus was quantified as the size of the lateral ventricle compared to total brain size. Data are from three independent experiments, n = 10–14 mice. For Sham vs A2 p=0.0022, Sham vs A2.V296F p=0.0010, and A2 vs. A2.V296F p=0.9806. (B) Representative 40x H & E images of the ependyma and choroid plexus of the lateral ventricle in mice 30 dpi. Inset image is 200x. (C) 400x fluorescence images of GFAP and vimentin expression in the lining of the lateral ventricles in mice 30 dpi. (D) Quantification of the thickness of the vimentin+ region shown in (C). Data are from three independent experiments, n = 13–15 mice. For Sham vs. A2 p<0.0001, Sham vs. A2.V296F p<0.0001, and A2 vs. A2.V296F p=0.4626. (E) 400x fluorescence images of Iba1+ and CD3+ cells in the lateral ventricles 30 dpi. Data were analyzed by one-way ANOVA (A, D). **p<0.01, ***p<0.001, ****p<0.0001.
Figure 3.
Figure 3.. The V296F VP1 mutation confers resistance to a neutralizing mAb.
(A) LT mRNA levels in NMuMG cells 24 hr pi with A2 or V296 mutant viruses preincubated with 8A7H5 or control IgG. Data are from two independent experiments, n = 12. For A2 p<0.0001, A2.V296F p=0.9626, A2.V296A p<0.0001, A2.V296I p=0.0076, A2.296Y p=0.5580, and A2.V296W p=0.9626. (B) Left: LT mRNA levels in A31 fibroblasts 96 hpi with A2 or A2.V296F at 0.01 MOI, 8A7H5 or control IgG was added to the media 24 hpi. Data are from two independent experiments, n = 6. For A2 p<0.0001 and A2.V296F p=0.3947. Right: Protection from virus-induced cell death. A31 fibroblasts were treated as in left panel, fixed with formaldehyde and stained with crystal violet 7 dpi. (C) Experimental design for in vivo neutralization experiments. (D) LT mRNA levels in the spleens of mice injected with 8A7H5 or control IgG followed by infection with A2 or A2.V296F. Data are from two independent experiments, n = 6 mice. For A2 p<0.0001 and A2.V296F p=0.7812. (E) Splenic T cell responses 8 dpi in mice treated and infected as in (D). Data are from two independent experiments, n = 6 mice. Middle: A2 p<0.0001, A2.V296F p=0.6758; Right: A2 p<0.0001, A2.V296F p=0.1679. (F) Competition for binding to VP1 pentamers between immune sera and 8A7H5 IgG. Sera from mice 30 dpi with A2 were diluted to 2 μg/mL of VP1-specific IgG and combined with increasing concentrations of 8A7H5 or control IgG. The serum/8A7H5 was then incubated with VP1 pentamers, and a mouse IgG-specific secondary antibody was used to measure the amount of serum bound to VP1 pentamers by ELISA. Each sample was normalized to binding in the absence of exogenous IgG. Data are from three independent experiments, n = 12 mice. Data were analyzed by multiple t tests (A, B, D, E). **p<0.01, ****p<0.0001.
Figure 4.
Figure 4.. Cryo-EM image sub-particle refinement reconstructions showing architecture of MuPyV-Fab complexes.
(A) Micrographs of virus and virus–Fab complex (shown left and right, throughout figure) illustrate particle diameter difference due to bound Fab. (B) Surface rendered icosahedrally averaged maps. (C) Central sections demonstrate the quality of the maps and show the Fab and capsid densities are of comparable magnitude. (D and E) Sub-particle refinement of pentavalent and hexavalent capsomers with sections through the maps (upper) and top-down views (lower) show the overall architecture. Pentavalent capsomers (D, VP1 density in shades of red) have fivefold symmetry (pentagon), whereas hexavalent capsomers have pseudo-symmetry (E, VP1 in OYGBV) most apparent in the contribution of VP1 C-terminal extensions to neighboring capsomers. Epitopes for the Fab molecules (light chain: purple; heavy chain: cyan) bridge adjacent VP1 molecules. (F) Local refinement of capsomer sub-particles resulted in interpretable sidechain density at the MuPyV-Fab interface (colors as in D and E).
Figure 4—figure supplement 1.
Figure 4—figure supplement 1.. 8A7H5 Fab neutralizes A2 but not A2.V296F.
(A) LT mRNA levels in NMuMG cells 24 hpi with A2 or A2.V296F preincubated with 8A7H5 Fab or control Fab. Data are from two independent experiments, n = 6. For A2 p<0.0001, A2.V296F p<0.0001. (B) A31 fibroblasts were infected with A2 or A2.V296F at 0.01 MOI, with 8A7H5 or control Fab added 24 hpi. Cells were fixed with formaldehyde and stained with crystal violet 7 dpi. Data analyzed by multiple t tests (A). ****p<0.0001.
Figure 4—figure supplement 2.
Figure 4—figure supplement 2.. Fourier Shell Correlation (FSC).
Gold standard FSC curves were generated in cryoSPARC from half-maps, displayed as central sections with scale bars for the MuPyV-Fab complex (A, top), pentavalent capsomer complex (A, middle), and hexavalent capsomer complex (A, bottom). FSC curves were also generated for the MuPyV particle (B, top), pentavalent capsomer (B, middle) and hexavalent capsomer (B, bottom). For the sub-particle maps, FSCs were calculated after applying a soft tight mask to isolate the central capsomer-Fab complex or capsomer.
Figure 4—figure supplement 3.
Figure 4—figure supplement 3.. Asymmetric Unit.
(A) The surface rendered MuPyV capsid map overlaid with an asymmetric unit (ROYGBV) consisting of one VP1 chain from the pentavalent capsomer (red), together with five VP1 chains from a neighboring hexavalent capsomer (gray). (B) The MuPyV-Fab complex map with Fab and VP1 colored as in (A). Each asymmetric unit contains six nearly identical copies of the Fab epitope.
Figure 4—figure supplement 4.
Figure 4—figure supplement 4.. Refinement workflow.
(A) Icosahedral refinement produces a moderate resolution map of the full capsid and allows for designation of x,y,z coordinates of pentavalent (red) and hexavalent capsomers (blue). (B) Coordinates and orientations for all pentavalent and hexavalent capsomers are calculated, which enables sub-particle extraction and local refinement of capsomer centers and orientations, significantly improving map resolution compared to the initial icosahedral reconstruction.
Figure 4—figure supplement 5.
Figure 4—figure supplement 5.. Local resolution.
(A and B) Equivalent zoomed views with density colored according to local resolution at the interface for the pentavalent (A) and hexavalent (B) capsomers show resolution improved after subvolume refinement (right) compared to the initial icosahedral refinement (left).
Figure 5.
Figure 5.. Cryo-EM reconstruction of MuPyV identifies mechanism of VP1 antibody escape by the V296F mutation.
(A and B) The Fab epitope bridges adjacent copies of VP1 on the pentavalent capsomer (A, shades of red) and hexavalent capsomer (B, OYGBV). Neighboring epitopes abut directly against each other. Contact residues from the main VP1 chain are noted in black, with minor contributions from the adjacent VP1 in gray. (C) A salt-bridge is formed between R77 and Fab heavy chain residue D99. This interaction is near key residue V296, despite the large distance in linear sequence. (D) The Fab epitope and receptor-binding residues (sky blue) overlap (PDB ID 5CPY) (Buch et al., 2015). (E) Increasing concentrations of 8A7H5 prevent the attachment of A2, but not A2.V296F. H2B-GFP labeled virus was incubated with antibody prior to incubation with NMuMG cells. GFP fluorescence was measured by flow cytometry. Data are from two independent experiments, n = 6. (F) The V296F mutation would place a bulky residue at the MuPyV-Fab interface, disrupting the Fab heavy chain residue T98, D99, and H100 (cyan) interactions. (G) V296F prevents the binding of 8A7H5 to VP1. NMuMG cells were incubated with A2 or A2.V296F followed by incubation with 8A7H5. Bound 8A7H5 was detected with an anti-IgG secondary. Data are from two independent experiments, n = 6 For 8A7H5 p<0.0001, IgG p=0.9693. (H) Six quasi-equivalent Fab molecules (red, orange, yellow, blue, green, purple) are contained within the asymmetric unit without clashes, despite the close proximity of Fab constant domains (inset). Data were analyzed by multiple t tests (G). ****p<0.0001.
Figure 5—figure supplement 1.
Figure 5—figure supplement 1.. Heavy and light chain interactions with the capsid surface.
(A) The heavy chain (cyan) interacts with one copy of VP1 (yellow residues) with the light chain (purple) making additional contacts with the neighboring VP1 (orange residues). Symmetry-related VP1 molecules are shown in shades of red, divided by a thick black line. (B) Variable domains of adjacent bound Fab do not clash (heavy: cyan; light: purple). VP1 chains are colored as in Figure 4D,E.
Figure 5—figure supplement 2.
Figure 5—figure supplement 2.. 8A7H5 Fab blocks A2 attachment and fails to bind A2.V296F.
(A) Increasing concentrations of 8A7H5 Fab prevent the attachment of A2, but not A2.V296F, to NMuMG cells. Data from two independent experiments, n = 5–6. (B) Binding of 8A7H5 Fab to VP1 is prevented by V296F. NMuMG cells were incubated with A2 or A2.V296F followed by incubation with 8A7H5 Fab. Bound 8A7H5 was detected with an anti-IgG secondary. Data are from two independent experiments, n = 6 (p=0.0022). Data analyzed by Mann–Whitney U test (B). **p<0.01.
Figure 6.
Figure 6.. Additional JCPyV-PML mutations in MuPyV impair kidney, but not brain infection, and have varying effects on VP1 mAb neutralization.
(A) Structural comparison of PML mutation sites in JCPyV VP1 (PDB 3NXG) with MuPyV VP1 (PDB 5CPU) residues (Buch et al., 2015; Neu et al., 2010). (B) Kidney LT mRNA levels in mice 4 dpi with A2 or mutant viruses s.c. Data are from two independent experiments, n = 9–10 mice. For A2 vs. A2.V296F p=0.0008, A2 vs. A2.V296Y p=0.0100, A2 vs. A2.N293F p=0.0014, and A2 vs .A2.N293Y p=0.0168. (C) Brain LT mRNA levels in mice 4 dpi with A2 or mutant viruses i.c. Data are from four independent experiments, n = 13–14 mice. For A2 vs. A2.V296F p>0.9999, A2 vs. A2.V296Y p=0.2576, A2 vs. A2.N293F p=0.9974, and A2 vs. A2.N293Y p=0.9928. (D) LT mRNA levels in NMuMG cells 24 hpi with A2.N293F or A2.N293Y preincubated with 8A7H5 or control IgG. Data are from two independent experiments, n = 12. For A2.N293F p<0.0001 and A2.N293Y p<0.0001. (E) Analysis of 8A7H5 avidity for mutant VP1’s using NH4SCN. Left: Relative binding of 8A7H5 to recombinant VP1 with increasing concentrations of NH4SCN. Right: Relative binding of 8A7H5 to recombinant VP1 at 2M NH4SCN. Each point is the average of two technical replicates in an independent repeat, n = 3. For WT vs. V296F p<0.0001, WT vs. N293Y p=0.6440, WT vs. T291D p=0.0003, WT vs. H139R p<0.0001, and WT vs. R77N p<0.0001. (F) Location of novel changes in the VP1 escape mutations indicated by underlines. (G) LT mRNA levels 4 dpi in the kidneys of mice infected s.c. Data are from two independent experiments, n = 8 mice. For A2 vs. A2.N80K p=0.3374, A2 vs. A2.∆294 p=0.0010, A2 vs. A2.∆295 p=0.3724, A2.N80K vs. A2.∆294 p<0.0001, A2.N80K vs. A2.∆295 p=0.9999, and A2.∆294 vs. A2.∆295 p<0.0001. (H) LT mRNA levels 4 dpi in the brains of mice infected i.c. Data are from 2 to 4 independent experiments, n = 8–16 mice. For A2 vs. A2.N80K p<0.0001, A2 vs. A2.∆294 p<0.0001, A2 vs. A2.∆295 p<0.0001, A2.N80K vs. A2.∆294 p=0.8811, A2.N80K vs. A2.∆295 p=0.9979, and A2.∆294 vs. A2.∆295 p=0.6869. (I) Viral shedding in the urine is impaired by V296F, despite antibody escape in the blood. Top: Experimental design for infection of μMT mice and 8A7H5 treatment. Bottom: Frequency of A2.V296F DNA in blood, urine, and brain tissue of mice. Data are from three independent experiments, n = 13–14 mice. For Blood vs. Urine p<0.0001, Blood vs. Brain p=0.0500, and Urine vs. Brain p=0.0028. Data were analyzed by one-way ANOVA (B, C, E Right, G, H, I) or multiple t tests (D). In E, comparisons were only between WT and each mutant. **p<0.01, ***p<0.001, ****p<0.0001.
Figure 6—figure supplement 1.
Figure 6—figure supplement 1.. Relation of other VP1 mutations to virus–Fab interface.
(A) Cryo-EM density at the interface between the pentavalent capsomer (red) and Fab (cyan, purple). Location of the residues mutated to mimic those found in JCPyV-PML (H139, T291, N293, V296, R77) are noted in black. Residues T291, N293, V296 and R77 are located at the interface whereas H139 is a buried residue. (B) An alternate view of the interface shows the interaction between the HI loop and the Fab heavy chain CDR loop H3.
Figure 6—figure supplement 2.
Figure 6—figure supplement 2.. Resistance of escape mutations to 8A7H5 neutralization.
LT mRNA levels in NMuMG cells 24 hpi with A2, A2.N80K, A2.∆294, A2.∆295 preincubated with 8A7H5 or control IgG. Data are from two independent experiments, n = 6 (A2 p<0.0001, A2.N80K p=0.2374, A2.∆294 p=0.9403, A2.∆295 p=0.9403). Data were analyzed by multiple t tests. ****p<0.0001.

Similar articles

Cited by

References

    1. Abrishami V, Ilca SL, Gomez-Blanco J, Rissanen I, de la Rosa-Trevín JM, Reddy VS, Carazo JM, Huiskonen JT. Localized reconstruction in Scipion expedites the analysis of symmetry mismatches in cryo-EM data. Progress in Biophysics and Molecular Biology. 2020;S0079-6107:30039-0. doi: 10.1016/j.pbiomolbio.2020.05.00430039-0. - DOI - PubMed
    1. Agnihotri SP, Wuthrich C, Dang X, Nauen D, Karimi R, Viscidi R, Bord E, Batson S, Troncoso J, Koralnik IJ. A fatal case of JC virus meningitis presenting with hydrocephalus in a human immunodeficiency virus-seronegative patient. Annals of Neurology. 2014;76:140–147. doi: 10.1002/ana.24192. - DOI - PMC - PubMed
    1. Asarnow D, Palovcak E, Cheng Y. asarnow/pyem: UCSF pyem. 0.5Zenodo. 2019 doi: 10.5281/zenodo.3576630. - DOI
    1. Astrom KE, Mancall EL, Richardson EP. Progressive multifocal leuko-encephalopathy; a hitherto unrecognized complication of chronic lymphatic leukaemia and Hodgkin’s disease. Brain J. Neurol. 1958;81:93–111. doi: 10.1093/brain/81.1.93. - DOI - PubMed
    1. Bauer PH, Cui C, Liu WR, Stehle T, Harrison SC, DeCaprio JA, Benjamin TL. Discrimination between sialic acid-containing receptors and pseudoreceptors regulates polyomavirus spread in the mouse. Journal of Virology. 1999;73:5826–5832. doi: 10.1128/JVI.73.7.5826-5832.1999. - DOI - PMC - PubMed

Publication types

Substances