

E-cigarette Unit Sales, by Product and Flavor Type - United States, 2014-2020
- PMID: 32941416
- PMCID: PMC7498168
- DOI: 10.15585/mmwr.mm6937e2
E-cigarette Unit Sales, by Product and Flavor Type - United States, 2014-2020
Abstract
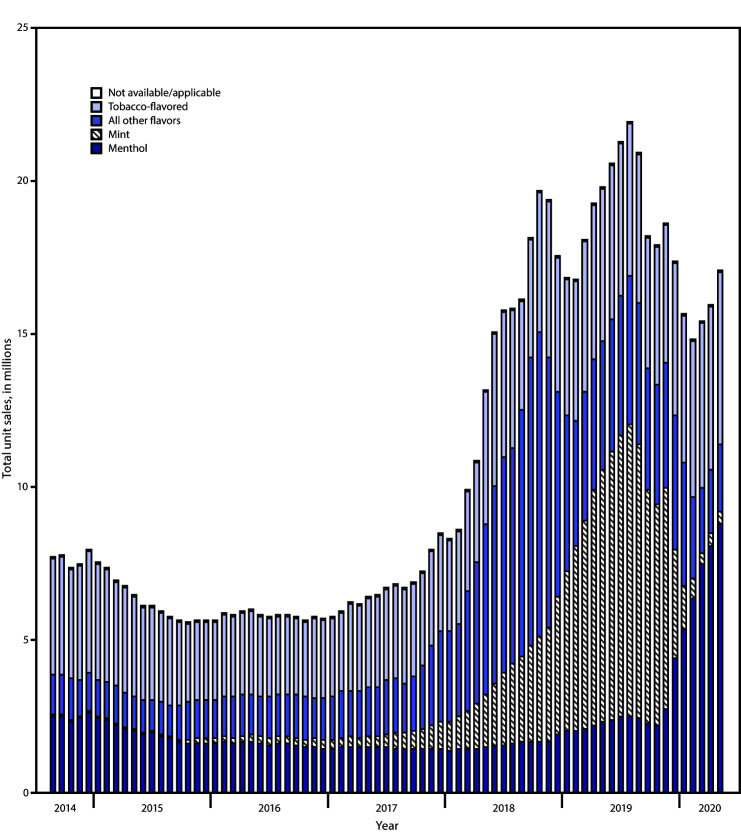
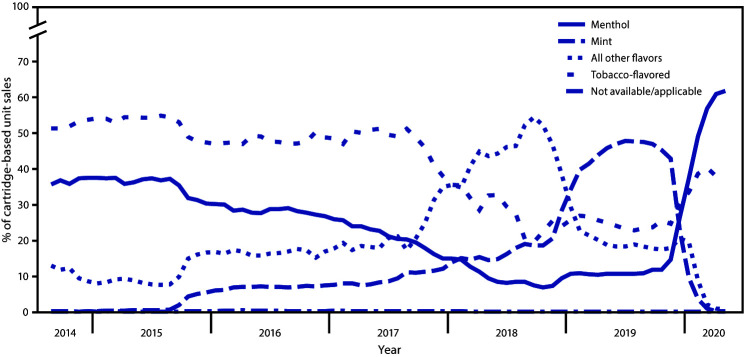
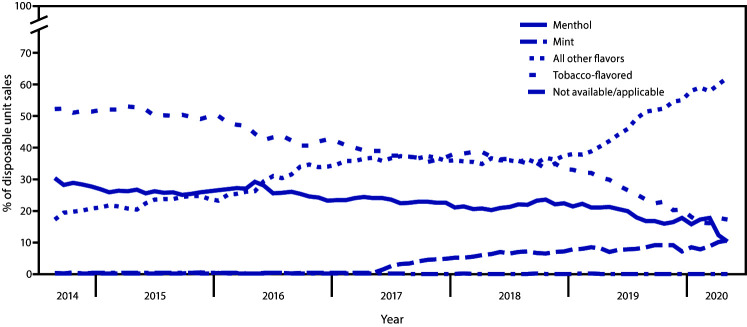
Since electronic cigarettes (e-cigarettes) entered the U.S. marketplace in 2007, the landscape has evolved to include different product types (e.g., prefilled cartridge-based and disposable products) and flavored e-liquids (e.g., fruit, candy, mint, menthol, and tobacco flavors), which have contributed to increases in youth use (1,2). E-cigarettes have been the most commonly used tobacco product among U.S. youths since 2014; in 2019, 27.5% of high school students reported current e-cigarette use (3). To assess trends in unit sales of e-cigarettes in the United States by product and flavor type, CDC, CDC Foundation, and Truth Initiative analyzed retail scanner data during September 14, 2014-May 17, 2020, from Information Resources, Inc. (IRI). During this period, total e-cigarette sales increased by 122.2%, from 7.7 million to 17.1 million units per 4-week interval. By product type, the proportion of total sales that was prefilled cartridge products increased during September 2014-August 2019 (47.5% to 89.4%). During August 2019-May 2020, the proportion of total sales that was disposable products increased from 10.3% to 19.8%, while the proportion that was prefilled cartridge products decreased (89.4% to 80.2%). Among prefilled cartridge sales, the proportion of mint sales increased during September 2014-August 2019 (<0.1% to 47.6%); during August 2019-May 2020, mint sales decreased (47.6% to 0.3%), as menthol sales increased (10.7% to 61.8%). Among disposable e-cigarette sales during September 2014-May 2020, the proportion of mint sales increased (<0.1% to 10.5%), although tobacco-flavored (52.2% to 17.2%) and menthol-flavored (30.3% to 10.2%) sales decreased; during the same period, sales of all other flavors combined increased (17.2% to 62.1%). E-cigarette sales increased during 2014-2020, but fluctuations occurred overall and by product and flavor type, which could be attributed to consumer preferences and accessibility. Continued monitoring of e-cigarette sales and use is critical to inform strategies at the national, state, and community levels to minimize the risks of e-cigarettes on individual- and population-level health. As part of a comprehensive approach to prevent and reduce youth e-cigarettes use, such strategies could include those that address youth-appealing product innovations and flavors.
Conflict of interest statement
All authors have completed and submitted the International Committee Medical Journal Editors form for disclosure of potential conflicts of interest. No potential conflicts of interest were disclosed.
Figures
References
-
- US Department of Health and Human Services. E-cigarette use among youth and young adults: a report of the Surgeon General. Atlanta, GA: US Department of Health and Human Services, CDC; 2016. https://www.cdc.gov/tobacco/data_statistics/sgr/e-cigarettes/pdfs/2016_s...
-
- Office of the Surgeon General. Surgeon General’s advisory on e-cigarette use among youth. Washington, DC: US Department of Health and Human Services, Office of the Surgeon General; 2018. https://e-cigarettes.surgeongeneral.gov/documents/surgeon-generals-advis...
MeSH terms
Substances
LinkOut - more resources
Full Text Sources
Medical
Research Materials
