

SARS-CoV-2 positivity rates associated with circulating 25-hydroxyvitamin D levels
- PMID: 32941512
- PMCID: PMC7498100
- DOI: 10.1371/journal.pone.0239252
SARS-CoV-2 positivity rates associated with circulating 25-hydroxyvitamin D levels
Abstract
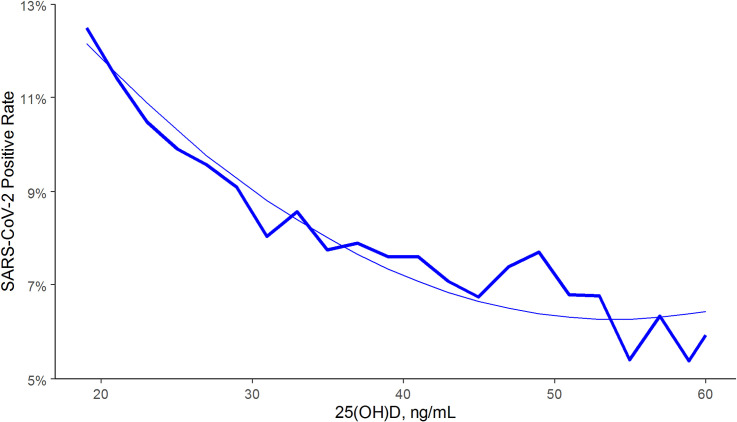
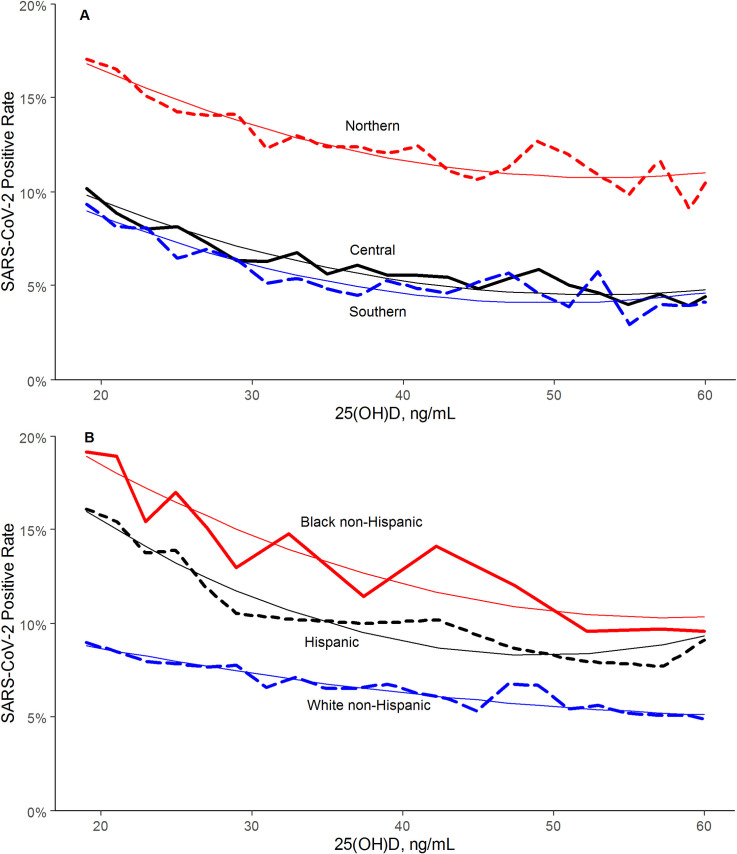
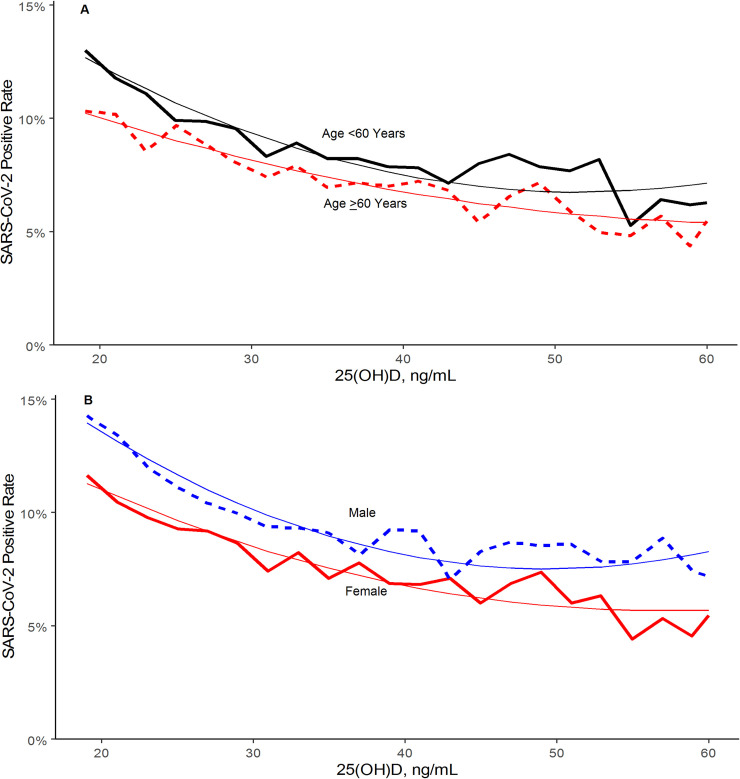
Until treatment and vaccine for coronavirus disease-2019 (COVID-19) becomes widely available, other methods of reducing infection rates should be explored. This study used a retrospective, observational analysis of deidentified tests performed at a national clinical laboratory to determine if circulating 25-hydroxyvitamin D (25(OH)D) levels are associated with severe acute respiratory disease coronavirus 2 (SARS-CoV-2) positivity rates. Over 190,000 patients from all 50 states with SARS-CoV-2 results performed mid-March through mid-June, 2020 and matching 25(OH)D results from the preceding 12 months were included. Residential zip code data was required to match with US Census data and perform analyses of race/ethnicity proportions and latitude. A total of 191,779 patients were included (median age, 54 years [interquartile range 40.4-64.7]; 68% female. The SARS-CoV-2 positivity rate was 9.3% (95% C.I. 9.2-9.5%) and the mean seasonally adjusted 25(OH)D was 31.7 (SD 11.7). The SARS-CoV-2 positivity rate was higher in the 39,190 patients with "deficient" 25(OH)D values (<20 ng/mL) (12.5%, 95% C.I. 12.2-12.8%) than in the 27,870 patients with "adequate" values (30-34 ng/mL) (8.1%, 95% C.I. 7.8-8.4%) and the 12,321 patients with values ≥55 ng/mL (5.9%, 95% C.I. 5.5-6.4%). The association between 25(OH)D levels and SARS-CoV-2 positivity was best fitted by the weighted second-order polynomial regression, which indicated strong correlation in the total population (R2 = 0.96) and in analyses stratified by all studied demographic factors. The association between lower SARS-CoV-2 positivity rates and higher circulating 25(OH)D levels remained significant in a multivariable logistic model adjusting for all included demographic factors (adjusted odds ratio 0.984 per ng/mL increment, 95% C.I. 0.983-0.986; p<0.001). SARS-CoV-2 positivity is strongly and inversely associated with circulating 25(OH)D levels, a relationship that persists across latitudes, races/ethnicities, both sexes, and age ranges. Our findings provide impetus to explore the role of vitamin D supplementation in reducing the risk for SARS-CoV-2 infection and COVID-19 disease.
Conflict of interest statement
HWK, JKN, MHK, and CB are employees of Quest Diagnostics. HWK, MHK and CB own stock in Quest Diagnostics. MFH is a consultant to Quest Diagnostics and was on the speakers’ bureau for Abbott Inc. and Hyatt Pharmaceutical Industries Company PLC.
Figures
References
Publication types
MeSH terms
Substances
LinkOut - more resources
Full Text Sources
Medical
Miscellaneous
