. 2020 Oct 9;48(18):10297-10312.
doi: 10.1093/nar/gkaa766.

Epigenetic silencing of clustered tRNA genes in Arabidopsis

Affiliations

Epigenetic silencing of clustered tRNA genes in Arabidopsis

Guillaume Hummel et al. Nucleic Acids Res. .

Abstract

Beyond their key role in translation, cytosolic transfer RNAs (tRNAs) are involved in a wide range of other biological processes. Nuclear tRNA genes (tDNAs) are transcribed by the RNA polymerase III (RNAP III) and cis-elements, trans-factors as well as genomic features are known to influence their expression. In Arabidopsis, besides a predominant population of dispersed tDNAs spread along the 5 chromosomes, some clustered tDNAs have been identified. Here, we demonstrate that these tDNA clusters are transcriptionally silent and that pathways involved in the maintenance of DNA methylation play a predominant role in their repression. Moreover, we show that clustered tDNAs exhibit repressive chromatin features whilst their dispersed counterparts contain permissive euchromatic marks. This work demonstrates that both genomic and epigenomic contexts are key players in the regulation of tDNAs transcription. The conservation of most of these regulatory processes suggests that this pioneering work in Arabidopsis can provide new insights into the regulation of RNA Pol III transcription in other organisms, including vertebrates.


Figures

Figure 1.
Figure 1.
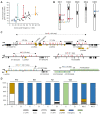
Characterization of tDNA clusters and their genomic context in Arabidopsis. (A) Correlation between the number of tDNAs specific for each amino acid and the frequency of occurrence of the same amino acid. For Ser (S yellow), Tyr (Y green), Pro (P red) and Cys (C blue) amino acids, the numbers corresponding to tDNAs found in clusters were subtracted and colored dots represent the new correlation. (B) Schematic representation of tDNA clusters loci and tDNA copies located on Arabidopsis Chr1, 2 and 5. Pericentromeric regions are in gray. (C) Schematic representation of genomic regions containing clustered tDNAs. tDNAs are indicated by colored vertical bars (Y: green, P: red, S: yellow and C: blue). Presence of tDNA pseudogenes is also indicated by black bars with an asterisk (see Supplementary Table S1 for details). Black boxes: exons in CDS; gray boxes exons in UTRs; lines: introns; brown boxes: putative long non coding RNAs (LncRNAs). Arrows indicate transcription orientation. (D) Distribution of the location of clustered (c) and dispersed (d) tDNAs on Arabidopsis genome (TAIR10.1).
Figure 2.
Figure 2.
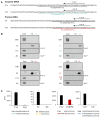
Expression analysis of Arabidopsis tDNA clusters. (A) Predominant sequences of dispersed (Y14 and P8) and clustered (Y32 and P33) Tyr and Pro tDNAs. Nucleotide differences are in bold for Tyr (green) and Pro (red) clustered tDNAs. Underlined sequences (Yd: dispersed Tyr, Yc: clustered Tyr, Pd: dispersed Pro and Pc: clustered Pro) were used as controls. Sequences indicated by arrows (Y16 P, Y34 P, P12 P and P45 P) were used as oligonucleotide probes for northern blot. Note that P45 P probe designed for clustered Pro tDNAs (P38) is also complementary to 7 dispersed Pro tDNAs (P7; Supplementary Figure S2). (B) Northern blot detection of dispersed (upper left) and clustered (upper right) Tyr plus dispersed (lower left) and clustered (lower right) Pro tRNAs in WT plants. Nomenclatures of the left and right sides refer to controls and probes as depicted in (A). Ethidium bromide (EtBr) staining and hybridization with an Arabidopsis cytosolic Alanine tRNA probe (Ala P) were used as loading controls. Original uncropped blots are available in Supplementary Figure S11. (C) Histograms showing the average abundance of tRFs (±SE) specific to dispersed Tyr (Y15), Serine (S1), Pro (P12) and Cys (C2d) tRNAs and clustered Tyr (Y53), Ser (S9) and Cys (C2c) tRNAs. The tRF sequence ‘TGCCCCCCA’ is specific to 40 clustered Pro tRNAs (P40) and eight dispersed Pro tRNAs (P8). tRFs sequences are indicated below each graph with nucleotide differences in bold and colored. tRFs with lengths ranging from 19 to 26 nt were analyzed.
Figure 3.
Figure 3.
Methylation landscape at dispersed and clustered tDNA loci. (A) Schematic representation of a tDNA locus with transcriptional internal control A and B boxes, upstream TATA-like elements and CAA motif and downstream poly-T tract (7). For each tDNA, the region spanning from −50 bp to +25 bp was examined for DNA methylation level in CG (red), CHG (green) and CHH (blue) contexts. (B) Boxplots representing DNA cytosine counts in dispersed and clustered Pro, Ser, Tyr and Cys tDNAs. (C) Boxplots representing DNA methylation levels on dispersed and clustered Pro, Ser, Tyr and Cys tDNAs. (D) DNA methylation levels at single nucleotide resolution on dispersed and clustered Pro, Ser, Tyr and Cys tDNAs. Only predominant polymorphic sequences of identical length have been used for these representations. Positive and negative values are referring to DNA strands. Regions corresponding to tDNA sequences are delimited by dotted lines. Statistical analysis (pairwise Wilcoxson tests) are provided in Data S1.
Figure 4.
Figure 4.
DNA methylation landscape at clustered tDNAs in DNA methylation mutant plants. Box plots representing DNA methylation levels in various mutant lines for dispersed and clustered Pro, Ser, Tyr and Cys tDNAs. CG (red), CHG (green) and CHH (blue) contexts. Statistical analysis (pairwise Wilcoxson tests) are provided in Data S2.
Figure 5.
Figure 5.
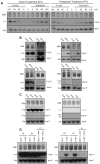
Effect of DNA hypomethylation on tDNAs cluster expression. (A) Northern blots analysis of total tRNAs of untreated (0), 5-azaC or zebularine treated WT Arabidopsis plants. Two conditions were used: direct treatment (DT) or postponed treatment (PT) as described in (50). (B and C) Northern blots analysis of total tRNAs of the indicated mutant genotypes. Experimental conditions and probes are similar to those described in Figure 2B. (D) Northern blot analysis in S1 plants (selfing) and in F1 hybrids (reciprocal crosses) between Col0 and ddm1 mutant plants. Names of probes are as in Figure 2: Y16P and P12P probes are specific to dispersed Tyr and Pro tRNAs, respectively. Y34P and P45P are mainly specific to clustered Tyr and Pro tRNAs, respectively. Original uncropped blots are available in Supplementary Figure S11.
Figure 6.
Figure 6.
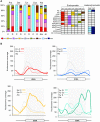
Chromatin states (CS) of dispersed and clustered tDNAs loci. (A) Histogram (left panel) showing proportions of the nine chromatin states (CS) (29) at dispersed (D), clustered (C) and Ala tDNAs and for Arabidopsis genome (At). Table (right panel) featuring characteristic signatures for each CS (adapted from (47)). (B) Nucleosome occupancy at Ser, Tyr, Pro, Ala, dispersed (D) and clustered (C) tDNA loci. The two Tyr tDNAs in the Ser-Tyr-Tyr tandemly repeated units are numbered 1 and 2, respectively.
Figure 7.
Figure 7.
Model of epigenetic regulation of clustered tDNAs. Dispersed tDNAs are spread along Arabidopsis chromosomes and clustered tDNAs repeats are located in distinct genomic (Chr 1, 2 and 5) and epigenomic (heterochromatic and euchromatic) environments. Dispersed tDNAs are found in a euchromatic permissive context allowing their expression (ON: Green light). Ser-Tyr-Tyr and Cys clusters overlap with heterochromatic state and are found within intergenic and TE genomic regions, respectively. Pro clusters overlap with euchromatic state and are located in the vicinity of PCGs or within intron (black line) of PCGs. These clustered tDNAs are found in a repressive chromatin context preventing their expression (OFF: red light). In intergenic genomic regions, DNA methylation levels at Ser-Tyr-Tyr clusters is efficiently maintained through the combined actions of the DNA methyltransferases MET1 (CG: red circle), CMT3 (CHG: blue circle) and CMT2 (CHH: green circle). H3K9 histone methyltransferase KYP allows directing DNA methylation in both CHG and CHH contexts via CMT3 and CMT2, respectively. In TE genomic regions, DNA methylation levels at Cys cluster is maintained through the predominant action of DNA methyltransferases MET1 and CMT3. H3K9 histone methyltransferase KYP allows directing DNA methylation in the CHG context via CMT3. In these heterochromatic clusters, chromatin remodeling factor DDM1 plays an important role to allow efficient maintenance of DNA methylation. In PCG region, DNA methylation levels at Pro clusters is maintained through combined actions of DNA methyltransferases MET1, and to a lower extent CMT2 and CMT3. In this case, KYP would direct DNA methylation in both CHG and CHH contexts. Interestingly, H3K9 histone demethylase, IBM1, likely acts to properly balance H3K9me2 level and thus CHG and CHH DNA methylation controlled by KYP, CMT3 and CMT2.

Similar articles

Cited by

References

    1. Turowski T.W., Tollervey D.. Transcription by RNA polymerase III: insights into mechanism and regulation. Biochem. Soc. Trans. 2016; 44:1367–1375. - PMC - PubMed
    1. Goodenbour J.M., Pan T.. Diversity of tRNA genes in eukaryotes. Nucleic Acids Res. 2006; 34:6137–6146. - PMC - PubMed
    1. Bermudez-Santana C., Attolini C.S., Kirsten T., Engelhardt J., Prohaska S.J., Steigele S., Stadler P.F.. Genomic organization of eukaryotic tRNAs. BMC Genomics. 2010; 11:270–284. - PMC - PubMed
    1. Lowe T.M., Chan P.P.. tRNAscan-SE On-line: integrating search and context for analysis of transfer RNA genes. Nucleic Acids Res. 2016; 44:W54–W57. - PMC - PubMed
    1. Lin B.Y., Chan P.P., Lowe T.M.. tRNAviz: explore and visualize tRNA sequence features. Nucleic Acids Res. 2019; 47:W542–W547. - PMC - PubMed

Publication types