. 2020 Oct 6;32(4):665-675.e6.
doi: 10.1016/j.cmet.2020.08.016. Epub 2020 Sep 16.

Obesity-Linked PPARγ S273 Phosphorylation Promotes Insulin Resistance through Growth Differentiation Factor 3

Affiliations

Obesity-Linked PPARγ S273 Phosphorylation Promotes Insulin Resistance through Growth Differentiation Factor 3

Jessica A Hall et al. Cell Metab. .

Abstract

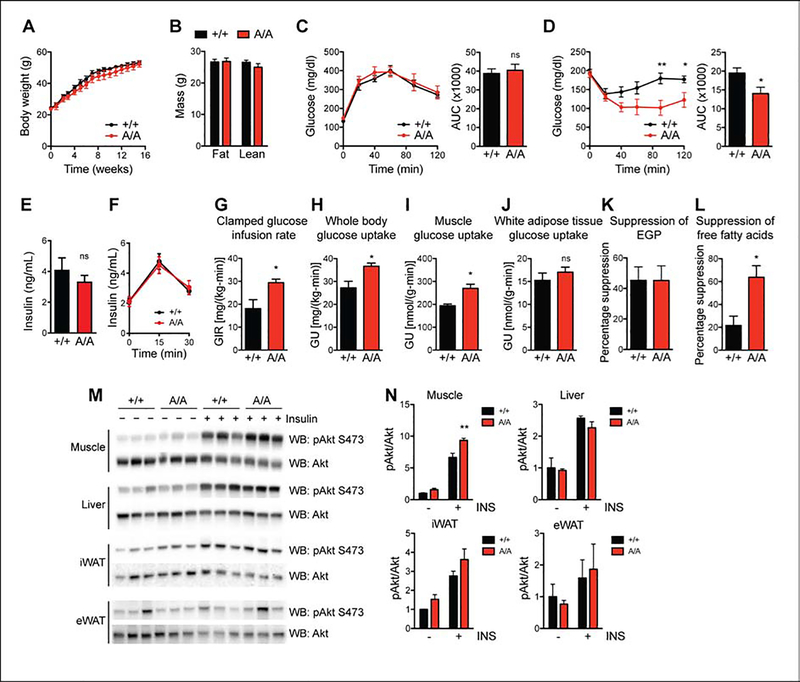
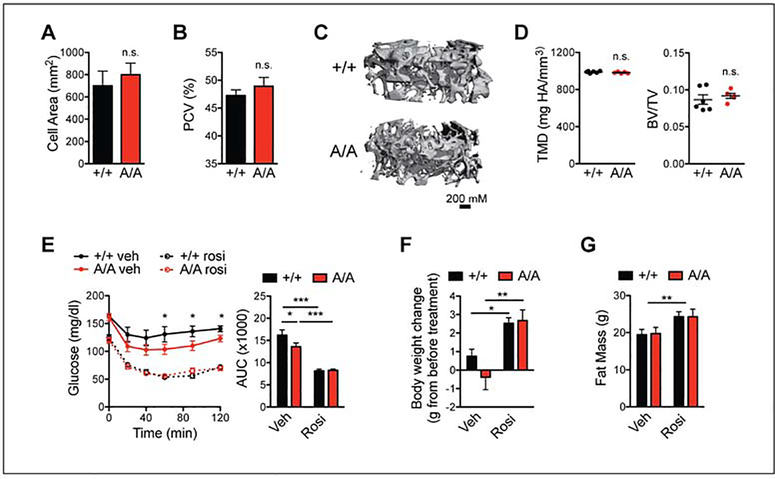
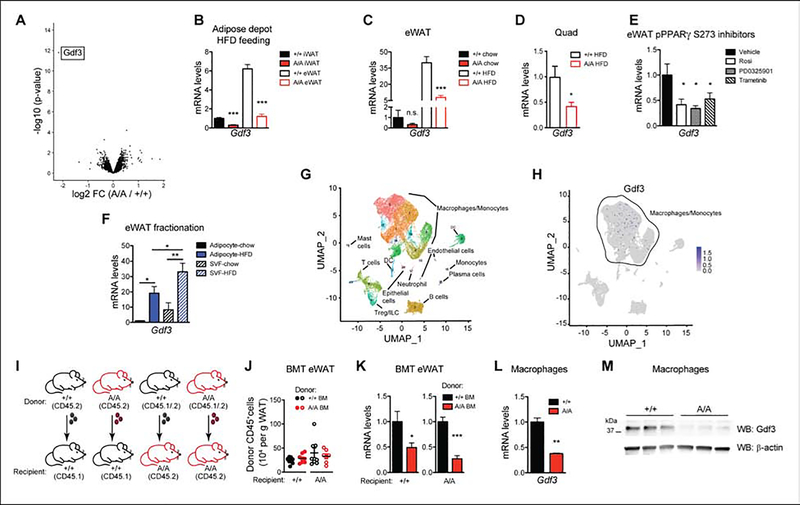
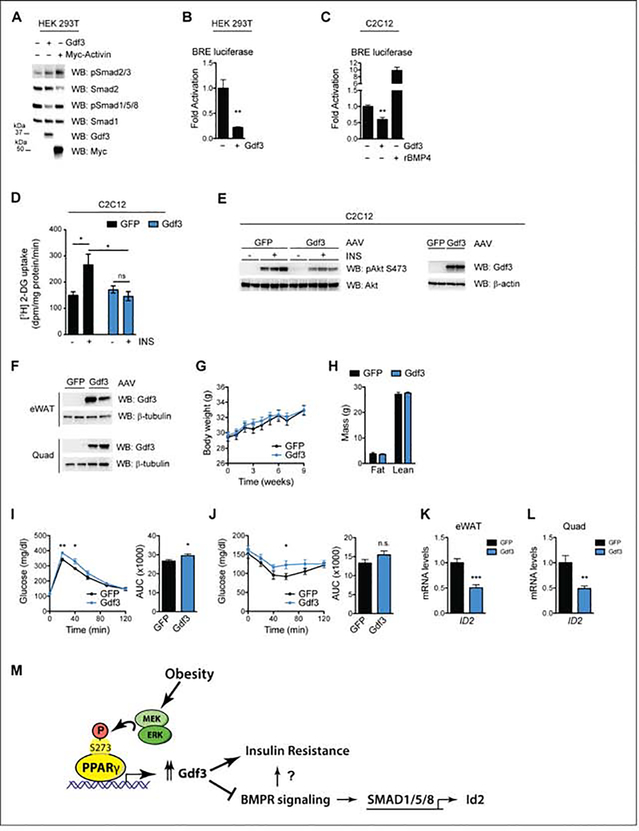
The thiazolidinediones (TZDs) are ligands of PPARγ that improve insulin sensitivity, but their use is limited by significant side effects. Recently, we demonstrated a mechanism wherein TZDs improve insulin sensitivity distinct from receptor agonism and adipogenesis: reversal of obesity-linked phosphorylation of PPARγ at serine 273. However, the role of this modification hasn't been tested genetically. Here we demonstrate that mice encoding an allele of PPARγ that cannot be phosphorylated at S273 are protected from insulin resistance, without exhibiting differences in body weight or TZD-associated side effects. Indeed, hyperinsulinemic-euglycemic clamp experiments confirm insulin sensitivity. RNA-seq in these mice reveals reduced expression of Gdf3, a BMP family member. Ectopic expression of Gdf3 is sufficient to induce insulin resistance in lean, healthy mice. We find Gdf3 inhibits BMP signaling and insulin signaling in vitro. Together, these results highlight the diabetogenic role of PPARγ S273 phosphorylation and focus attention on a putative target, Gdf3.

Keywords: BMP; GDF3; PPARγ; TGF-β; adipose tissue; diabetes; inflammation; insulin resistance; macrophage; obesity.


Conflict of interest statement

Declaration of Interests E.D.R. is a paid consultant of Novartis. B.B.K. consults for Alterna and serves on the Scientific Advisory Board of Janssen Pharmaceuticals. A.S.B. and B.M.S. hold a patent related to this work.

Figures

Figure 1.
Figure 1.. Improved insulin sensitivity in mice with non-phosphorylatable PPARγ S273.
Male wildtype (+/+) and PPARγA/A (A/A) mice were fed high-fat diet (HFD) for 16 weeks. A. Body weight of mice during HFD feeding (n = 6 +/+, 5 A/A). B. Body composition of mice at 16 weeks of HFD feeding. C. Glucose tolerance test (1 g glucose/kg body weight) after 15 weeks on HFD. D. Insulin tolerance test (2 U insulin/kg body weight) after 16 weeks on HFD. C-D. Right, area under the curve (AUC) for the respective test. Results are representative of three independent experiments. E. Fasting insulin levels in male mice on HFD for 16 weeks and fasted overnight (n = 6 +/+, 5 A/A). F. Glucose (3 g glucose/kg body weight) stimulated insulin levels at indicated timepoints for male mice on HFD for 17 weeks (n = 6 +/+, 5 A/A). G-L. Hyperinsulinemic-euglycemic clamps in HFD-fed mice (n = 4 +/+, 5 A/A). G. Glucose infusion rate (GIR). H. Whole body glucose uptake (GU). I. Glucose uptake into skeletal muscle. J. Glucose uptake into epididymal white adipose tissue. K. Percentage suppression of endogenous glucose production (EGP). L. Percentage suppression of free fatty acids. M-N. Insulin sensitivity as determined by insulin-stimulated Akt phosphorylation (Ser 473) in tissues of HFD-fed +/+ and A/A mice. M. Immunoblot analyses of skeletal muscle, liver, inguinal white adipose tissue (iWAT), and epididymal white adipose tissue (eWAT). N. Quantification of blots in M. Results are representative of at least two independent experiments. Data are presented as mean ± SEM; *, P < 0.05; and **, P < 0.01 by Student’s t test (A-L) and one-way ANOVA with Newman-Keuls Multiple Comparison test (N).
Figure 2.
Figure 2.. PPARγA/A and wildtype mice respond similarly to PPARγ agonist treatment.
A-D. PPARγA/A (A/A) mice fed HFD for 16 weeks, do not innately exhibit the adverse effects associated with PPARγ agonism. A. Average cell area of adipocytes from epididymal adipose tissue after HFD feeding (n = 3). B. Hematocrit (packed cell volume, PCV; n = 6 wildtype (+/+), 5 A/A). C-D. Microquantitative computed tomography (microCT) analysis of trabecular bone from femurs of 6-month old mice maintained on HFD (n = 6 +/+, 5 A/A). C. Representative image of microCT. D. Parameters from microCT analysis, including tissue mineral density (TMD, left) and trabecular bone volume fraction (BV/TV, right). E-G. Both +/+ and A/A mice respond to treatment with PPARγ agonist rosiglitazone. After 19 weeks of HFD feeding, mice were treated with either vehicle or rosiglitazone (rosi) for 10 days (8 mg/kg body weight; n = 7 per genotype). E. Insulin tolerance test (1.5 U insulin/kg body weight); right, area under the curve (AUC). F. Body weight gained over course of treatment. G. Total fat mass at end of treatment. Data are presented as mean ± SEM; *, P < 0.05; **, P < 0.01; and ***, P < 0.001 by one-way ANOVA with Newman-Keuls Multiple Comparison (E-F) and two-way ANOVA (G).
Figure 3.
Figure 3.. Expression of Gdf3 is associated with PPARγ S273 phosphorylation
A-B. PPARγA/A (A/A) and wildtype (+/+) mice fed HFD for 37 weeks. A. Volcano plot from RNA-seq analysis on epididymal adipose tissue (eWAT), with differentially expressed gene Gdf3 highlighted. B. qPCR validation of decreased Gdf3 mRNA levels in eWAT and inguinal adipose tissue (iWAT) of HFD-fed A/A mice. C. Gdf3 mRNA levels in eWAT from mice on chow or HFD for 25 weeks. D. Gdf3 mRNA levels in quadriceps from mice fed HFD for 17 weeks. E. Gdf3 mRNA levels in obese adipose tissue also decrease following treatment with known inhibitors of PPARγ S273 phosphorylation (rosiglitazone or either of two MEK inhibitors, PD0325901 or Trametinib; n = 4–6). F. Fractionated adipose tissue indicates Gdf3 is highly expressed in both the SVF and adipocyte fractions of eWAT from mice fed HFD for 10 weeks. G-H. Single Cell RNA-sequencing of SVF from HFD-fed +/+ mice shows detectable expression mainly in the macrophage/monocyte population. I-K. Generation of bone marrow chimeras reveals dominant role of hematopoietic cells in decreased Gdf3 expression of A/A mice. I. Scheme used for bone marrow transplantation study, including use of congenic C57BL/6 strains carrying functionally equivalent alleles of the pan leukocyte marker CD45. J. Quantification of donor CD45+ cells in recipient eWAT tissue after HFD treatment of chimeric mice (n = 7–8). K. Gdf3 mRNA levels in eWAT after HFD treatment of chimeric mice (n = 7–8). L-M. Thioglycollate-elicited peritoneal macrophages from chow fed A/A mice exhibit decreased Gdf3 (L) mRNA and (M) protein levels. Data are presented as mean ± SEM; *, P < 0.05; **, P < 0.01; and ***, P < 0.001 by Student’s t test (B-D, per tissue/conditition; J-L) and one-way ANOVA with Newman-Keuls Multiple Comparison test (E-F).
Figure 4.
Figure 4.. GDF3 limits BMP signaling, affects glucose uptake in vitro and is sufficient to induce insulin resistance in vivo.
A. Immunoblot analysis of HEK 293T cells transfected with Gdf3 or Myc-Activin constructs. Cells were deprived of serum for 16 h prior to whole-cell extract. B. Luciferase assay using a BMP-responsive element (BRE) driving luciferase reporters in serum-starved HEK 293T cells. C. BRE luciferase assay in C2C12 myoblasts that have been deprived of serum. Overnight treatment of 100 ng/mL rBMP4 demonstrates reporter activation. D-E. C2C12 myotubes transduced with AAV-GFP or AAV-Gdf3. D. [3H] 2-deoxy-D-glucose (2-DG) uptake assays, n = 6 wells per group. E. Immunoblot analyses. F-L. As a gain-of function model, 13 week old male mice were administered AAV-GFP or AAV-Gdf3, n = 10 mice per group. F. Immunoblots from eWAT and quad from two mice from each group, 9 weeks post injections. G. Body weights of mice; week 0 represents the values on the day of AAV injections. H. Body composition at 6 weeks post injections. I. Glucose tolerance test (2 g glucose/kg body weight) 4 weeks post injections. J. Insulin tolerance test (0.75 U insulin/kg body weight) 3 weeks post injections. Right, area under the curve (AUC) for the respective test (I-J). K-L. Relative Id2 mRNA levels from eWAT (K) and quadriceps (L). M. Model illustrating novel role for PPARγ S273 phosphorylation and Gdf3 in impaired insulin action with obesity. Data are presented as relative activity after normalization to Renilla luciferase (B-C) and as mean ± SEM (B-D, G-L); ns, not significant; *, P < 0.05; **, P < 0.01; and ***, P < 0.001 by Student’s t test (B-C, G-L) and two-way ANOVA with Sidak’s Multiple Comparison test (D).

References

    1. Altshuler D, Hirschhorn JN, Klannemark M, Lindgren CM, Vohl MC, Nemesh J, Lane CR, Schaffner SF, Bolk S, Brewer C, et al. (2000). The common PPARgamma Pro12Ala polymorphism is associated with decreased risk of type 2 diabetes. Nature genetics 26, 76–80. - PubMed
    1. Amato AA, Rajagopalan S, Lin JZ, Carvalho BM, Figueira AC, Lu J, Ayers SD, Mottin M, Silveira RL, Souza PC, et al. (2012). GQ-16, a novel peroxisome proliferator-activated receptor gamma (PPARgamma) ligand, promotes insulin sensitization without weight gain. J Biol Chem 287, 28169–28179. - PMC - PubMed
    1. Andersson O, Korach-Andre M, Reissmann E, Ibanez CF, and Bertolino P (2008). Growth/differentiation factor 3 signals through ALK7 and regulates accumulation of adipose tissue and diet-induced obesity. Proc Natl Acad Sci U S A 105, 7252–7256. - PMC - PubMed
    1. Banks AS, McAllister FE, Camporez JP, Zushin PJ, Jurczak MJ, Laznik-Bogoslavski D, Shulman GI, Gygi SP, and Spiegelman BM (2015). An ERK/Cdk5 axis controls the diabetogenic actions of PPARgamma. Nature 517, 391–395. - PMC - PubMed
    1. Boden G (1997). Role of fatty acids in the pathogenesis of insulin resistance and NIDDM. Diabetes 46, 3–10. - PubMed

Publication types