. 2020 Nov 3;32(5):767-785.e7.
doi: 10.1016/j.cmet.2020.08.015. Epub 2020 Sep 16.

Glial Metabolic Rewiring Promotes Axon Regeneration and Functional Recovery in the Central Nervous System

Affiliations

Glial Metabolic Rewiring Promotes Axon Regeneration and Functional Recovery in the Central Nervous System

Feng Li et al. Cell Metab. .

Abstract

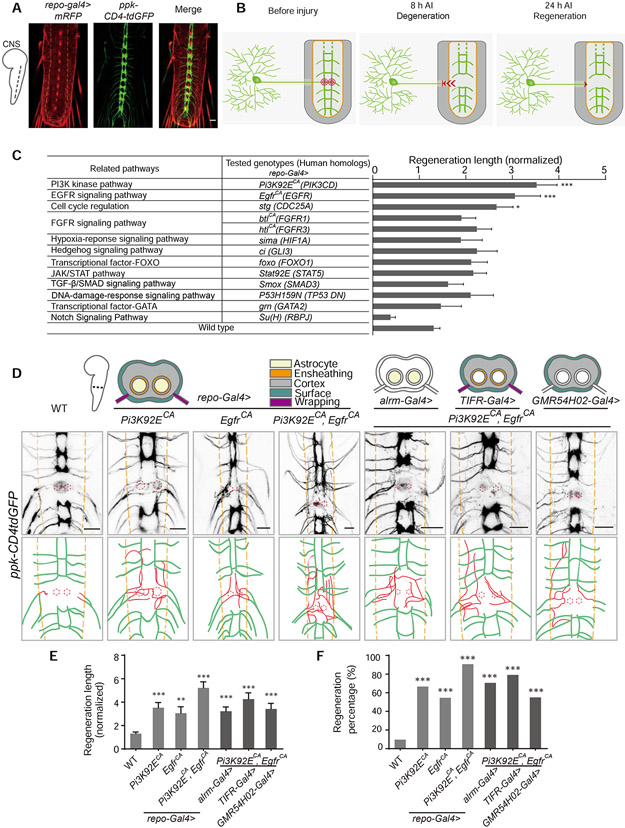
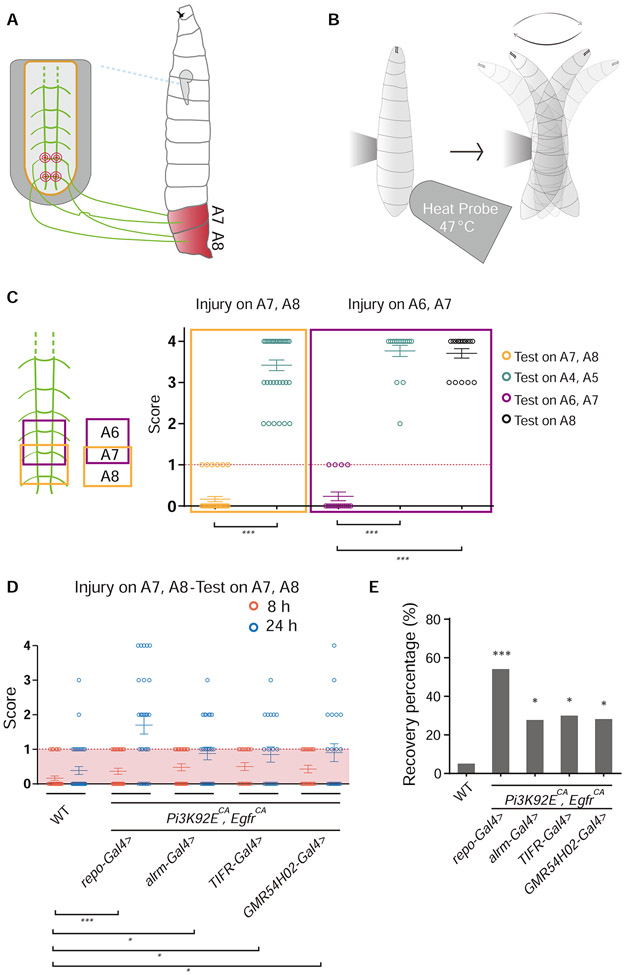
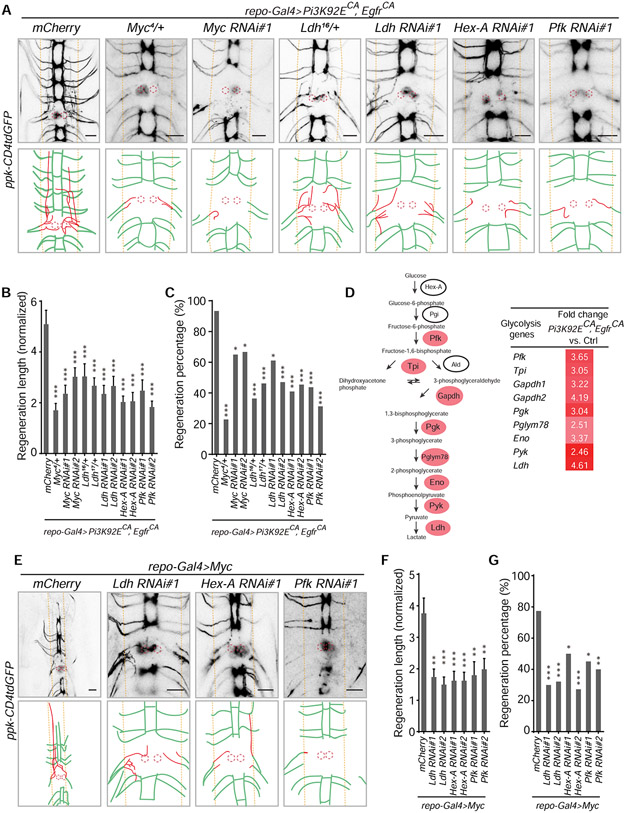
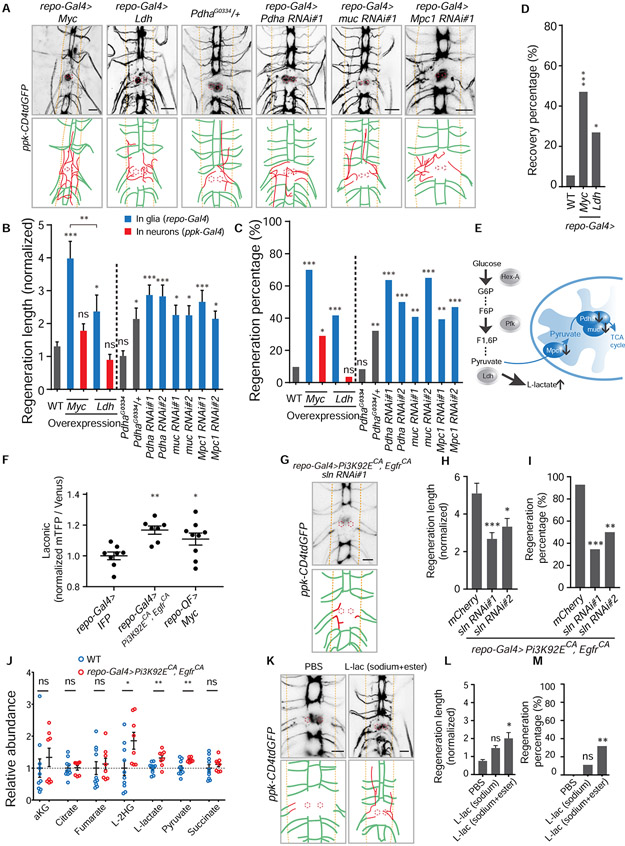
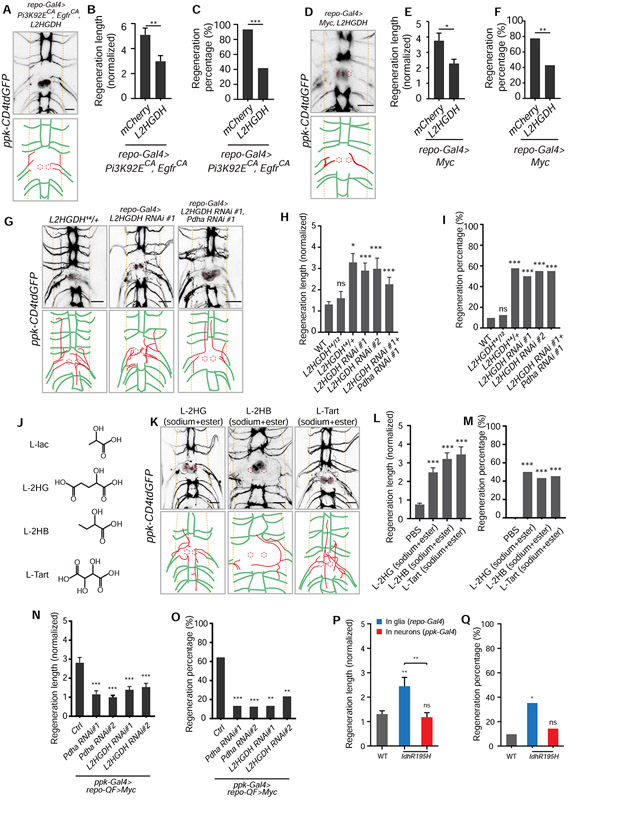
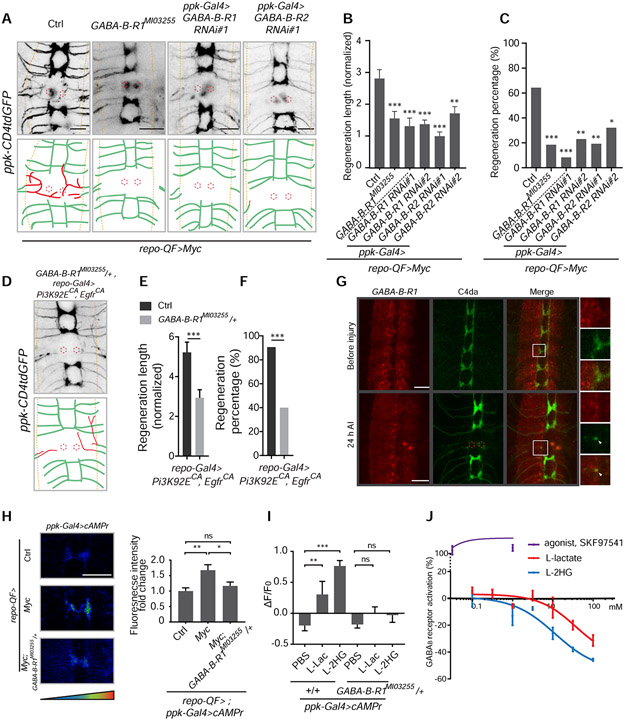
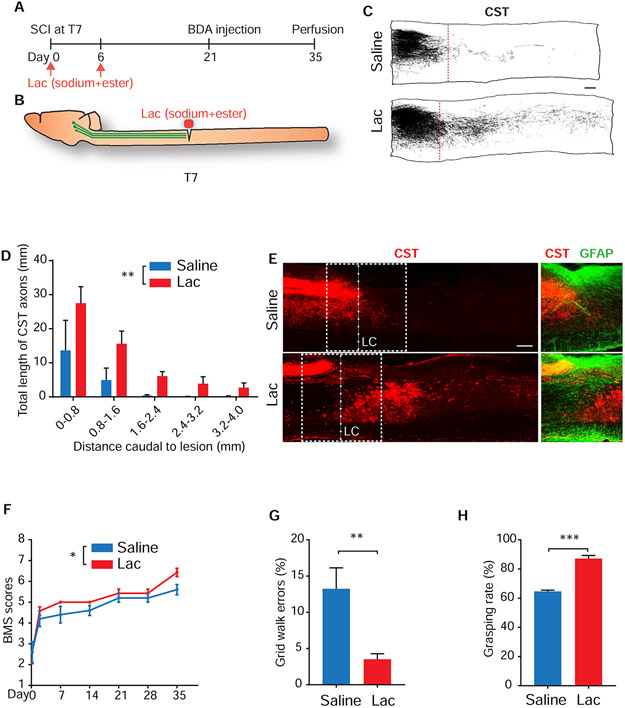
Axons in the mature central nervous system (CNS) fail to regenerate after axotomy, partly due to the inhibitory environment constituted by reactive glial cells producing astrocytic scars, chondroitin sulfate proteoglycans, and myelin debris. We investigated this inhibitory milieu, showing that it is reversible and depends on glial metabolic status. We show that glia can be reprogrammed to promote morphological and functional regeneration after CNS injury in Drosophila via increased glycolysis. This enhancement is mediated by the glia derived metabolites: L-lactate and L-2-hydroxyglutarate (L-2HG). Genetically/pharmacologically increasing or reducing their bioactivity promoted or impeded CNS axon regeneration. L-lactate and L-2HG from glia acted on neuronal metabotropic GABAB receptors to boost cAMP signaling. Local application of L-lactate to injured spinal cord promoted corticospinal tract axon regeneration, leading to behavioral recovery in adult mice. Our findings revealed a metabolic switch to circumvent the inhibition of glia while amplifying their beneficial effects for treating CNS injuries.

Keywords: 2-hydroxyglutarate; GABA(B) receptor; axon regeneration; cAMP; central nervous system; functional recovery; glia; lactate; metabolism; spinal cord injury.


Conflict of interest statement

Declaration of Interests The authors declare no competing interests.

Figures

Figure 1.
Figure 1.. Reprogramming glial cells promotes axon regeneration in the Drosophila CNS.
(A) Images show axon projection of C4da neurons in the VNC of WT Drosophila larvae (ppk-CD4tdGFP; repo-Gal4, UAS-mRFP). Axons are labeled with GFP, glial cells are labeled with RFP, and the neuropil is demarcated by the orange dashed lines. (B) Schematics of the Drosophila CNS injury model (WT). Left panel shows projection of C4da neuron axons in the larval VNC and the injury sites for one segment (red concentric circles); middle panel shows axons degenerating out of the neuropil (orange region) at 8 h AI; right panel shows injured axons regenerating to the boundary of the neuropil at 24 h AI. (C) Quantification of normalized regenerated axon length for the screened pathways when manipulated in glial cells, n = 24, 22, 19, 18, 26, 16, 14, 14, 14, 12, 10, 12, 18, 62 lesioned segments from 12, 11, 10, 9, 13, 8, 7, 7, 7, 6, 5, 6, 9, 31 larvae respectively for each genotype, WT (ppk-CD4tdGFP; repo-Gal4, UAS-mRFP) as control, one-way ANOVA with Dunnett’s test. See also Table S1. (D) Axon regrowth of C4da neurons induced by expressing Pi3K92ECA and EgfrCA individually or together in glia under the control of repo-Gal4, alrm-gal4, TIFR-Gal4 or GMR54H02-Gal4 at 24 h AI on segment A3 in the VNC. Schematics above the images show glia cohorts labeled by different promoters; diagrams below the images show regenerated axons (red) in the neuropil (demarcated by the orange dashed lines); the red dotted circles show injury sites. (E) Quantification of normalized regenerated axon length for genotypes shown in (D), n = 62, 24, 22, 32, 34, 24, 20 lesioned segments from 31, 12, 11, 16, 17, 12, 10 larvae respectively for each genotype, one-way ANOVA with Dunnett’s test. (F) Quantification of regeneration percentage for genotypes shown in (D), Fisher’s exact test. *P < 0.05, **P < 0.01 and ***P < 0.001. Scale bars, 20 μm. Data are expressed as mean ± s.e.m. CA, constitutively active; DN, dominant negative. See also Figure S1.
Figure 2.
Figure 2.. Reprogramming glial cells promotes functional recovery after injury in the Drosophila CNS.
(A and B) Schematics of the behavioral recovery paradigm. Lesion of the axons of C4da neurons corresponding to the A7 and A8 segments (A) leads to impaired circling behavior in response to a heat probe applied specifically to the A7 and A8 segments in the thermonociception behavior test (B). (C) Injuring C4da neuron axon bundles at A7-A8 or A6-A7 in the VNC leads to impaired thermonociceptive response specifically at segment A7-A8 or A6-A7, without affecting neighboring segments, n = 36 larvae and unpaired two-tailed Student's t-test for injury on A7 and A8, n = 17 larvae and one-way ANOVA with Dunnett’s test for injury on A6 and A7. (D) Behavioral scores of each larvae in which glial cells express Pi3K92ECA and EgfrCA by different promoters, compared to WT, n = 36, 30, 25, 20, 21 larvae for each genotype, each circle represents one larva, two-way ANOVA with Holm-Sidak's test. (E) Functional recovery percentage of larvae with genotypes shown in (D), Fisher’s exact test. *P < 0.05 and ***P < 0.001. Data are expressed as mean ± s.e.m. See also Figure S3.
Figure 3.
Figure 3.. Glycolysis in glia is essential for the axon regeneration induced by reprogramming glial cells.
(A) Axon regrowth of C4da neurons in flies with glial mCherry expression as control (UAS-mCherry; repo-Gal4, UAS-Pi3K92ECA, UAS-EgfrCA; ppk-CD4tdGFP), Myc mutation, glial Myc RNAi, Ldh mutation, glial Ldh RNAi, glial Hex-A RNAi and glial pfk RNAi in the repo-Gal4>Pi3K92ECA, EgfrCA background at 24 h AI on segment A3 in the VNC. Diagrams below the images show regenerated axons (red) in the neuropil (demarcated by the orange dashed lines), and the red dotted circles show injury sites. (B) Quantification of normalized regenerated axon length for genotypes shown in (A), with two RNAis for each gene knockdown, and two Ldh mutant allels, n = 28, 22, 20, 24, 22, 26, 18, 17, 22, 22, 16, 16 lesioned segments from 14, 11, 10, 12, 11, 13, 9, 9, 11, 11, 8, 8 larvae respectively for each genotype, one-way ANOVA with Dunnett’s test. (C) Quantification of regeneration percentage for genotypes in (B), Fisher’s exact test. (D) Mean FPKM (RNA-seq) fold change of genes in the glycolysis pathway, glial overexpression of Pi3K92ECA and EgfrCA versus control (repo-Gal4, UAS-mRFP). (E) Axon regrowth of C4da neurons in flies with glial mCherry expression as control (UAS-mCherry; repo-Gal4, UAS-Myc; ppk-CD4tdGFP), glial Ldh RNAi, Hex-A RNAi or pfk RNAi in the repo-Gal4>Myc background at 24 h AI on segment A3 in the VNC. (F) Quantification of normalized regenerated axon length for genotypes shown in (E), with two RNAis for each gene knockdown, n = 40, 20, 28, 22, 21, 20, 20 from 20, 10, 14, 11, 11, 10, 10 larvae respectively lesioned segments for each genotype, one-way ANOVA with Dunnett’s test. (G) Quantification of regeneration percentage for genotypes in (F), Fisher’s exact test. *P < 0.05, **P < 0.01 and ***P < 0.001. Scale bars, 20 μm. Data are expressed as mean ± s.e.m. CA, constitutively active. See also Figure S4.
Figure 4.
Figure 4.. Elevated glycolysis in glia is sufficient to promote axon regeneration in the CNS via glial L-lactate efflux.
(A) Axon regrowth of C4da neurons in flies with glial Myc expression, glial Ldh expression, Pdha mutation, glial Pdha RNAi, glial muc RNAi and glial Mpc1 RNAi at 24 h AI on segment A3 in the VNC. Diagrams below the images show regenerated axons (red) in the neuropil (demarcated by the orange dashed lines), and the red dotted circles show injury sites. (B) Quantification of normalized regenerated axon length for the genotypes of two separated groups. Left: WT, Myc expression in glia or C4da neurons, Ldh expression in glia or C4da neurons; right (WT as control): Pdha heterozygous and homozygous mutants, glial Pdha RNAis, glial muc RNAis and glial Mpc1 RNAis, with two RNAis for each gene knockdown, n = 62, 20, 31, 24, 28, 24, 28, 22, 28, 27, 20, 28, 32 lesioned segments from 31, 10, 16, 12, 14, 12, 14, 11, 14, 14, 10, 14, 16 larvae respectively for each genotype, one-way ANOVA with Holm-Sidak's test. (C) Quantification of regeneration percentage for genotypes in (B), Fisher’s exact test. (D) Functional recovery percentage of larvae (WT as control) in which glial cells express Myc or Ldh, n = 36, 17, 26 larvae for each genotype, Fisher’s exact test. (E) Schematic shows blocking genes which functionally connect glycolysis and the TCA cycle will lead to increase of the end-product of glycolysis, L-lactate. (F) Lactate level revealed by Laconic driven by repo-Gal4. Quantifications of fluorescence intensity ratio of mTFP/Venus from glial cells in the VNC, glial IFP expression as control (UAS-IFP; repo-Gal4, UAS-Laconic), n = 8, 7, 9 VNCs for each genotype, one-way ANOVA with Dunnett’s test. (G) Image and diagram showing C4da neuron axon regrowth of flies with glial sln RNAi in the background of repo-Gal4>Pi3K92ECA, EgfrCA at 24 h AI on segment A3 in the VNC. (H) Quantification of normalized regenerated axon length for the two glial sln RNAis in the background of repo-Gal4>Pi3K92ECA, EgfrCA, glial mCherry expression as control (UAS-mCherry; repo-Gal4, UAS-Pi3K92ECA, UAS-EgfrCA; ppk-CD4tdGFP), n = 28, 26, 18 from 14, 13, 9 larvae respectively lesioned segments for each genotype, one-way ANOVA with Dunnett’s test. (I) Quantification of regeneration percentage for genotypes in (H), Fisher’s exact test. (J) Metabolites level in the hemolymph collected from larvae of repo-Gal4>Pi3K92ECA, EgfrCA (n = 8) normalized to those in WT (n = 10), unpaired two-tailed Student's t-test for each metabolite. (K) Axon regrowth of C4da neurons at 24 h AI on segment A3 in the VNC of WT flies injected with PBS, L-lactate (final cone., ~100 mM sodium L-lactate + 15 mM ethyl L-lactate) right after injury. (L) Quantification of normalized regenerated axon length for WT flies injected with PBS, sodium L-lactate only (final con., ~150 mM) and L-lactate (final conc., ~100 mM sodium L-lactate + 15 mM ethyl L-lactate) right after injury, n = 22, 18, 22 lesioned segments from 11, 9, 11 larvae respectively for each group, one-way ANOVA with Dunnett’s test. (M) Quantification of regeneration percentage for treatment groups in (L), Fisher’s exact test. *P < 0.05, **P < 0.01, ***P < 0.001 and ns, not significant. Scale bars, 20 μm. Data are expressed as mean ± s.e.m. CA, constitutively active. See also Figure S4.
Figure 5.
Figure 5.. L-2HG mediates the axon regeneration induced by reprogramming glial cells and is sufficient to promote axon regeneration in the CNS.
(A) Axon regrowth of C4da neurons in flies with glial L2HGDH overexpression in the repo-Gal4>Pi3K92ECA, EgfrCA background at 24 h AI on segment A3 in the VNC. Diagrams below the images show regenerated axons (red) in the neuropil (demarcated by the orange dashed lines), and the red dotted circles show injury sites. (B) Quantification of normalized regenerated axon length for flies with glial mCherry overexpression as control (UAS-mCherry; repo-Gal4, UAS-Pi3K92ECA, UAS-EgfrCA; ppk-CD4tdGFP) and L2HGDH overexpression in the repo-Gal4>Pi3K92ECA, EgfrCA background, n = 28, 24 lesioned segments from 14 and 12 larvae for each genotype, unpaired two-tailed Student's t-test. (C) Quantification of regeneration percentage for genotypes in (B), Fisher’s exact test. (D) Axon regrowth of C4da neurons in flies with glial L2HGDH overexpression in the repo-Gal4>Myc background at 24 h AI on segment A3 in the VNC. (E) Quantification of normalized regenerated axon length for flies with glial mCherry overexpression as control (UAS-mCherry; repo-Gal4, UAS-Myc; ppk-CD4tdGFP) and L2HGDH overexpression in the repo-Gal4>Myc background, n = 40, 28 lesioned segments from 20 and 14 larvae for each genotype, unpaired two-tailed Student's t-test. (F) Quantification of regeneration percentage for genotypes in (E), Fisher’s exact test. (G) Axon regrowth of C4da neurons in flies with L2HGDH heterozygous mutants, glial L2HGDH RNAi and glial L2HGDH RNAi + Pdha RNAi at 24 h AI on segment A3 in the VNC. (H) Quantification of normalized regenerated axon length for flies (WT as control) with L2HGDH heterozygous and transheterozygous mutants, glial L2HGDH RNAis (two RNAis), and glial L2HGDH RNAi + Pdha RNAi, n = 62, 16, 26, 26, 20, 20 lesioned segments from 31, 8, 13, 13, 10, 10 larvae respectively for each genotype, one-way ANOVA with Dunnett’s test. (I) Quantification of regeneration percentage for genotypes in (H), Fisher’s exact test. (J) Diagrams show structures of L-lactate, L-2HG (L-2-hydroxyglutarate), L-2HB (L-2-hydroxybutyrate) and L-tartrate, which share the α-hydroxycarboxylic acid group. (K) Axon regrowth of C4da neurons at 24 h AI on segment A3 in the VNC of WT flies injected with L-2HG (final cone., ~100 mM disodium L-2HG + 5 mM octyl L-2HG), L-2HB (~100 mM sodium L-2HG + 15 mM ethyl 2HB) and L-tart (~100 mM sodium L-tart + 15 mM diethyl L-tart) right after injury. (L) Quantification of normalized regenerated axon length for WT flies injected with PBS, L-2HG (final conc., ~100 mM disodium L-2HG + 5 mM octyl L-2HG), L-2HB (~100 mM sodium L-2HG + 15 mM ethyl 2HB) and L-tart (~100 mM sodium L-tart + 15 mM diethyl L-tart) right after injury, n = 22, 24, 29, 22 lesioned segments from 11, 12, 15, 11 larvae respectively for each genotype, one-way ANOVA with Dunnett’s test. (M) Quantification of regeneration percentage for treatment groups in (L), Fisher’s exact test. (N and O) Neuronal Pdha and L2HGDH are required for axon regeneration induced by glial overexpression of Myc. Normalized regenerated axon length (N) and regeneration percentage (O) of flies with ppk-Gal4 only as control (ppk-Gal4; repo-QF, QUAS-Myc; ppk-CD4tdGFP), neuronal Pdha or L2HGDH RNAis in the repo-QF>Myc background at 24 h AI, two RNAis for each gene, n = 28, 30, 32, 30, 30 lesioned segments from 14, 15, 16, 15, 15 larvae respectively for each genotype, one-way ANOVA with Dunnett’s test for regeneration length (N), Fisher’s exact test for regeneration percentage (O). (P and Q) Normalized regenerated axon length (P) and regeneration percentage (Q) of flies (WT as control) with glial or neuronal IdhR195H overexpression, n = 62, 17, 28 lesioned segments from 31, 9, 14 larvae respectively for each genotype, one-way ANOVA with Tukey's test for regeneration length (P), Fisher’s exact test for regeneration percentage (Q). *P < 0.05, **P < 0.01, ***P < 0.001 and ns, not significant. Scale bars, 20 μm. Data are expressed as mean ± s.e.m. CA, constitutively active. See also Figure S5.
Figure 6.
Figure 6.. Axon regeneration induced by reprogramming glial cells depends on GABAB receptor regulating cAMP in neurons.
(A) Axon regrowth of C4da neurons in flies with ppk-Gal4 only as control (ppk-Gal4; repo-QF, QUAS-Myc; ppk-CD4tdGFP), GABA-B-R1 mutation, C4da neuron GABA-B-R1 RNAi and C4da neuron GABA-B-R2 RNAi in the background of repo-QF>Myc at 24 h AI on segment A3 in the VNC (regenerated axons are in red; the neuropil is demarcated by the orange dashed lines; the red dotted circles show injury sites). (B) Quantification of normalized regenerated axon length for flies with ppk-Gal4 only as control (ppk-GalA; repo-QF, QUAS-Myc; ppk-CD4tdGFP), GABA-B-R1 mutation, C4da neuron GABA-B-R1 RNAis and C4da neuron GABA-B-R2 RNAis in the background of repo-QF>Myc, two RNAis for each gene knockdown, n = 28, 27, 24, 26, 26, 28 lesioned segments from 14, 14, 12, 13, 13, 14 larvae respectively for each genotype, one-way ANOVA with Dunnett’s test. (C) Quantification of regeneration percentage for genotypes in (B), Fisher’s exact test. (D) Axon regrowth of C4da neurons in flies with GABA-B-R1 mutation in the repo-Gal4>Pi3K92ECA, EgfrCA background at 24 h AI on segment A3 in the VNC. (E) Quantification of normalized regenerated axon length for control (repo-Gal4, UAS-Pi3K92ECA, UAS-EgfrCA; ppk-CD4tdGFP) and GABA-B-R1MI03255/+ heterozygotes in the repo-Gal4> Pi3K92FCA, EgfrCA background, n = 32, 30 lesioned segments from 16 and 15 larvae for each genotype, unpaired two-tailed Student's t-test. (F) Quantification of regeneration percentage for genotypes in (E), Fisher’s exact test. (G) Images showing co-localization of GABA-B-R1 and C4da neuron axons before and at 24 h AI. GABA-B-R1 is present in the axon terminal (arrow head) after injury. GABA-B-R1 is labeled by GABA-B-R1MI01930-GFSTF.0, a GFP-tagged GABA-B-R1 allele, and C4da neuron axons are labeled by ppk-CD4tdTomato. (H) Left, representative images of an axon segment in the VNC revealed by ppk-Gal4 driving cAMPr expression in C4da neurons, with glial Myc expression, glial Myc expression and GABA-B-R1 mutation, and repo-QF only as control (ppk-Gal4, UAS-cAMPr; repo-QF). Right, quantification of fluorescence intensity for cAMPr in the VNC axons of genotypes showed on the left, normalized to control, n = 12, 12, 16 segments from 6, 6, 8 larvae respectively for each genotype, one-way ANOVA with Dunnett’s test. (I) Quantification of fluorescence intensity changes for cAMPr in the VNC axons at 2 hours after injection of PBS, L-lac (final con., ~100 mM sodium L-lactate + 15 mM ethyl L-lactate) or L-2HG (~100 mM disodium L-2HG + 5 mM octyl L-2HG) into control (ppk-Gal4, UAS-cAMPr) or GABA-B-R1 mutants. Data is presented as ΔF (fluorescence at 2 hours – fluorescence at 0 hour) / F0 (fluorescence at 0 hour), n = 18, 12, 12, 22, 16, 14 segments from 9, 6, 6, 11, 8, 7 larvae respectively for each genotype, two-way ANOVA with Dunnett’s test. (J) GABA-B receptor activation by L-lactate, L-2HG and SKF97541 (agonist for GABA-B receptor) at a concentration range from 0.1-100 mM (L-lactate, L-2HG, see Figure S6 for SKF97541), which is revealed by 35S-GTPγS assay for G protein coupled receptors with Human recombinant GABBR1a and GABBR2. Activation by SKF97541 is defined as positive. X-axis shows as Log10. *P < 0.05, **P < 0.01, ***P < 0.001 and ns, not significant. Scale bars, 20 μm. Data are expressed as mean ± s.e.m. CA, constitutively active. See also Figure S6.
Figure 7.
Figure 7.. Local treatments with lactate stimulated regeneration of injured CST axons into the caudal spinal cord and recovery of locomotor function in adult mice.
(A and B) Timeline (A) and schematic (B) of the spinal cord injury experiment in adult mice (lactate treatment, first dose: 155 mM sodium lactate + 5 mM ethyl lactate; second dose: 300 mM sodium lactate + 20 mM ethyl lactate). (C) Camera Lucida drawings indicate BDA-labeled CST axons from all the parasagittal sections of two representative mice, one from the saline group (control) and the other from the lactate (Lac) group. Lesion center (LC) (red dotted line). (D) Quantification of CST axon fibers which were traced from all parasagittal sections of the spinal cord 0-4 mm caudal to the lesion, and is presented as the total length of CST axons from each bin box of 0.8-mm spinal cord caudal to the lesion center (n = 3 in saline, 5 in lactate, two-way ANOVA). (E) Images of parasagittal sections around the LC from the saline and lactate groups with BDA-labeled CST axons (red) and immunostaining for GFAP (green). Dorsal is up in all sections. (F) Graph indicates the locomotor BMS scores in SCI mice treated with saline or lactate (n = 5 in saline, 7 in lactate, two-way ANOVA). (G) Graph indicates grid walk errors in 2 groups of mice 5 weeks after SCI (n = 5 in saline, 7 in lactate, unpaired two-tailed Student's t-test). (H) Graph shows grasping rate of the hindpaws in two groups of mice 5 weeks after SCI (n = 5 in saline, 7 in lactate, unpaired two-tailed Student's t-test). *P < 0.05, **P < 0.01 and ***P < 0.001. Scale bars, 200 μm. Data are expressed as means ± s.e.m.

Comment in

References

    1. Adams KL, and Gallo V (2018). The diversity and disparity of the glial scar. Nat Neurosci 21, 9–15. - PMC - PubMed
    1. Alilain WJ, Horn KP, Hu H, Dick TE, and Silver J (2011). Functional regeneration of respiratory pathways after spinal cord injury. Nature 475, 196–200. - PMC - PubMed
    1. Allen AM, Neville MC, Birtles S, Croset V, Treiber CD, Waddell S, and Goodwin SF (2020). A single-cell transcriptomic atlas of the adult Drosophila ventral nerve cord. Elife 9. - PMC - PubMed
    1. Anderson MA, Burda JE, Ren Y, Ao Y, O'Shea TM, Kawaguchi R, Coppola G, Khakh BS, Deming TJ, and Sofroniew MV (2016). Astrocyte scar formation aids central nervous system axon regeneration. Nature 532, 195–200. - PMC - PubMed
    1. Anderson MA, O'Shea TM, Burda JE, Ao Y, Barlatey SF, Bernstein AM, Kim JH, James ND, Rogers A, Kato B, et al. (2018). Required growth facilitators propel axon regeneration across complete spinal cord injury. Nature 561, 396–400. - PMC - PubMed

Publication types

LinkOut - more resources