. 2020 Aug 27;23(9):101504.
doi: 10.1016/j.isci.2020.101504. eCollection 2020 Sep 25.

Activation of Cannabinoid Receptor 2 Prevents Colitis-Associated Colon Cancer through Myeloid Cell De-activation Upstream of IL-22 Production

Affiliations

Activation of Cannabinoid Receptor 2 Prevents Colitis-Associated Colon Cancer through Myeloid Cell De-activation Upstream of IL-22 Production

William Becker et al. iScience. .

Abstract

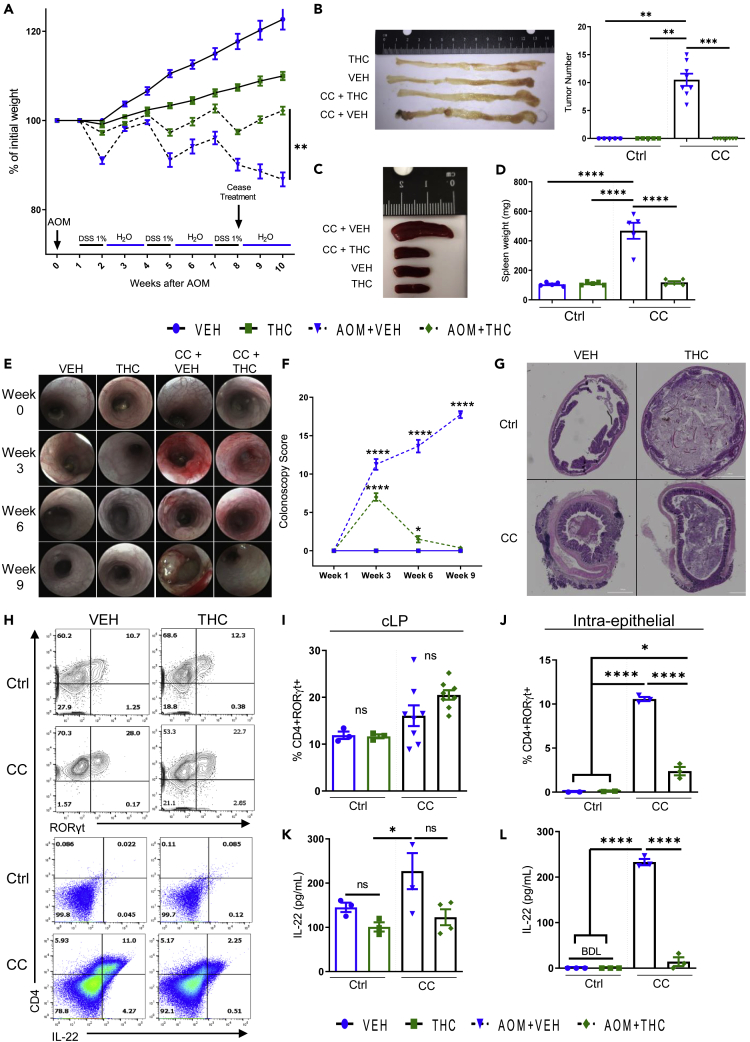
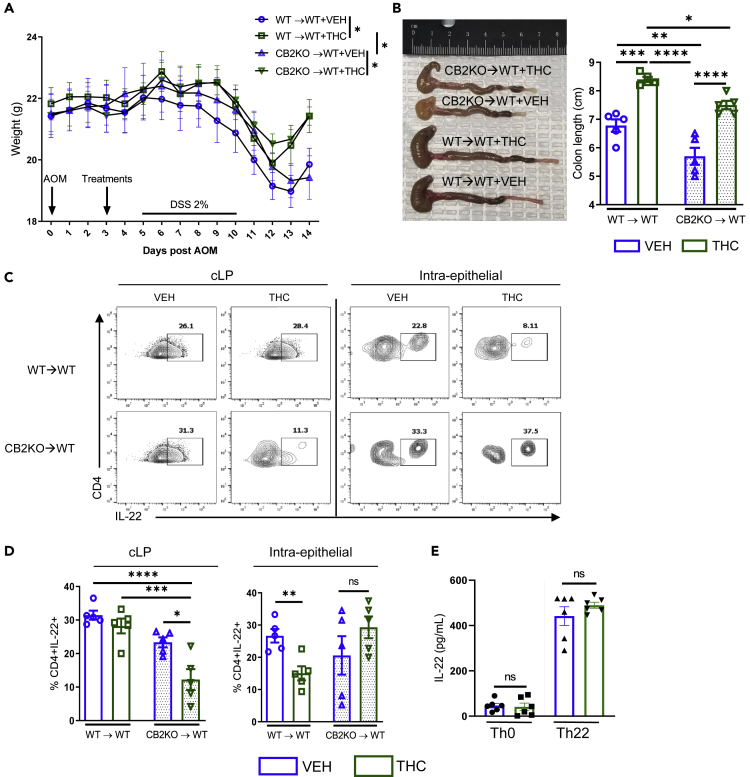
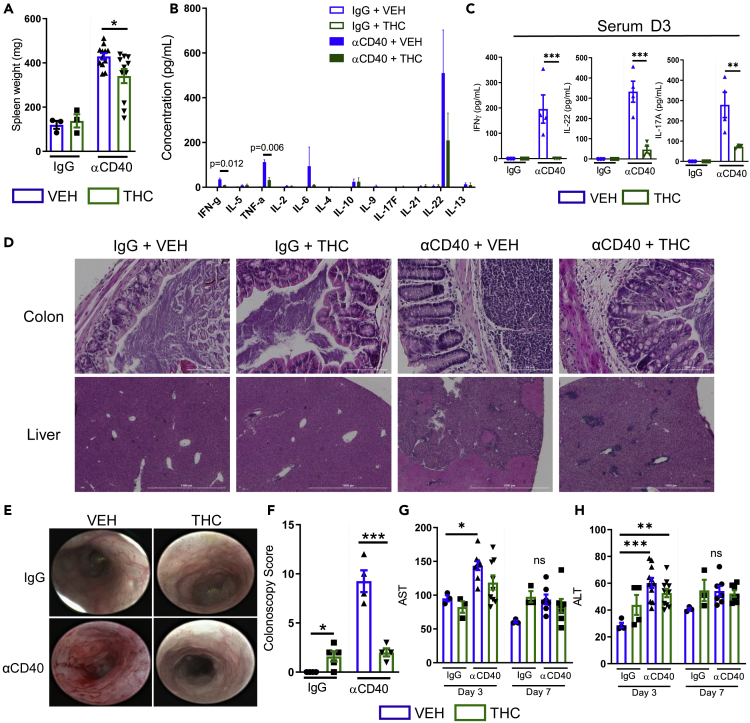
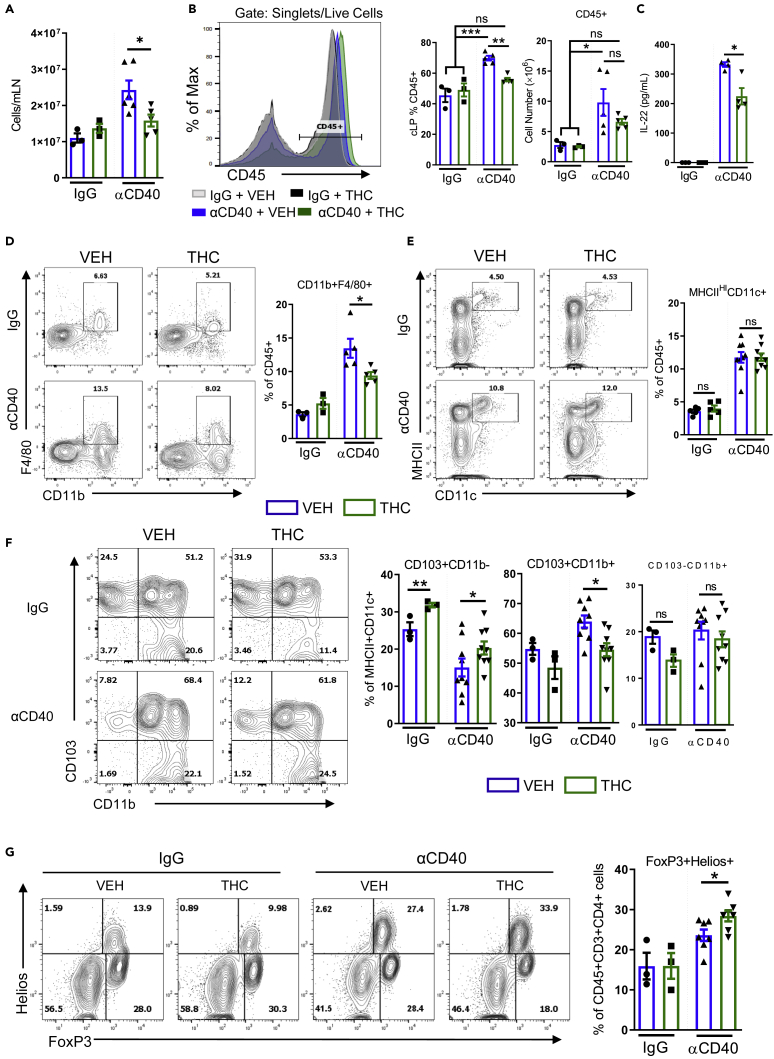
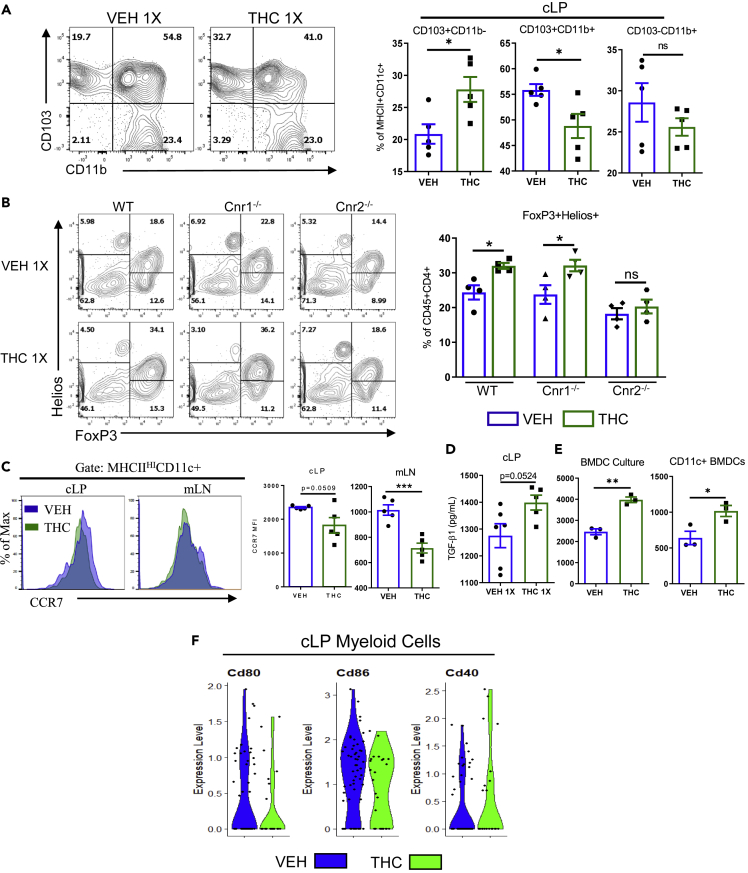
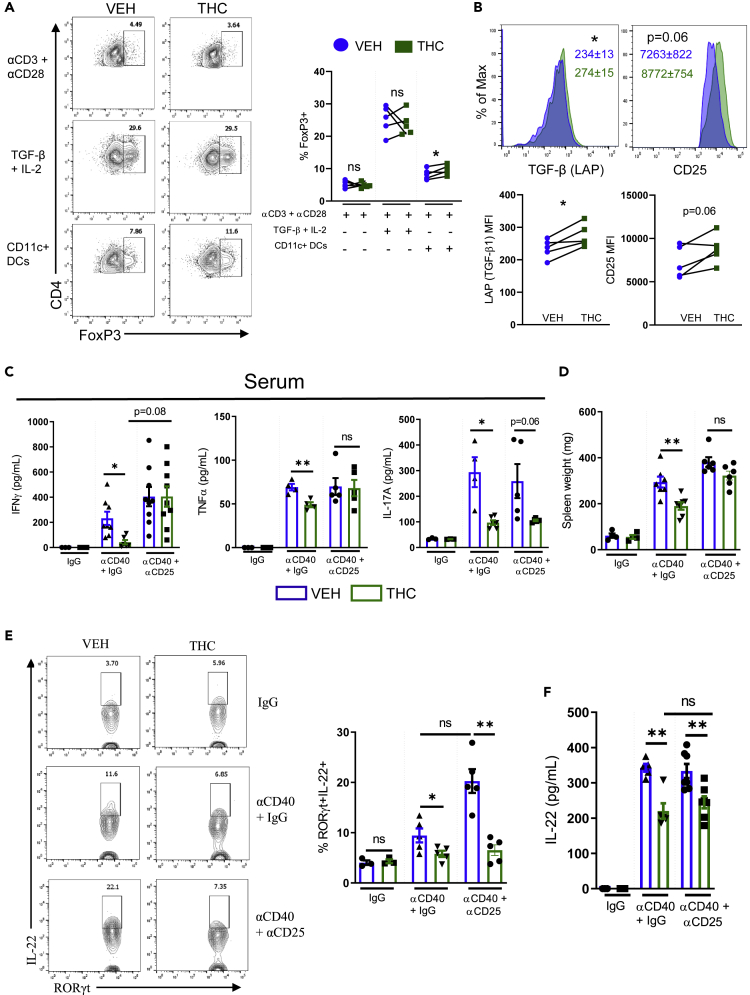
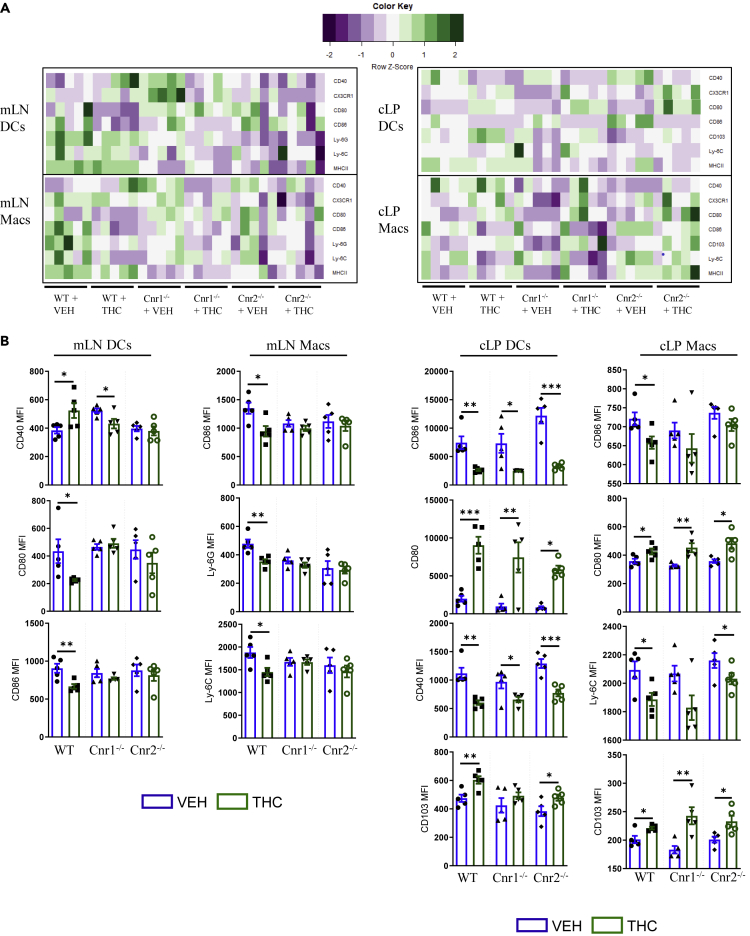
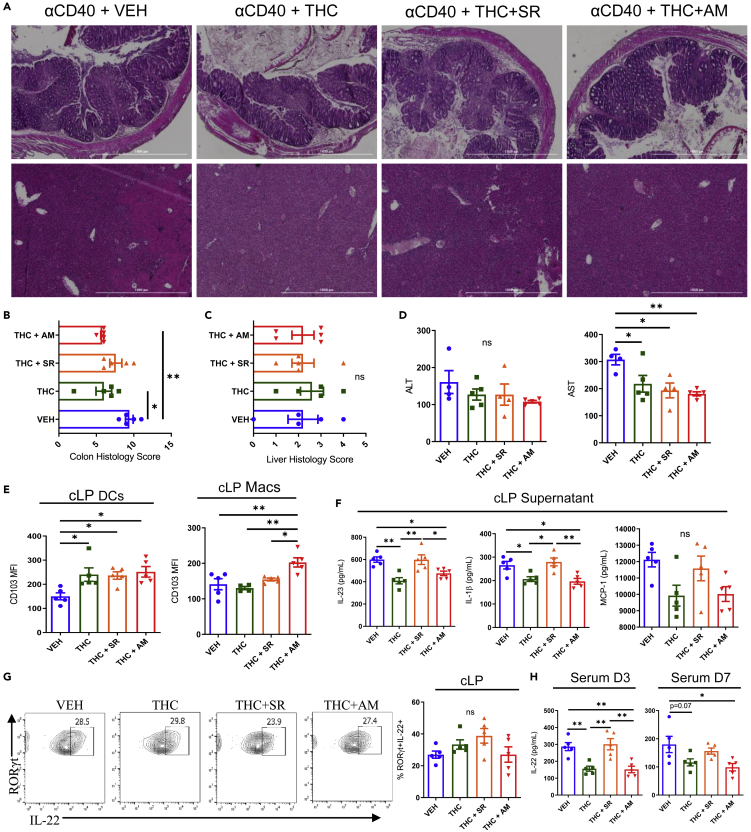
Intestinal disequilibrium leads to inflammatory bowel disease (IBD), and chronic inflammation predisposes to oncogenesis. Antigen-presenting dendritic cells (DCs) and macrophages can tip the equilibrium toward tolerance or pathology. Here we show that delta-9-tetrahydrocannabinol (THC) attenuates colitis-associated colon cancer and colitis induced by anti-CD40. Working through cannabinoid receptor 2 (CB2), THC increases CD103 expression on DCs and macrophages and upregulates TGF-β1 to increase T regulatory cells (Tregs). THC-induced Tregs are necessary to remedy systemic IFNγ and TNFα caused by anti-CD40, but CB2-mediated suppression of APCs by THC quenches pathogenic release of IL-22 and IL-17A in the colon. By examining tissues from multiple sites, we confirmed that THC affects DCs, especially in mucosal barrier sites in the colon and lungs, to reduce DC CD86. Using models of colitis and systemic inflammation we show that THC, through CB2, is a potent suppressor of aberrant immune responses by provoking coordination between APCs and Tregs.

Keywords: Cancer; Immunology.


Conflict of interest statement

The authors have declared that no conflicts of interest exist.

Figures

None
Graphical abstract
Figure 1
Figure 1
Cannabinoid Receptor Activation Stems the Progression of Colitis-Induced Colon Cancer by Reducing IL-22 Production in the Epithelial Microenvironment To induce colitis-associated colon cancer (CC), mice were given a single injection of AOM, i.p. (10 mg/kg), then 1 week later treatment started concurrently with the induction of the first cycle of colitis with 2% DSS in the drinking water. Weeklong cycles of DSS (2%) were followed by 2 weeks of regular drinking water for 3 cycles lasting 9 weeks. Treatment with VEH (10% EtOH in PBS-Tween-80), THC (10 mg/kg), or a combination of THC and CBD (10 mg/kg, both) was given twice a week until the last DSS cycle was completed, and then treatments were halted to monitor the effects of cannabinoids on induction of cancer, not the direct effects of the cannabinoids on cancer itself. Control mice were treated twice weekly, but disease was not induced (ctrl). (A) Diagram showing percent weight change, treatment schedule, and disease course. (n = 5, ctrl groups; n = 7–9 CC groups). (B) Representative photograph and number of tumors in each colon at sacrifice. Data are from one experiment representative of two independent experiments and presented as mean ± SEM; ∗∗p < 0.01, ∗∗∗p < 0.001 by Kruskal-Wallis test with a Dunn's multiple comparisons test. (C and D) (C) Representative photograph and (D) quantification of spleen weights from indicated mice at sacrifice. (E and F) Colonoscopies were performed throughout the experiment, and representative images are shown in (E) and quantified in (F) (n = 5–8, ctrl groups; n = 8 CC groups). (G) Representative H&E images of colons at sacrifice. cLP and intra-epithelial cell fraction (IEC) was isolated at sacrifice and stained for CD4+ RORγt+ and CD4+ IL-22+ cells. (H) Representative contour plots displaying CD4+ RORγt+ Th17 cells (gate: Live, CD45+ CD3+ CD4+) in the cLP (top two panels) and CD4+ IL-22+ Th22 cells (gate: Live, CD45+ CD3+) in the IEC fraction (bottom two panels). (I and J) Quantification of percentages from flow cytometry plots in (H), deriving from the (I) clP and (J) IEC (n = 3, ctrl groups; n = 3–8, CC groups). (K and L) 1 × 10⁶ cells deriving from the (K) cLP or (L) IEC layers from indicated groups were plated overnight, supernatants were collected, and subjected to ELISAs for IL-22 (n = 3–4). Each symbol represents an individual mouse. Data are from one experiment representative of two independent experiments and presented as mean ± SEM NS, not significant: ∗p < 0.05, ∗∗p < 0.01, ∗∗∗p < 0.001, ∗∗∗∗p < 0.0001 by two-way ANOVA with Tukey's multiple comparisons test.
Figure 2
Figure 2
Hematopoietic and Non-hematopoietic Cells Contribute to THC-Mediated Colitis Protection, but Hematopoietic Cells Are Necessary for Reducing IL-22 Production WT mice were myeloablated via two doses of 600 cGy separated by 3 h, then immune reconstitution was accomplished by transfer of bone marrow cells from WT (WT → WT) or Cnr2−/−, CB2 knockout (CB2 → WT) mice. (A) Body weight throughout disease course (n = 4–5). (B) Colon lengths at termination of the experiment. (C and D) (C) Representative contour plots displaying CD4+ IL-22+ Th22 cells (gate: Live, CD45+ CD3+) in the cLP IEC fraction. (D) Quantification of CD4+ IL-22-expressing cells in the colonic lamina propria and epithelial fractions (n = 4–5). (E) Naive CD4+ T cells were isolated from individual mice and plated under Th0- or Th22-polarizing conditions with VEH or THC (10μM) for 3 days. Supernatants were collected and subjected to ELISA for IL-22 (n = 6). Each symbol represents an individual mouse. Data are from one experiment representative of two independent experiments and presented as mean ± SEM; NS, not significant; ∗p < 0.05, ∗∗p < 0.01, ∗∗∗p < 0.001, ∗∗∗∗p < 0.0001 by two-way ANOVA with Tukey's multiple comparisons test.
Figure 3
Figure 3
THC Treatment Reduces Colonic and Systemic Inflammatory Severity Induced by αCD40 Mice were pre-treated daily with VEH or THC (10 mg/kg) for 3 days before intraperitoneal injection of rat anti-mouse IgG (control) or rat anti-mouse αCD40 (200 μg, clone FGK4.5 in PBS) and treatment was continued for 7 days post-disease induction to monitor progression of inflammatory severity. (A) Spleen weight (n = 3–10). (B) On day 3, blood was collected via retro-orbital bleed and serum was separated and subjected to Legendplex assay for serum T helper cytokine levels (n = 3 per group). (C) ELISAs for IFNγ, IL-22, and IL-17A from serum collected at day 3 from mice that received treatment or VEH 3 days before disease induction. (D) Representative H&E images of colons (upper row, 20X) and livers (bottom row, 4X). (E and F) (E) Representative images from colonoscopies performed on day 3 and their quantification (F) (n = 4 per group). (G and H) Quantification of (G) AST and (H) ALT activity levels measured from serum at day 3 and day 7 post αCD40 injection. Each symbol represents an individual mouse. Data are from one experiment representative of four independent experiments and presented as mean ± SEM. NS, not significant; ∗p < 0.05, ∗∗p < 0.01, ∗∗∗p < 0.005 by two-way ANOVA with Tukey's multiple comparisons test.
Figure 4
Figure 4
THC Treatment Reduces Colonic Inflammatory Cell Infiltrate and Increases Lamina Propria Tregs (A) Absolute mesenteric lymph node cell number (n = 3–6). (B) Representative flow cytometry overlaid histograms, percentages, and absolute cell number of CD45+ cells from the colonic lamina propria of indicated mice. (C) ELISA results for IL-22 from cLP supernatants recovered from indicated mice on day 7 (n = 3–4). (D–F) (D) Representative flow cytometry contour plots of macrophages (gate: Live, CD45+) (n = 3–5), (E) dendritic cells (gate: Live, CD45+) (n = 5–8), and (F) cLP dendritic cell subsets on day 7 (gate: Live, CD45+ MHCIIHICD11c+) (n = 3–9). (G) Representative flow cytometry contour plots of n- and iTregs in the cLP (gate: Live, CD45+ CD3+ CD4+) (n = 3–8). Each symbol represents an individual mouse. Data are from one experiment representative of four independent experiments and presented as mean ± SEM. ns, not significant: ∗p < 0.05, ∗∗p < 0.01, ∗∗∗p < 0.005 by two-way ANOVA with Tukey's multiple comparisons test.
Figure 5
Figure 5
CB2 Activation on Dendritic Cells Reduces Activation Markers and Increases TGF-β1 Production Naive mice were administered VEH or THC (10 mg/kg) once, and 24 h later cLP and mLN were harvested. (A) Representative flow cytometry contour plots of dendritic cell subsets in the cLP. (B) Flow cytometry contour plots displaying FoxP3+ Helios+ nTregs and FoxP3+ Helios- iTregs (gate: Live, CD45+ CD4+) (n = 4). (C) Representative flow cytometry-overlaid histograms and median fluorescence intensity (MFI) of CCR7 expression in DCs from indicated mice in the cLP or mLN (n = 5). (D and E) (D) Total TGF-β1 levels from the supernatants of cLP cells deriving from mice treated with VEH or THC for 24 h (n = 5–6) and (E) BMDCs treated with VEH or THC after 7 days of culture with treatment, or after 1 day of culture after CD11c+ cell selection (n = 3). Each symbol represents an individual mouse. Data are from one experiment representative of two independent experiments and presented as mean ± SEM. NS, not significant: ∗p < 0.05, ∗∗p < 0.01, ∗∗∗p < 0.005 by two-way ANOVA with Tukey's multiple comparisons test. (F) scRNA-seq violin plot of indicated mRNA expression in the myeloid cell cluster from the colon of mice treated with VEH or THC for 24 h.
Figure 6
Figure 6
THC Induces Tregs through DCs to Reduce Systemic but Not Colonic Inflammation Lymph nodes and spleens were harvested from naive mice, and CD4+ T cells and CD11c+ APCs were selected via magnetic bead purification. Purified CD4+ T cells were plated for 5 days under conditions of T cell stimulation: (αCD3 + αCD28), Treg polarization: (αCD3 + αCD28 + IL-2 + TGF-β1), or with purified CD11c+ cells at a ratio of 5:1, CD4+:CD11c+, and then samples from individual mice were treated with either VEH or THC (10 μM). (A) Flow cytometry contour plots and quantification of CD4+ FoxP3+ Tregs (gate: Live, CD4+) after 5 days of culture under indicated conditions (n = 5). (B) Representative overlaid histograms of indicated markers from THC- or VEH-treated CD4+ T cells after Treg polarization (gate: Live, CD4+ FoxP3+) (n = 5). Each symbol represents a paired comparison from a single mouse whose cells were split up into VEH or THC treatment. Data are from one experiment representative of two independent experiments and presented as mean ± SEM. NS, not significant: ∗p < 0.05, ∗∗p < 0.01 by Student's t test. 10 days before disease induction Treg were depleted via i.p. injection of rat anti-mouse CD25 (clone PC61, 250 μg/mouse) or isotype control. Mice were pre-treated with VEH or THC (10 mg/kg) for 2 days before disease induction by i.p. injection of αCD40 or IgG control. (C) ELISA for serum cytokines IFNγ, TNFα, and IL-17A (n = 3–6). (D) Spleen weights at end of experiment (n = 3–6). (E) Representative flow cytometry contour plots and quantification of IL-22-secreting ILC3s (gate: Live, Lineage-CD45INTCD90.2HICD3- RORγt+) (n = 3–6). (F) ELISA results for IL-22 from cLP supernatants recovered from indicated mice on day 7 (n = 3–5). Each symbol represents an individual mouse. Data are presented as mean ± SEM from one experiment that was repeated 3 times. NS, not significant: ∗p < 0.05, ∗∗p < 0.01 by two-way ANOVA with Tukey's multiple comparisons test.
Figure 7
Figure 7
THC Reduces APC Activation Markers through Cannabinoid Receptors Naive age and sex-matched WT, Cnr1−/−, and Cnr2−/− mice were euthanized and colonic lamina propria (cLP), mesenteric lymph nodes (mLNs), spleens (spl), livers, lungs, and brain were brought to a single-cell suspension and then treated ex vivo with either VEH or THC (10 μM) for 18 h before being analyzed for markers of antigen-presenting cell (APC) activation by flow cytometry. (A) Heatmap of median fluorescence intensities of (in descending order) CD40, CX3CR1, CD80, CD86, Ly-6G, Ly-6C, and MHCII on macrophages and dendritic cells from tissues deriving from WT, Cnr1−/−, or Cnr2−/− mice treated with VEH or THC. Heatmap intensity was normalized per row/marker of interest. (B) Quantification of flow cytometry results (n = 5). Each symbol represents a different mouse. Data are from one experiment representative of two independent experiments and presented as mean ± SEM. ∗p < 0.05, ∗∗p < 0.01, ∗∗∗p < 0.005 by two-way ANOVA with Tukey's multiple comparisons test.
Figure 8
Figure 8
Cannabinoid Receptor 2 Activation on Myeloid Cells Mediates Colonic Resistance to αCD40-Induced Inflammation SCID mice were injected with rat anti-mouse αCD40 (200 μg, clone FGK4.5 in PBS) and received VEH, THC (10 mg/kg), THC+ SR144528 (THC+ SR, 10 mg/kg, both), or THC+ AM251 (THC + AM, 10 mg/kg, both) daily for 7 days. (A) Representative H&E images of colons (upper row, 4X) and livers (lower row, 4X) from indicated mice. (B and C) (B) Histological scoring of colon and (C) liver H&E images (n = 5). (D) ALT and AST activities were measured from the serum of indicated mice at termination of the experiment (n = 5). (E) Median fluorescence intensity of CD103 on DCs and macrophages from the cLP of SCID mice given αCD40 and VEH or THC ± CB antagonists (n = 5). (F) ELISA for cLP supernatant cytokines IL-23, IL-1β, and MCP-1 (n = 5). (G) Flow cytometric contour plots of RORγt+ IL-22+ ILC3s in the cLP of indicated mice at termination of the experiment (n = 5). (H) ELISA for serum cytokine IL-22 at days 3 and 7 (n = 5). Each symbol represents a different mouse. Data are from one experiment representative of two independent experiments and presented as mean ± SEM. ∗p < 0.05, ∗∗p < 0.01 by two-way ANOVA with Tukey's multiple comparisons test.

References

    1. Ambrose T., Simmons A. Cannabis, cannabinoids, and the endocannabinoid system-is there therapeutic potential for inflammatory bowel disease? J. Crohns Colitis. 2019;13:525–535. - PMC - PubMed
    1. Brand S., Beigel F., Olszak T., Zitzmann K., Eichhorst S.T., Otte J.M., Diepolder H., Marquardt A., Jagla W., Popp A. IL-22 is increased in active Crohn’s disease and promotes proinflammatory gene expression and intestinal epithelial cell migration. Am. J. Physiol. Gastrointest. Liver Physiol. 2006;290:G827–G838. - PubMed
    1. Bauché D., Joyce-Shaikh B., Jain R., Grein J., Ku K.S., Blumenschein W.M., Ganal-Vonarburg S.C., Wilson D.C., McClanahan T.K., Malefyt R.d.W. LAG3+ regulatory T cells restrain interleukin-23-producing CX3CR1+ gut-resident macrophages during group 3 innate lymphoid cell-driven colitis. Immunity. 2018;49:342–352.e5. - PubMed
    1. Barthels C., Ogrinc A., Steyer V., Meier S., Simon F., Wimmer M., Blutke A., Straub T., Strobl U.Z., Lutgens E. CD40-signalling abrogates induction of RORγt+ Treg cells by intestinal CD103+ DCs and causes fatal colitis. Nat. Commun. 2017;8:14715. - PMC - PubMed
    1. Coward S., Clement F., Benchimol E.I., Bernstein C.N., Avina-Zubieta J.A., Bitton A., Carroll M.W., Hazlewood G., Jacobson K., Jelinski S. Past and future burden of inflammatory bowel diseases based on modeling of population-based data. Gastroenterology. 2019;156:1345–1353.e4. - PubMed