. 2020 Sep 17;20(1):1415.
doi: 10.1186/s12889-020-09502-x.

Trends in the incidence of diabetes mellitus: results from the Global Burden of Disease Study 2017 and implications for diabetes mellitus prevention

Affiliations

Trends in the incidence of diabetes mellitus: results from the Global Burden of Disease Study 2017 and implications for diabetes mellitus prevention

Jinli Liu et al. BMC Public Health. .

Abstract

Backgroud: Diabetes mellitus is a common chronic disease and a severe public health issue. The incidence trends for type 1 diabetes (TIDM) and type 2 diabetes (T2DM) have rarely been studied on a global scale. We aimed to determine the temporal and geographical trends of diabetes globally.

Methods: Data on diabetes mellitus, including incidence, prevalence from 1990 to 2017 were obtained from the 2017 Global Burden of Disease study. We calculated the estimated annual percentage changes (EAPCs) in age-standardized incidence rate (ASIR) of diabetes mellitus according to sex, region, and disease type.

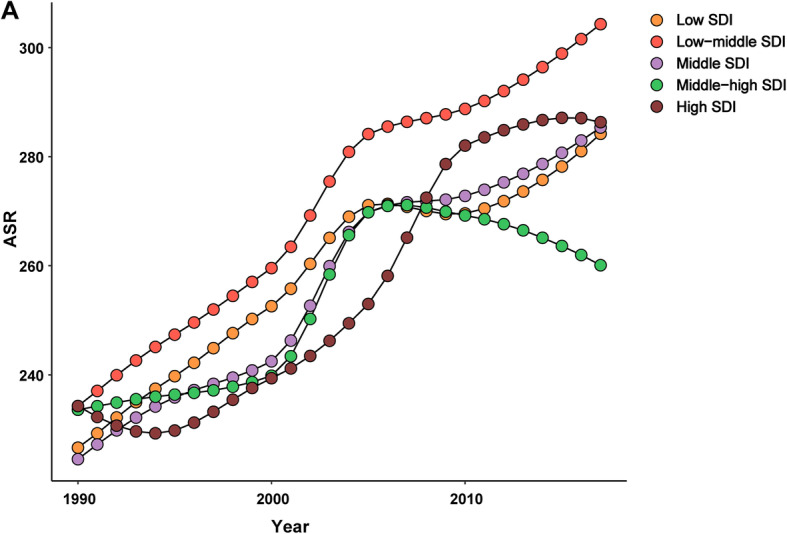
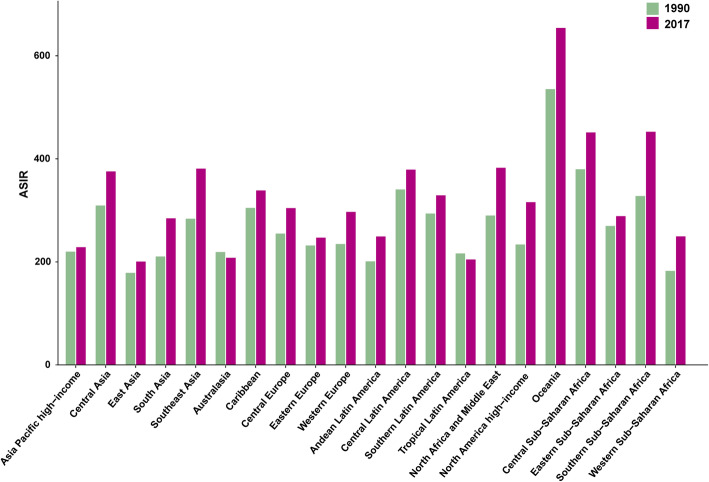
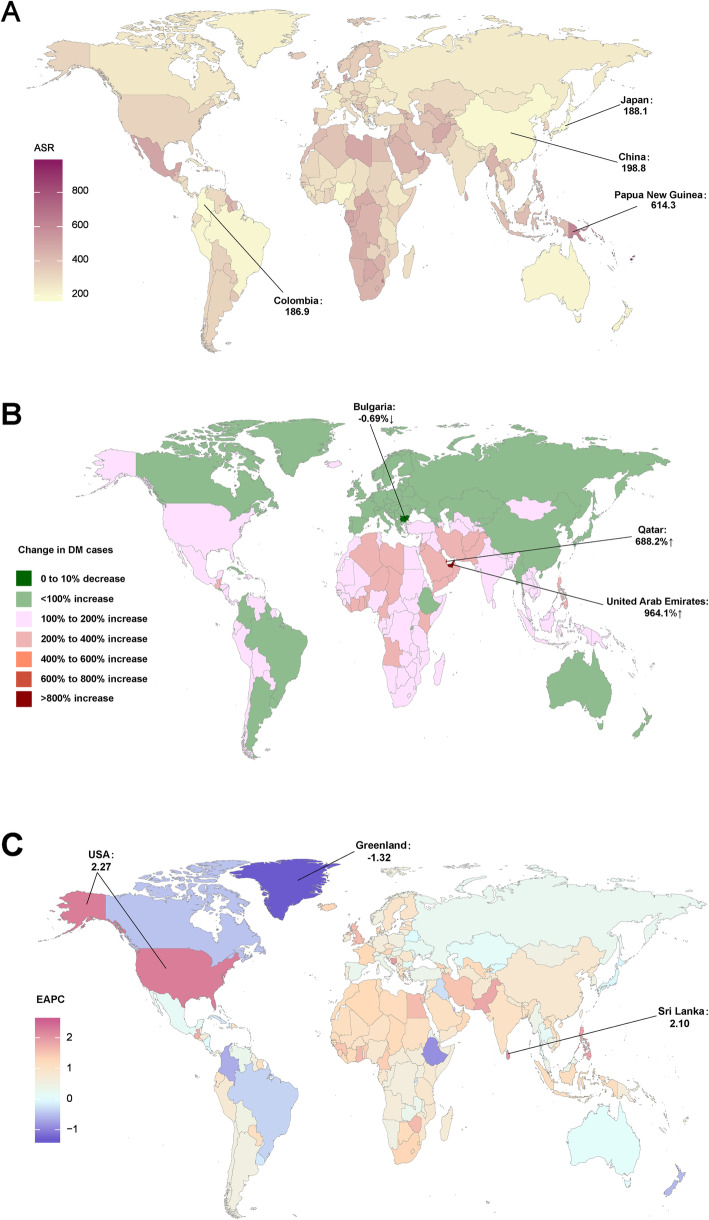
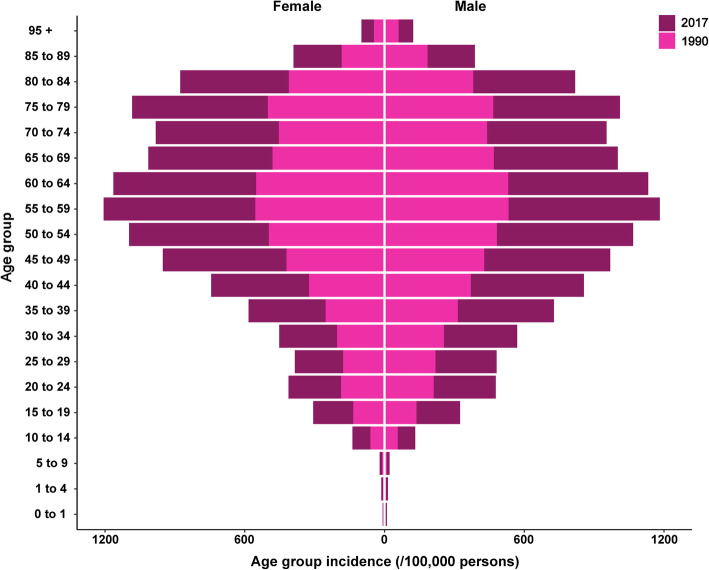
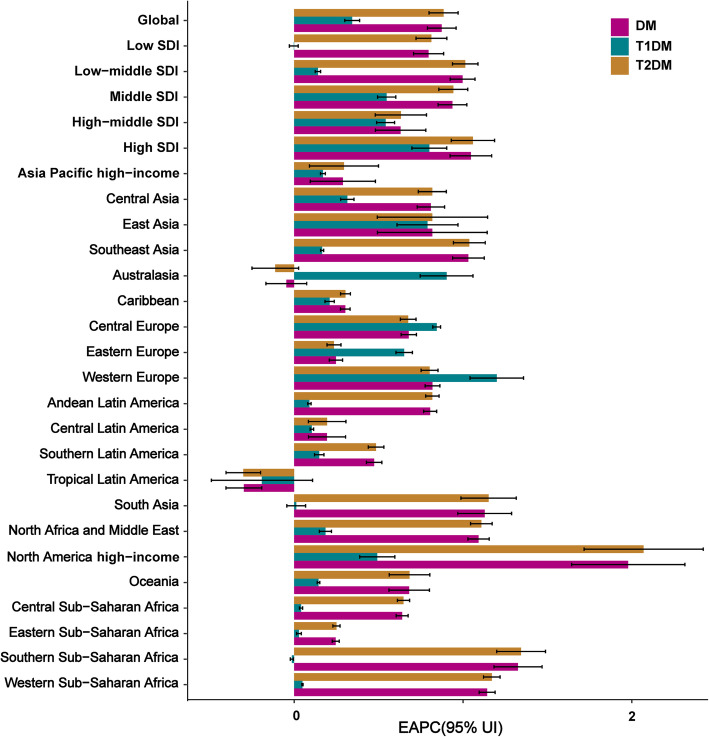
Results: The worldwide incident cases of diabetes mellitus has increased by 102.9% from 11,303,084 cases in 1990 to 22,935,630 cases in 2017 worldwide, while the ASIR increased from 234 /100,000 persons (95% UI, 219-249) to 285/100,000 persons (95% UI, 262-310) in this period [EAPC = 0.87, 95% confidence interval (CI):0.79-0.96]. The global ASIRs of T1DM and T2DM both demonstrated significant increase during 1990-2017, with EAPCs of 0.34 (95% CI,0.30-0.39) and 0.89 (95% CI,0.80-0.97), respectively. The ASIR trends also varied considerably by regions and countries. The increase in ASIR was greatest in high sociodemographic index regions (EAPC = 1.05, 95% CI:0.92-1.17) and lowest in low-SDI regions (EAPC = 0.79, 95% CI:0.71-0.88).

Conclusions: Both the number of incident cases and ASIR of diabetes mellitus increased significantly during 1990-2017 worldwide, but the temporal trends varied markedly across regions and countries.

Keywords: Global diabetes mellitus; Incidence; Prevention; Trends.


Conflict of interest statement

The authors declare that they have no competing interests.

Figures

Fig. 1
Fig. 1
The ASIR of diabetes mellitus caused by SDI regions, from 1990 to 2017. The data from five SDI regions are presented in the top-right panel. (ASIR, age-standardized incidence rate; SDI, socio-demographic index)
Fig. 2
Fig. 2
The ASIR of diabetes mellitus at a regional level. The left column in each group is case data in 1990 and the right column in 2017. Those data from certain regions can be viewed in the top-right of the panel (ASIR, age-standardized incidence rate)
Fig. 3
Fig. 3
The global disease burden of diabetes mellitus for both sexes in 194 countries and territories. (a) The ASIR of diabetes mellitus in 2017; (b) The relative change in incident cases of diabetes mellitus between 1990 and 2017; (c) The EAPC of diabetes mellitus ASIR from 1990 to 2017. Countries with an extreme number of cases/evolution were annotated. ASIR, age-standardized incidence rate; EAPC, estimated annual percentage change (The maps were drawn by authors according to the corresponding data)
Fig. 4
Fig. 4
The age group incidence (per 100,000 persons) of diabetes mellitus by sex in 1990 and 2017
Fig. 5
Fig. 5
The EAPCs of diabetes mellitus (type 1 diabetes and type 2 diabetes) ASIR from 1990 to 2017 at global, regional, and national level
Fig. 6
Fig. 6
The correlation between EAPCs and human development index in 2017 at the national level. The circles represent countries that were available on HDI data. The size of the circle is increased with the incident cases of diabetes mellitus. The ρ indices and p values presented were derived from Pearson correlation analysis. EAPC, estimated annual percentage change; HDI, human development index

Similar articles

Cited by

References

    1. Geiss LS, Pan L, Cadwell B, Gregg EW, Benjamin SM, Engelgau MM. Changes in incidence of diabetes in U.S. adults, 1997-2003. Am J Prev Med. 2006;30(5):371–377. doi: 10.1016/j.amepre.2005.12.009. - DOI - PubMed
    1. Amos AF, McCarty DJ, Zimmet P. The rising global burden of diabetes and its complications: estimates and projections to the year 2010. Diabet Med. 1997;14(Suppl 5):S1–85. - PubMed
    1. Patterson CC, Dahlquist GG, Gyürüs E, Green A, Soltész G. Incidence trends for childhood type 1 diabetes in Europe during 1989-2003 and predicted new cases 2005-20: a multicentre prospective registration study. Lancet. 2009;373(9680):2027–2033. doi: 10.1016/S0140-6736(09)60568-7. - DOI - PubMed
    1. Berhan Y, Waernbaum I, Lind T, Möllsten A, Dahlquist G. Thirty years of prospective nationwide incidence of childhood type 1 diabetes: the accelerating increase by time tends to level off in Sweden. Diabetes. 2011;60(2):577–581. doi: 10.2337/db10-0813. - DOI - PMC - PubMed
    1. Patterson CC, Gyürüs E, Rosenbauer J, et al. Trends in childhood type 1 diabetes incidence in Europe during 1989-2008:evidence of non-uniformity over time in rates of increase. Diabetologia. 2012;55(8):2142–2147. doi: 10.1007/s00125-012-2571-8. - DOI - PubMed