

Influence of obesity on remodeling of lung tissue and organization of extracellular matrix after blunt thorax trauma
- PMID: 32943048
- PMCID: PMC7496205
- DOI: 10.1186/s12931-020-01502-0
Influence of obesity on remodeling of lung tissue and organization of extracellular matrix after blunt thorax trauma
Abstract
Background: Previously, it has been shown that obesity is a risk factor for recovery, regeneration, and tissue repair after blunt trauma and can affect the rate of muscle recovery and collagen deposition after trauma. To date, lung tissue regeneration and extracellular matrix regulation in obese mice after injury has not been investigated in detail yet.
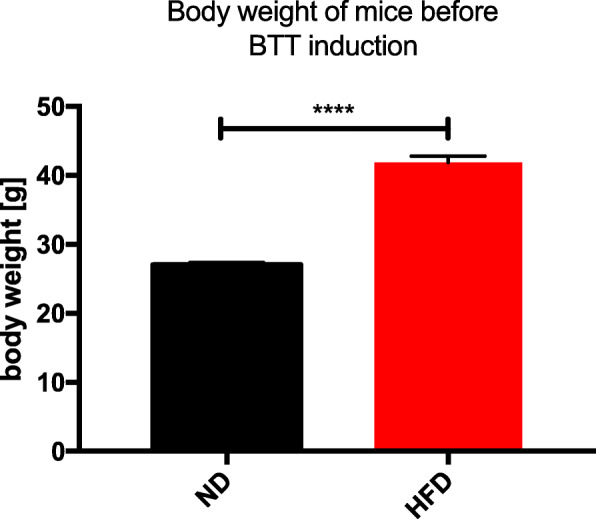
Methods: This study uses an established blunt thorax trauma model to analyze morphological changes and alterations on gene and protein level in lean or obese (diet-induced obesity for 16 ± 1 week) male C57BL/6 J mice at various time-points after trauma induction (1 h, 6 h, 24 h, 72 h and 192 h).
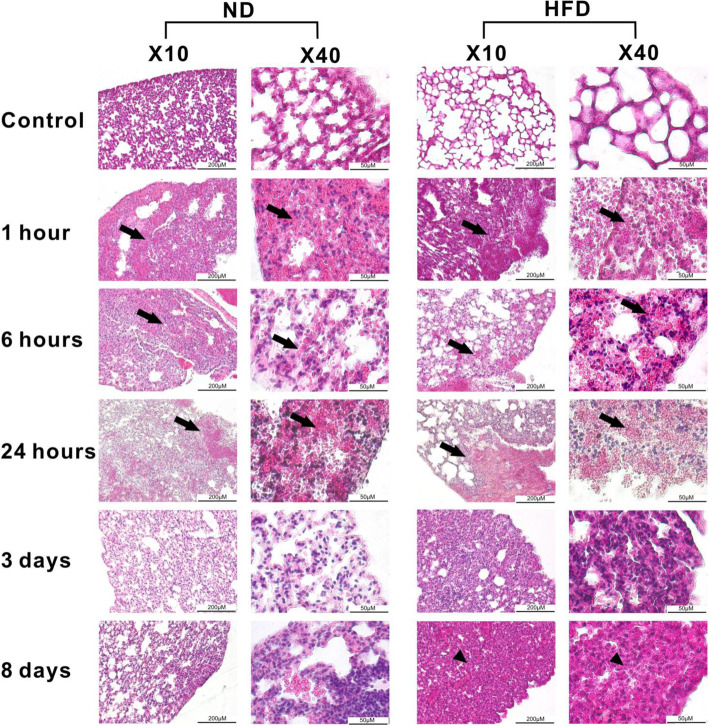
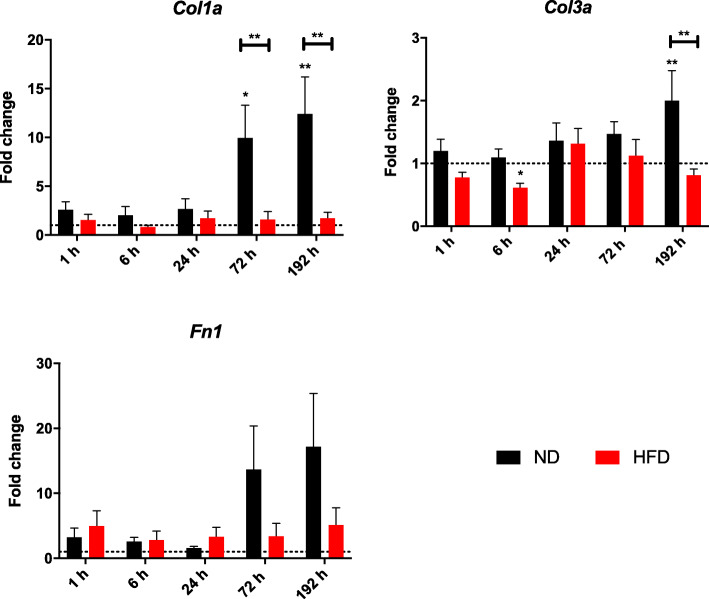
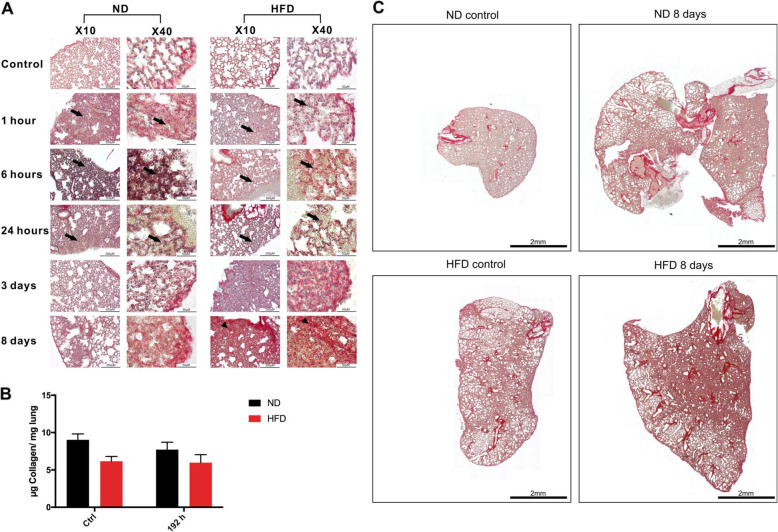
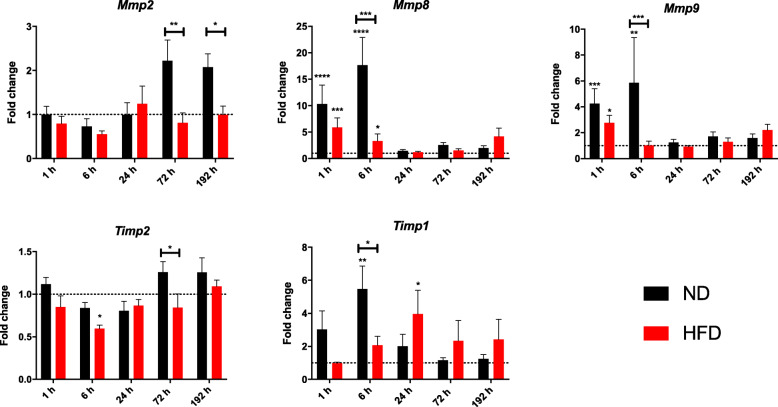
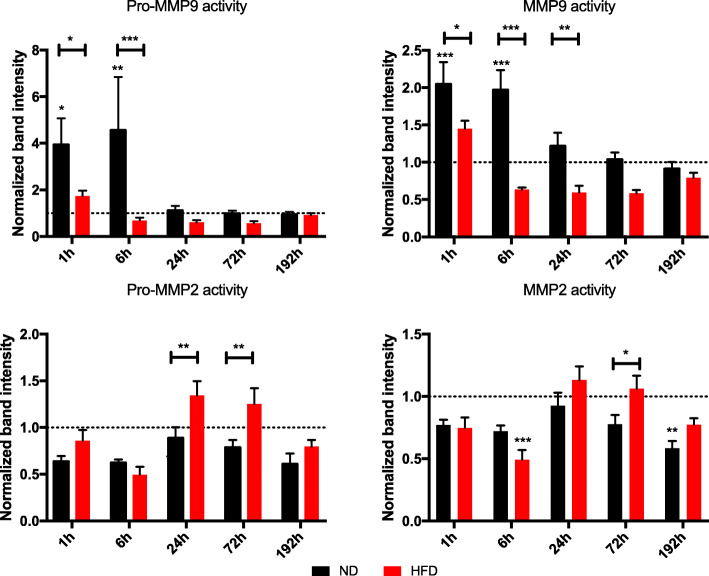
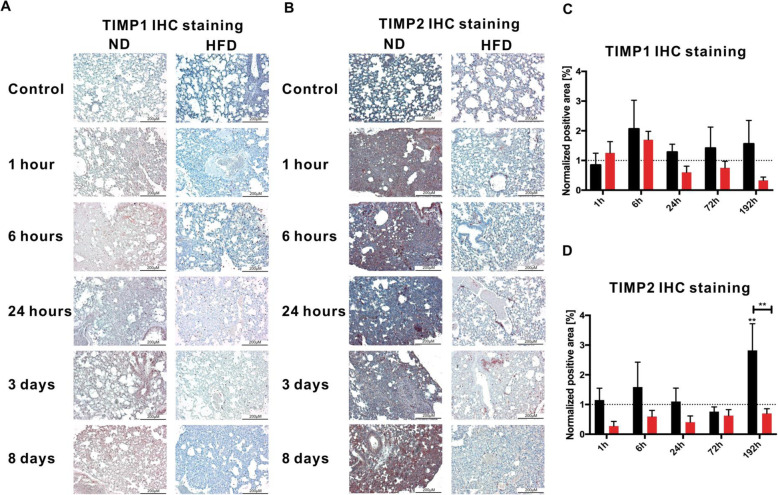
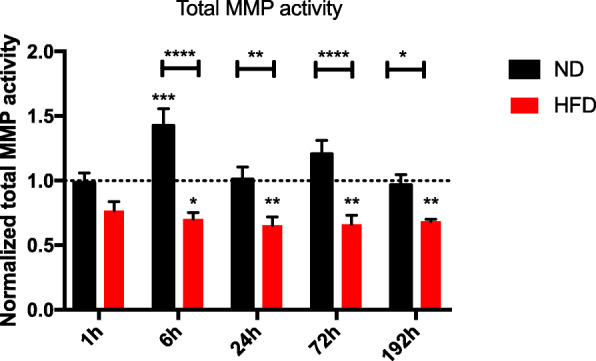
Results: Morphological analysis after injury showed lung parenchyma damage at early time-points in both lean and obese mice. At later time-points a better regenerative capacity of lean mice was observed, since obese animals still exhibited alveoli collapse, wall thickness as well as remaining filled alveoli structures. Although lean mice showed significantly increased collagen and fibronectin gene levels, analysis of collagen deposition showed no difference based on colorimetric quantification of collagen and visual assessment of Sirius red staining. When investigating the organization of the ECM on gene level, a decreased response of obese mice after trauma regarding extracellular matrix composition and organization was detectable. Differences in the lung tissue between the diets regarding early responding MMPs (MMP8/9) and late responding MMPs (MMP2) could be observed on gene and protein level. Obese mice show differences in regulation of extracellular matrix components compared to normal weight mice, which results in a decreased total MMP activity in obese animals during the whole regeneration phase. Starting at 6 h post traumatic injury, lean mice show a 50% increase in total MMP activity compared to control animals, while MMP activity in obese mice drops to 50%.
Conclusions: In conclusion, abnormal regulation of the levels of extracellular matrix genes in the lung may contribute to an aberrant regeneration after trauma induction with a delay of repair and pathological changes of the lung tissue in obese mice.
Keywords: Collagen; Extracellular matrix (ECM); High fat diet; MMP activity; Obesity; TIMP production; Thorax trauma.
Conflict of interest statement
All authors declare that they have no competing interests.
Figures
Similar articles
-
Influence of Obesity on the Organization of the Extracellular Matrix and Satellite Cell Functions After Combined Muscle and Thorax Trauma in C57BL/6J Mice.Front Physiol. 2020 Jul 28;11:849. doi: 10.3389/fphys.2020.00849. eCollection 2020. Front Physiol. 2020. PMID: 32848828 Free PMC article.
-
Role of metalloproteinases and TNF-α in obesity-associated asthma in mice.Life Sci. 2020 Oct 15;259:118191. doi: 10.1016/j.lfs.2020.118191. Epub 2020 Aug 7. Life Sci. 2020. PMID: 32777302
-
Diet-Induced Obesity Affects Muscle Regeneration After Murine Blunt Muscle Trauma-A Broad Spectrum Analysis.Front Physiol. 2018 Jun 5;9:674. doi: 10.3389/fphys.2018.00674. eCollection 2018. Front Physiol. 2018. PMID: 29922174 Free PMC article.
-
Remodeling and Fibrosis of the Cardiac Muscle in the Course of Obesity-Pathogenesis and Involvement of the Extracellular Matrix.Int J Mol Sci. 2022 Apr 11;23(8):4195. doi: 10.3390/ijms23084195. Int J Mol Sci. 2022. PMID: 35457013 Free PMC article. Review.
-
Blunt chest trauma: soft tissue injury in the thorax.Br J Hosp Med (Lond). 2016 Feb;77(2):78-83. doi: 10.12968/hmed.2016.77.2.78. Br J Hosp Med (Lond). 2016. PMID: 26875800 Review.
Cited by
-
Obesity Prolongs the Inflammatory Response in Mice After Severe Trauma and Attenuates the Splenic Response to the Inflammatory Reflex.Front Immunol. 2021 Nov 15;12:745132. doi: 10.3389/fimmu.2021.745132. eCollection 2021. Front Immunol. 2021. PMID: 34867969 Free PMC article.
-
Total Flavonoids of Rhizoma Drynariae Restore the MMP/TIMP Balance in Models of Osteoarthritis by Inhibiting the Activation of the NF-κB and PI3K/AKT Pathways.Evid Based Complement Alternat Med. 2021 Apr 19;2021:6634837. doi: 10.1155/2021/6634837. eCollection 2021. Evid Based Complement Alternat Med. 2021. PMID: 33995548 Free PMC article.
-
A serological biomarker of type I collagen degradation is related to a more severe, high neutrophilic, obese asthma subtype.Asthma Res Pract. 2022 Apr 13;8(1):2. doi: 10.1186/s40733-022-00084-6. Asthma Res Pract. 2022. PMID: 35418159 Free PMC article.
-
Elevated MMP-8 levels, inversely associated with BMI, predict mortality in mechanically ventilated patients: an observational multicenter study.Crit Care. 2023 Jul 18;27(1):290. doi: 10.1186/s13054-023-04579-3. Crit Care. 2023. PMID: 37464428 Free PMC article.
-
Dedicator of Cytokinesis 2 (DOCK2) Deficiency Attenuates Lung Injury Associated with Chronic High-Fat and High-Fructose Diet-Induced Obesity.Am J Pathol. 2022 Feb;192(2):226-238. doi: 10.1016/j.ajpath.2021.10.011. Epub 2021 Nov 10. Am J Pathol. 2022. PMID: 34767813 Free PMC article.
References
MeSH terms
Grants and funding
LinkOut - more resources
Full Text Sources
Medical
Research Materials
Miscellaneous
