Observational Study
. 2020 Sep 17;5(51):eabd6197.
doi: 10.1126/sciimmunol.abd6197.

Longitudinal immune profiling reveals key myeloid signatures associated with COVID-19

Collaborators, Affiliations
Observational Study

Longitudinal immune profiling reveals key myeloid signatures associated with COVID-19

Elizabeth R Mann et al. Sci Immunol. .

Abstract

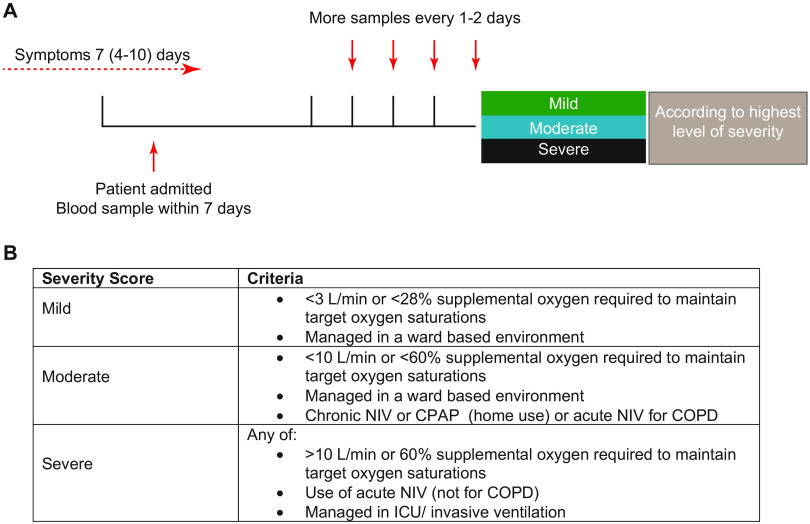
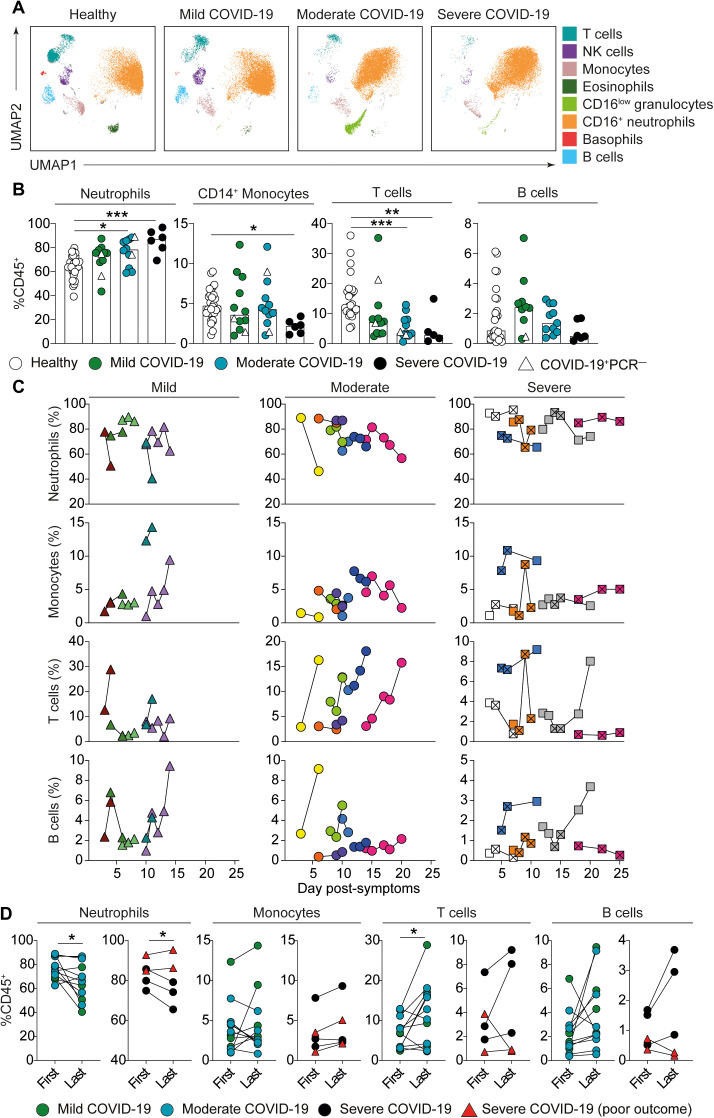
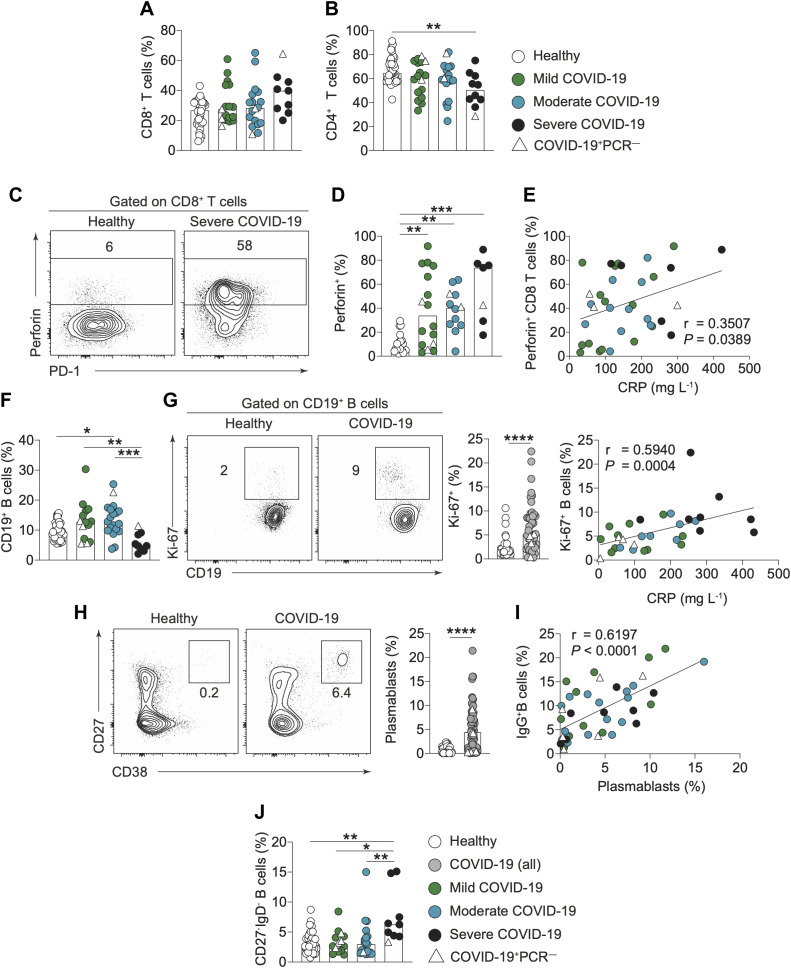
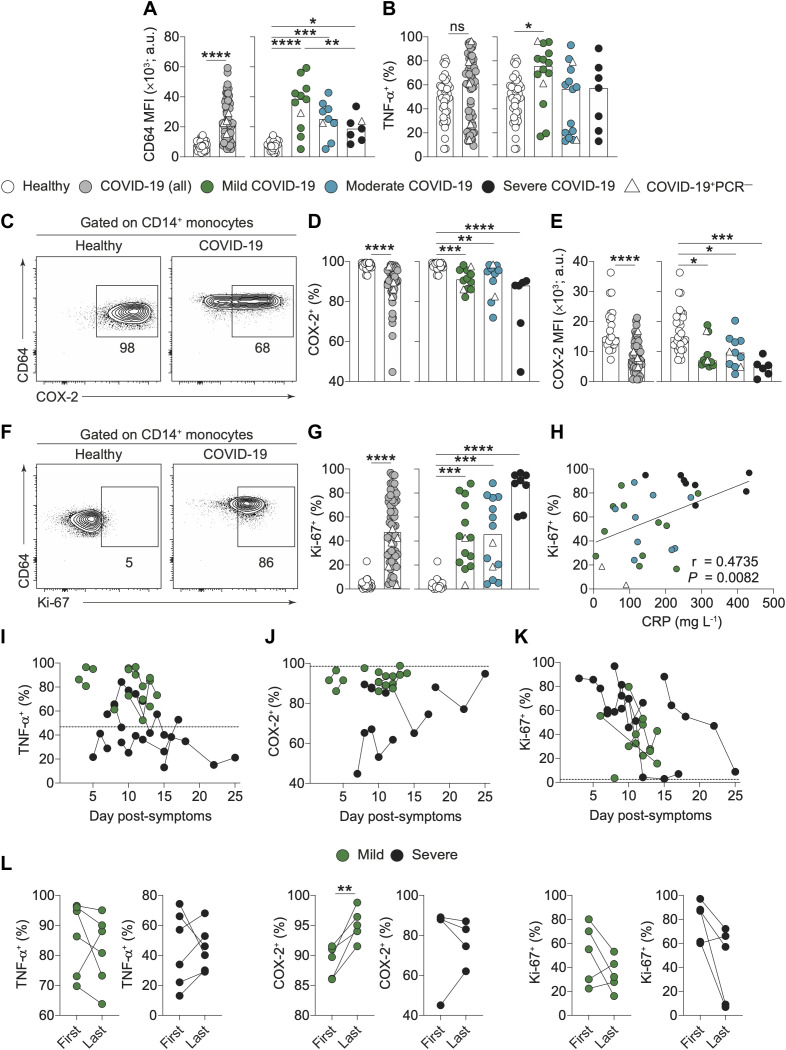
COVID-19 pathogenesis is associated with an exaggerated immune response. However, the specific cellular mediators and inflammatory components driving diverse clinical disease outcomes remain poorly understood. We undertook longitudinal immune profiling on both whole blood and peripheral blood mononuclear cells (PBMCs) of hospitalized patients during the peak of the COVID-19 pandemic in the UK. Here, we report key immune signatures present shortly after hospital admission that were associated with the severity of COVID-19. Immune signatures were related to shifts in neutrophil to T cell ratio, elevated serum IL-6, MCP-1 and IP-10, and most strikingly, modulation of CD14+ monocyte phenotype and function. Modified features of CD14+ monocytes included poor induction of the prostaglandin-producing enzyme, COX-2, as well as enhanced expression of the cell cycle marker Ki-67. Longitudinal analysis revealed reversion of some immune features back to the healthy median level in patients with a good eventual outcome. These findings identify previously unappreciated alterations in the innate immune compartment of COVID-19 patients and lend support to the idea that therapeutic strategies targeting release of myeloid cells from bone marrow should be considered in this disease. Moreover, they demonstrate that features of an exaggerated immune response are present early after hospital admission suggesting immune-modulating therapies would be most beneficial at early timepoints.


Figures

Fig. 1
Fig. 1
Patient recruitment and categorization. (A) Patients were recruited to the study as close to admission as possible and within 7 days. Peripheral blood samples were collected on recruitment and at intervals thereafter. Samples were analyzed immediately and results stratified based on their ultimate disease severity. (B) Criteria for patient stratification. NIV, non-invasive ventilation; CPAP, continuous positive airway pressure; ICU, intensive care unit.
Fig. 2
Fig. 2
Whole blood immune profile of COVID-19 patients. (A) Uniform Manifold Approximation and Projection (UMAP) of flow cytometry panel broadly visualizing white cells in whole blood. Representative images for healthy individuals, mild, moderate and severe patients are shown. Key indicates cells identified on the image. (B) Graphs show neutrophil (CD16+CD11bhi), CD14+ monocyte, CD3+ T cell, and CD19+ B cell frequencies in whole blood samples of healthy individuals (n=28) and recruitment samples from COVID-19 patients with mild (n=12), moderate (n=13) and severe (n=6) disease. (C) Longitudinal time course of (top row) neutrophils (CD16+CD11bhi), (2nd row) CD14+ monocytes, (3rd row) CD3+ T cells and (bottom row) B cells segregated by disease severity. Individual patients are shown as different colors and shapes with lines connecting data from the same patient. Crossed squares for severe patients are time points in intensive care unit (ICU). X axis values represent the number of days since reported onset of symptoms. (D) Graphs showing frequencies of neutrophils (CD16+CD11bhi), monocytes, T cells and B cells at the first and last time points in (left) mild/moderate patients (green and blue circles) and (right) severe patients (black circles). Red triangles represent severe patients that had poor outcome (deceased or long-term ICU) and are not included in the statistical test. Graphs show individual patient data with the bar representing median values. In all graphs, open triangles represent SARS-CoV-2 PCR negative patients. Kruskal Wallis with Dunn’s post-hoc test; 2B Neutrophils, T cells and B cells. One-way ANOVA with Holm-Sidak post-hoc test: 2B Monocytes. Paired t-test; 2D all except monocyte graph detailing mild and moderate patients which was tested using Wilcoxon matched-pairs signed rank test. (*P<0.05, **P<0.01, ***P<0.001, ****P<0.0001).
Fig. 3
Fig. 3
Altered phenotype of T and B cells in COVID-19 patients. (A,B) Graphs show frequencies of (A) CD8+ and (B) CD4+ T cells in freshly isolated PBMCs of healthy individuals (n=36) and recruitment samples from COVID-19 patients with mild (n=17), moderate (n=18) and severe (n=9-10) disease. (C,D) Representative flow cytometry plots and graph showing frequency of CD8+ T cells which are positive for perforin in healthy individuals (n=21 and COVID-19 patients with mild (n=16), moderate (n=12) and severe (n=7) disease. (E) Graph showing correlation of perforin+ CD8+ T cell frequency with C-reactive protein (CRP) in COVID-19 patients. (F) Graphs show frequencies of CD19+ B cells in freshly isolated PBMCs of healthy individuals (n=43) and recruitment samples from COVID-19 patients with mild (n=14), moderate (n=19) and severe (n=9) disease. (G) Representative flow cytometry plots and cumulative data show Ki-67 expression by B cells in healthy individuals (n=39) and COVID-19 patients (n=45). Correlation graph shows correlation of Ki-67+ B cells with C-reactive protein (CRP). (H) Representative flow cytometry plots and cumulative data show frequency of CD27hiCD38hi plasmablasts in healthy individuals (n=42) and COVID-19 patients (n=66). (I) Correlation graph shows correlation of plasmablasts and IgG+ B cell frequencies. (J) Graph shows frequencies of double negative (CD27-IgD-) B cells in freshly prepared PBMC of healthy individuals (n=42) and recruitment samples from COVID-19 patients with mild (n=14), moderate (n=19) and severe (n=9) disease. Graphs show individual patient data with the bar representing median values. In all graphs, open triangles represent SARS-CoV-2 PCR negative patients. Mann-Whitney U test; 3G, 3H. Kruskal Wallis with Dunn’s post-hoc test; 3A, 3D, 3F, 3J. One-way ANOVA with Holm-Sidak post-hoc test: 3B. Spearman ranked coefficient correlation test; 3E, 3G, 3I. (*P<0.05, **P<0.01, ***P<0.001, ****P<0.0001).
Fig. 4
Fig. 4
Dysregulation of circulating monocytes in COVID-19. (A) Graphs show levels of CD64 expression as assessed by mean fluorescence intensity (MFI) on CD14+ classical monocytes in freshly prepared PBMC of healthy individuals (n=25) and recruitment samples from all COVID-19 patients (n=58). COVID-19 patients were also stratified into mild (n=12), moderate (n=10) and severe (n=8) disease. (B) Graphs show frequencies of TNF-ɑ+ CD14+ monocytes following LPS stimulation of freshly prepared PBMC from healthy individuals (n=41) and COVID-19 patients (n=59). COVID-19 patients were also stratified into mild (n=14), moderate (n=15) and severe (n=7) disease. (C) Representative FACS plots demonstrating intracellular COX2 expression by CD14+ monocytes from healthy individuals and COVID-19 patients. (D, E) Graphs showing (D) frequencies of COX-2+ CD14+ monocytes and (E) COX-2 expression level as determined by MFI in CD14+ monocytes following LPS stimulation of freshly prepared PBMC from healthy individuals (n=33) and total COVID-19 patients (n=51). COVID-19 patients were also stratified into mild (n=12), moderate (n=11) and severe (n=6) disease. (F) Representative FACS plots demonstrating intracellular Ki-67 staining by CD14+ monocytes. (G) Graphs show frequencies of Ki-67+ CD14+ monocytes following LPS stimulation of freshly prepared PBMC from healthy individuals (n=37) and total COVID-19 patients (n=60). COVID-19 patients were also stratified into mild (n=14), moderate (n=14) and severe (n=8) disease. (H) Correlation of Ki-67 (% of monocytes expressing Ki-67) with CRP in COVID-19 patients. (I-K) Longitudinal time course of frequencies of CD14+ monocytes that are positive for (I) TNF-α, (J) COX2 and (K) Ki-67 following LPS stimulation in mild (green shapes, n=6-7) and severe (black shapes, n=4-6) COVID-19 patients with lines connecting data from the same patient. On all graphs x axis values represent the number of days since onset of symptoms and the dotted line represents the median value from healthy individuals. (L) Graphs showing frequencies of monocytes which are TNF-α+, COX-2 and Ki-67+ following LPS stimulation at the first and last time points in (left) mild patients (green circles) and (right) severe patients (black circles). Graphs show individual patient data with the bar representing median values. In all graphs, open triangles represent SARS-CoV-2 PCR negative patients. Mann-Whitney U test; 4A, 4B. 4D, 4E, 4G. Kruskal Wallis with Dunn’s post-hoc test; 4B, 4D, 4E, 4G. One-way ANOVA with Holm-Sidak post-hoc test:.4A. Spearman ranked coefficient correlation test; 4H. Paired t-test; 4L. (*P<0.05, **P<0.01, ***P<0.001, ****P<0.0001).

Similar articles

Cited by

References

    1. Tay M. Z., Poh C. M., Rénia L., MacAry P. A., Ng L. F. P., The trinity of COVID-19: Immunity, inflammation and intervention. Nat. Rev. Immunol. 20, 363–374 (2020). 10.1038/s41577-020-0311-8 - DOI - PMC - PubMed
    1. Zhou P., Yang X.-L., Wang X.-G., Hu B., Zhang L., Zhang W., Si H.-R., Zhu Y., Li B., Huang C.-L., Chen H.-D., Chen J., Luo Y., Guo H., Jiang R.-D., Liu M.-Q., Chen Y., Shen X.-R., Wang X., Zheng X.-S., Zhao K., Chen Q.-J., Deng F., Liu L.-L., Yan B., Zhan F.-X., Wang Y.-Y., Xiao G.-F., Shi Z.-L., A pneumonia outbreak associated with a new coronavirus of probable bat origin. Nature 579, 270–273 (2020). 10.1038/s41586-020-2012-7 - DOI - PMC - PubMed
    1. Boettcher S., Manz M. G., Regulation of Inflammation- and Infection-Driven Hematopoiesis. Trends Immunol. 38, 345–357 (2017). 10.1016/j.it.2017.01.004 - DOI - PubMed
    1. Mehta P., McAuley D. F., Brown M., Sanchez E., Tattersall R. S., Manson J. J.; HLH Across Speciality Collaboration, UK , COVID-19: Consider cytokine storm syndromes and immunosuppression. Lancet 395, 1033–1034 (2020). 10.1016/S0140-6736(20)30628-0 - DOI - PMC - PubMed
    1. Wu F., Zhao S., Yu B., Chen Y.-M., Wang W., Song Z.-G., Hu Y., Tao Z.-W., Tian J.-H., Pei Y.-Y., Yuan M.-L., Zhang Y.-L., Dai F.-H., Liu Y., Wang Q.-M., Zheng J.-J., Xu L., Holmes E. C., Zhang Y.-Z., A new coronavirus associated with human respiratory disease in China. Nature 579, 265–269 (2020). 10.1038/s41586-020-2008-3 - DOI - PMC - PubMed

Publication types

MeSH terms