Comparative Study
. 2020 Sep 18;369(6510):eaba7667.
doi: 10.1126/science.aba7667.

Species-specific pace of development is associated with differences in protein stability

Affiliations
Comparative Study

Species-specific pace of development is associated with differences in protein stability

Teresa Rayon et al. Science. .

Abstract

Although many molecular mechanisms controlling developmental processes are evolutionarily conserved, the speed at which the embryo develops can vary substantially between species. For example, the same genetic program, comprising sequential changes in transcriptional states, governs the differentiation of motor neurons in mouse and human, but the tempo at which it operates differs between species. Using in vitro directed differentiation of embryonic stem cells to motor neurons, we show that the program runs more than twice as fast in mouse as in human. This is not due to differences in signaling, nor the genomic sequence of genes or their regulatory elements. Instead, there is an approximately two-fold increase in protein stability and cell cycle duration in human cells compared with mouse cells. This can account for the slower pace of human development and suggests that differences in protein turnover play a role in interspecies differences in developmental tempo.


Conflict of interest statement

Competing Interests

The authors declare no competing or financial interests.

Figures

Figure 1
Figure 1. Comparison of neural tube development in mouse and human embryos.
(A) Schema of mouse and human neural tube development (B-D). Immunofluorescence in transverse sections of mouse and human cervical neural tube from E9.0 to E11.5 in mouse and CS11 to CS17 in human embryos. (B) Expression of progenitor markers PAX6 (green), OLIG2 (magenta) and NKX2.2 (cyan). (C) Pan-neural progenitor marker SOX2 (blue), motor neuron markers ISL1 (magenta) and HB9/MNX1 (cyan) at neurogenic stages. (D) Ventral expression of gliogenic markers NFIA (red) and SOX9 (blue) in the neural tube can be detected from E10.5 in mouse and CS15 in human. NFIA also labels neurons, as indicated by TUBB3 (cyan) staining. Scale bars = 50 microns.
Figure 2
Figure 2. A global scaling factor for in vitro differentiation of mouse and human MNs.
(A) Schema of mouse ESCs differentiated to MNs. Spinal cord progenitors generated via an NMP state induced by the addition of FGF, WNT and dual SMAD inhibition signals for 24h (blue rectangle), subsequently exposed to the neuralizing signal retinoic acid (RA) and smoothened agonist (SAG) to ventralise the cells (green). (B) Schema of the analogous strategy used for human ESCs to generate MNs, where the addition of FGF, WNT and dual SMAD inhibition signals lasts 72h. (C) Expression of NP markers (PAX6, OLIG2, NKX2.2) between Days 1 and 3 in mouse MN differentiation. (D) Expression of NP markers (PAX6, OLIG2, NKX2.2) at Days 4, 6 and 8 in human MN differentiation. (E) Expression of MN markers (ISL1, HB9/MNX1) in mouse and human MNs. Mouse MNs can be detected by Days 2-3, whereas human MNs are not detected until Days 8 and 10. (F) HOXC6 expression in MNs characterized by ISL1 and TUBB3 expression at Day 3 in mouse and in human Day 10. Scale bars = 50 microns. (G) RT-qPCR analysis of Pax6, Olig2, Nkx2.2 and Isl1 expression in mouse and human differentiation reveals a conserved progression in gene expression but a different tempo (human n = 3 in triplicate, mouse n = 3 in triplicate). (H) Heatmap of RNA-seq data from mouse and human MN differentiation indicating the normalized expression of selected markers representative of neuromesodermal progenitors, neural progenitors, neurons, glia and mesoderm cell types (mouse n = 3, human n = 3). (I) Heatmap of the pair wise Pearson correlation coefficients of the transcriptomes of mouse (vertical) and human (horizontal) differentiation at the indicated time points. High positive correlation indicated by values close to 1 (red). White line shows a linear fit of the Pearson correlation with temporal scaling factor of 2.5 ± 0.2 (median ± std). (J) Scaling factor for transcriptome clusters that contain Pax6, Olig2, Nkx2.2, and Isl1. (K) Significant differences in the peak of gene expression in the RT-qPCR experiments between mouse (orange) and human (blue). (human n = 3 in triplicate, mouse n = 3 in triplicate). Two-way ANOVA with Tukey’s multiple comparison post-hoc test *** adj p-value < 0.001. (K) Time factor estimations for cluster pairs with high proportion of orthologous genes.
Figure 3
Figure 3. Dynamics of Shh signalling in mouse and human neural progenitors.
(A) Flow cytometry analysis of NKX6.1 expression in human NPs treated with the smoothened agonists SAG, purmorphamine (PM) or the two combined (both) shows a similar distribution of NKX6.1 expression at Day 2 and Day 4 (n = 3). (B) Scheme outlining the standard differentiation protocol, in which RA and SAG are added at the same time (light blue), versus a treatment where SAG addition is delayed for 24h (dark blue). (C) RT-qPCR data reveals higher expression of IRX3 when cells are treated for 24h with only RA (dark blue), whereas there are no substantial differences in the induction dynamics NKX6.1, measured from the time of SAG addition (n = 3). (D) RT-qPCR data measured at 12h intervals reveal similar gene expression dynamics in mouse (orange) and human (blue) for Gli1, but distinct for Nkx6.1 (mouse n = 6, human n = 5). (a.u., arbitrary units).
Figure 4
Figure 4. Temporal control of gene expression depends on the species cellular environment.
(A) Scatter plot with histograms of PAX6 and NKX6.1 intensity measured by FACS in NPs from wt (orange) and hChr21 (purple) mouse cells at Day 2. (B) RT-qPCR expression of Olig2 from the mouse (mOlig2) and human alleles (hOLIG2) (n = 9). (C) smFISH at Day 2 of differentiation in wt and hChr21 lines with probes for mSox2, and allele specific detection of mOlig2 or human OLIG2 (hOLIG2). Scale bars = 10 microns (D) smFISH in human NPs at Day 8 of differentiation for hSOX2 and hOLIG2. Scale bars = 50 microns. (E) Boxplots and density distributions in wt and hChr21 cells of number of mRNA molecules per cell from Sox2, total Olig2 and human- and mouse- allele specific probes. The estimated mean difference in molecule number between hChr21 cells and mouse is 25.7 [22.3; 29.7] (mouse n=323, hChr21 n=337). (F) Boxplots and density distributions of the concentration (number of mRNA molecules per area unit) of Olig2 per cell in human NPs at Day 8, and mouse wt and hChr21 cells at Day 2. The estimated mean difference is 0.121 mRNAs/μm2 [0.141; 0.101] between mouse and hChr21cells; and the mean difference is 0.157 mRNAs/μm2 [0.175; 0.139] for human and hChr21 cells. Statistical significance (*) corresponds with <0.05 overlap between the distributions of mean estimations with a p-value for a two-sided permutation t-test < 0.001.(human n = 436, mouse n = 323, hChr21 n = 337).
Figure 5
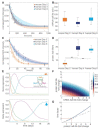
Figure 5. Protein stability in the GRN corresponds to tempo differences between species.
(A) Normalized EU incorporation measurements to estimate mRNA half-life in mouse (orange) and human (blue) neural progenitors. Line and shadowed areas show best exponential fit and its 70% High Density Interval (HDI). (mouse Day 2 n = 5, human Day 4 n = 3, human Day 8 n = 5). (B) Half-life of the transcriptome in mouse neural progenitors at Day 2 (orange), and human neural progenitors at Day 4 (dark blue) and Day 8 (light blue). (C) Normalized AHA measurements of the proteome in mouse (orange) and human (blue) neural progenitors to estimate protein stability (mouse Day 2 n = 6, human Day 4 n = 4, human Day 8 n = 4). (D) Global stability of the proteome in mouse neural progenitors at Day 2 (orange), and human neural progenitors at Day 4 (dark blue) and Day 8 (light blue). Statistical significance (**) corresponds with <0.01 overlap between the distributions of parameter estimations. (E) Temporal dynamics of the computational model of the neural tube GRN in mouse, and the predicted human behaviour, simulated by halving the decay rates of the proteins of the network. Inset diagram of the cross-repressive GRN comprising the transcription factors Pax6, Olig2, Nkx2,2 and Irx3 used to model ventral patterning of the neural tube. (F) Predicted Olig2 time factor, indicating relative change in developmental pace, produced in response to fold changes in mRNA half-life and protein half-life. Relevant fold changes in mRNA and protein correspond to those that give a time factor of 2.5 (purple). (G) Predicted Olig2 time factor as a function of the fold change in the decay rate ratio (blue solid line). The change in time factor resulting from an increase in protein half-life grows faster than linearly (dashed line). This results in a time factor larger than 2 for a fold change of 2 in protein half-life (red line).
Figure 6
Figure 6. Protein decay and cell cycle account for the speed differences between species.
(A) Normalised measurements of mouse and human NKX6.1, OLIG2, SOX1 and SOX2 from AHA pulse-chase experiments using AHA-labeled and purified proteins. Line and shadowed areas show best exponential fit and 95% confidence intervals (mouse n = 3; human n = 3 for OLIG2 and NKX6.1, n = 4 for SOX1 and SOX2). (B) Normalized intensity measurements of mKATE2 in mouse and human Ptch1::T2A-mKate2 cell lines. Line and shadowed areas show best exponential fit and 70% HDI (mouse n = 7; human n = 4). (C) Estimated half-lives for mKATE2 in mouse (orange) and human (blue) cells. (D) Cell cycle measurements of mouse neural progenitors at Day 2, and human neural progenitors at Day 4 and Day 8. Line and shadowed areas show best fit and 80% HDI (mouse n=5, human Day 4 n= 4, human Day 8 n = 5). (E) Cell cycle length estimations in mouse neural progenitors at Day 2, and human neural progenitors at Day 4 and Day 8. For all plots, mouse data is orange-colored, and human is blue. Statistical significance (**) corresponds with <0.01 overlap between the distributions of parameter estimations.

Comment in

References

    1. Toma K, Wang T-C, Hanashima C. Encoding and decoding time in neural development. Development, Growth & Differentiation. 2016;58:59–72. - PMC - PubMed
    1. Ebisuya M, Briscoe J. What does time mean in development? Development (Cambridge, England) 2018;145 dev164368. - PMC - PubMed
    1. Herculano-Houzel S. The remarkable, yet not extraordinary, human brain as a scaled-up primate brain and its associated cost. Proceedings of the National Academy of Sciences of the United States of America. 2012;109(Suppl 1):10661–8. - PMC - PubMed
    1. van den Ameele J, Tiberi L, Vanderhaeghen P, Espuny-Camacho I. Thinking out of the dish: what to learn about cortical development using pluripotent stem cells. Trends in Neurosciences. 2014;37:334–342. - PubMed
    1. Gertz CC, Lui JH, LaMonica BE, Wang X, Kriegstein AR. Diverse behaviors of outer radial glia in developing ferret and human cortex. The Journal of neurosciencer : the official journal of the Society for Neuroscience. 2014;34:2559–70. - PMC - PubMed

Publication types