. 2020 Sep 17;11(1):4698.
doi: 10.1038/s41467-020-18468-8.

SARS-CoV-2 seroprevalence and neutralizing activity in donor and patient blood

Affiliations

SARS-CoV-2 seroprevalence and neutralizing activity in donor and patient blood

Dianna L Ng et al. Nat Commun. .

Abstract

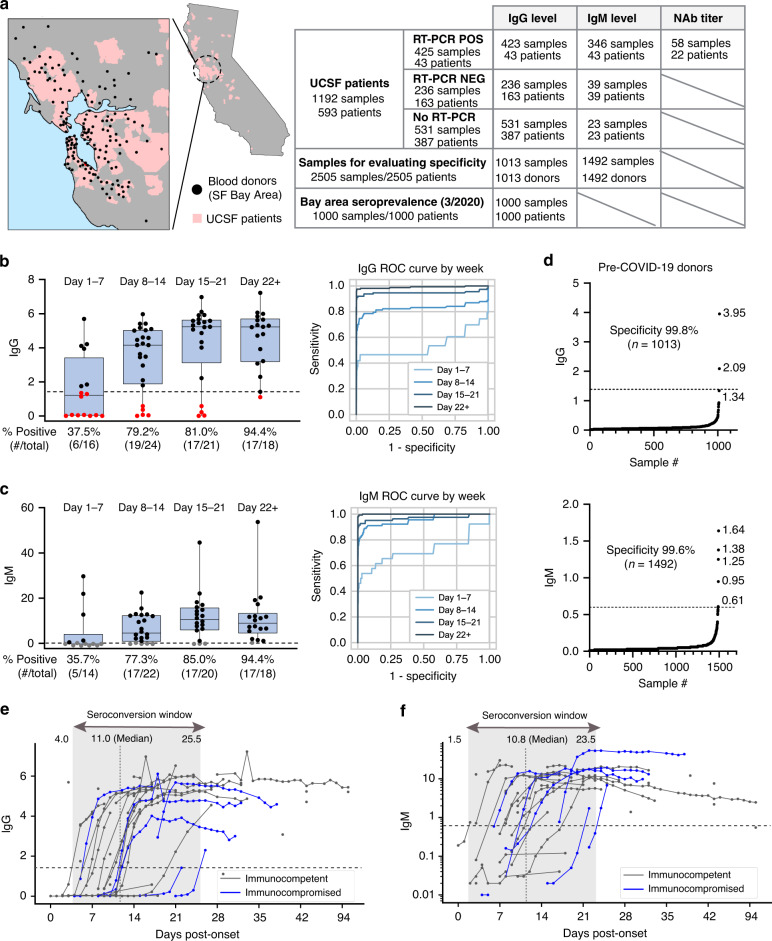
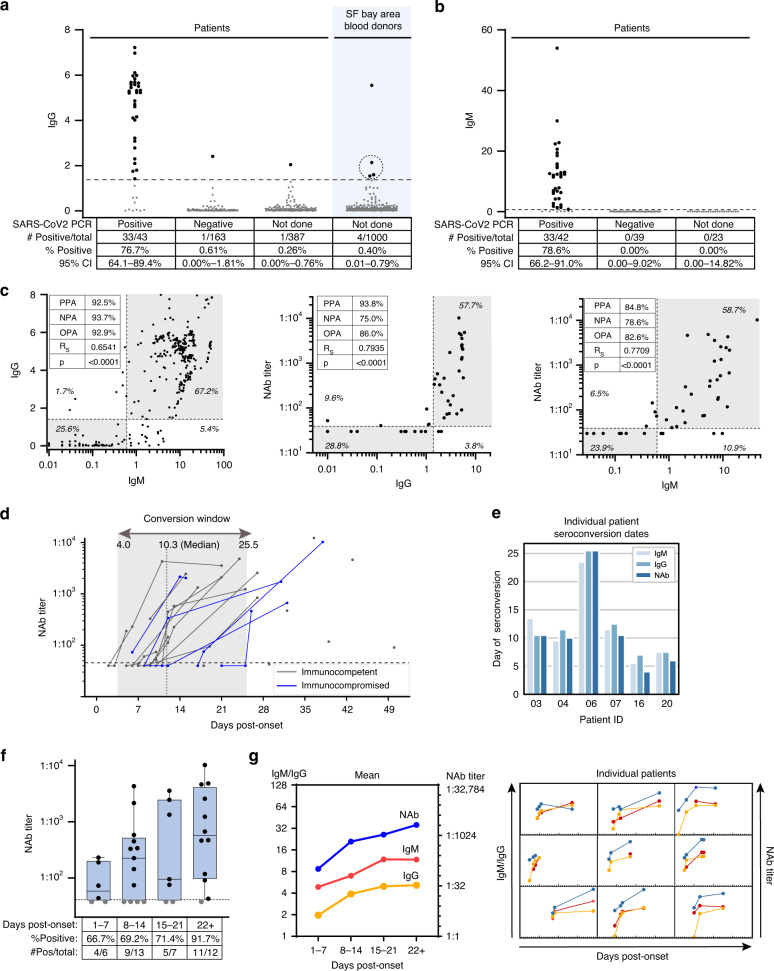
Given the limited availability of serological testing to date, the seroprevalence of SARS-CoV-2-specific antibodies in different populations has remained unclear. Here, we report very low SARS-CoV-2 seroprevalence in two San Francisco Bay Area populations. Seroreactivity was 0.26% in 387 hospitalized patients admitted for non-respiratory indications and 0.1% in 1,000 blood donors in early April 2020. We additionally describe the longitudinal dynamics of immunoglobulin-G (IgG), immunoglobulin-M (IgM), and in vitro neutralizing antibody titers in COVID-19 patients. The median time to seroconversion ranged from 10.3-11.0 days for these 3 assays. Neutralizing antibodies rose in tandem with immunoglobulin titers following symptom onset, and positive percent agreement between detection of IgG and neutralizing titers was >93%. These findings emphasize the importance of using highly accurate tests for surveillance studies in low-prevalence populations, and provide evidence that seroreactivity using SARS-CoV-2 anti-nucleocapsid protein IgG and anti-spike IgM assays are generally predictive of in vitro neutralizing capacity.


Conflict of interest statement

C.Y.C. is the director of the UCSF-Abbott Viral Diagnostics and Discovery Center (VDDC) and receives research support funding from Abbott Laboratories. J.P., M.R., K.C., S.P., and J.R.H., Jr. are employees of Abbott Laboratories. The other authors have no competing interests to declare.

Figures

Fig. 1
Fig. 1. Seroprevalence of antibodies to SARS-CoV-2.
a Schematic of testing performed and location of populations assessed. (Left) A map of California with a zoomed inset of the San Francisco Bay Area. For blood donors, the location of the blood bank collection center is denoted by a black dot; for patients at University of California, San Francisco (UCSF) hospitals and clinics, the geographic regions corresponding approximately to zip code are denoted in pink. (Right) Table showing number of patients, donors, and samples, and the testing that was performed (b) (left) IgG S/C ratios for SARS-CoV-2 PCR-positive patient samples for the indicated weekly timeframes post-onset of symptoms (if multiple samples per patient were collected, the sample with the highest S/C value within each time frame is plotted). The percent of patients with positive antibody responses measured within each timeframe is indicated below the graphs. (right) Receiver operating characteristic (ROC) curves for IgG titersx for all samples from SARS-CoV-2 PCR-positive patients within the indicated weekly time frames. AUCs for are 0.537 (day 1–7), 0.827 (day 8–14), 0.946 (day 15–21), 0.990 (day 22+). The dotted line at 1.4 indicates cutoff for IgG positivity. c IgM S/C ratios and ROC curves for IgM titers, as in b; AUCs are 0.720 (day 0–7), 0.955 (day 8–14), 0.970 (day 15–21), 0.999 (day 22+). The dotted line at 0.6 indicates cutoff for IgG positivity. Data points in black and red are above and below the indicated cutoffs, respectively. d (Top) IgG S/C ratios measured in pre-COVID samples; specificity and number of samples is indicated on graph (+). The dotted line at 1.4 indicates cutoff for IgG positivity. d (Bottom) IgM S/C ratios measured in pre-COVID samples; specificity and number of samples is indicated on graph. The dotted line at 0.6 indicates cutoff for IgM positivity. e IgG S/C ratios (n = 286 samples from 43 patients) and f IgM S/C ratios for SARS-CoV-2 PCR-positive patients (n = 249 samples from 43 patients) were plotted against day post symptom onset. Immunocompetent patients are shown in grey and immunocompromised patients are shown in blue. For patients with multiple same-day samples, the sample with the highest S/C value is plotted. For e and f, the box outlines denote the IQR, the solid line in the box denotes median S/C ratio, and the whiskers outside of the box extend to the minimum and maximum S/C ratios.
Fig. 2
Fig. 2. Longitudinal dynamics and in vitro neutralizing activity of antibodies against SARS-CoV-2.
a IgG S/C ratios were determined for hospitalized patients and outpatients and blood donors on whom SARS-CoV-2 PCR testing was positive or negative or was not performed. Numbers of seroreactive and total individuals tested are shown in tables below the graphs. The circled data points were additionally tested by the VITROS and neutralization assays and were negative by both assays. For patients with multiple samples, the single highest S/C value is plotted. b IgM S/C ratios, as in a. c (Left) IgG and IgM titers for SARS-CoV-2 PCR positive matched patient samples. Percent of data points in each quadrant and positive percent agreement (PPA), negative percent agreement (NPA), and overall percent agreement (OPA) between IgG and IgM are shown. (middle) 80% neutralization titers (NT80) plotted against IgG S/C values. (right) 80% NT80 plotted against IgM S/C values. The cutoff for NT80 is a titer level of >40; negative results (<40) are non-numeric and are plotted at 35 for visualization purposes. d NT80 titers for SARS-CoV-2 PCR-positive patients were plotted against day post symptom onset. Immunocompromised patients are shown in blue. e For the 6 SARS-CoV-2 PCR-positive patients whose IgM, IgG, and NT80 seroconversion events were captured during serial sampling, the days post-symptom onset seroconversion events are compared. f NT80 activity was evaluated per patient for the indicated time frames post onset of symptoms. The percent of patients with detectable NT80 activity measured within each time frame is indicated below the graphs. If multiple samples per patient were collected, the sample with the highest NT80 value within each time frame was used. g The average NT80 activity (right axis) and IgG and IgM (left axis) titers are plotted by day post-symptom onset (left); corresponding graphs for individual patients are shown in a 3 × 3 grid (right). If multiple samples per patient were collected, the sample with the highest S/C or NT80 value per time frame was used. For f, the box outlines denote the IQR, the solid line in the box denotes median neutralizing antibody titer, and the whiskers outside of the box extend to the minimum and maximum neutralizing antibody titers.

Update of

References

    1. Zhu N, et al. A novel coronavirus from patients with pneumonia in China, 2019. N. Engl. J. Med. 2020;382:727–733. doi: 10.1056/NEJMoa2001017. - DOI - PMC - PubMed
    1. Wu Z, McGoogan JM. Characteristics of and important lessons from the coronavirus disease 2019 (COVID-19) outbreak in China: summary of a report of 72314 cases from the Chinese center for disease control and prevention. J. Am. Med. Assoc. 2020;32:1239–1242. doi: 10.1001/jama.2020.2648. - DOI - PubMed
    1. Yang X, et al. Clinical course and outcomes of critically ill patients with SARS-CoV-2 pneumonia in Wuhan, China: a single-centered, retrospective, observational study. Lancet Respir. Med. 2020;8:475–481. doi: 10.1016/S2213-2600(20)30079-5. - DOI - PMC - PubMed
    1. Burbelo PD, et al. Sensitivity in detection of antibodies to nucleocapsid and spike proteins of severe acute respiratory syndrome coronavirus 2 in patients with coronavirus disease 2019. J. Infect. Dis. 2020;222:206–213. doi: 10.1093/infdis/jiaa273. - DOI - PMC - PubMed
    1. Okba NMA, et al. Severe acute respiratory syndrome coronavirus 2—specific antibody responses in coronavirus disease patients. Emerg. Infect. Dis. 2020;26:1478–1488. doi: 10.3201/eid2607.200841. - DOI - PMC - PubMed

Publication types

MeSH terms