. 2020 Sep 17;11(1):4654.
doi: 10.1038/s41467-020-18508-3.

Chromatin remodeling in bovine embryos indicates species-specific regulation of genome activation

Affiliations

Chromatin remodeling in bovine embryos indicates species-specific regulation of genome activation

Michelle M Halstead et al. Nat Commun. .

Abstract

The shift from maternal to embryonic control is a critical developmental milestone in preimplantation development. Widespread transcriptomic and epigenetic remodeling facilitate this transition from terminally differentiated gametes to totipotent blastomeres, but the identity of transcription factors (TF) and genomic elements regulating embryonic genome activation (EGA) are poorly defined. The timing of EGA is species-specific, e.g., the timing of murine and human EGA differ significantly. To deepen our understanding of mammalian EGA, here we profile changes in open chromatin during bovine preimplantation development. Before EGA, open chromatin is enriched for maternal TF binding, similar to that observed in humans and mice. During EGA, homeobox factor binding becomes more prevalent and requires embryonic transcription. A cross-species comparison of open chromatin during preimplantation development reveals strong similarity in the regulatory circuitry underlying bovine and human EGA compared to mouse. Moreover, TFs associated with murine EGA are not enriched in cattle or humans, indicating that cattle may be a more informative model for human preimplantation development than mice.


Conflict of interest statement

The authors declare no competing interests.

Figures
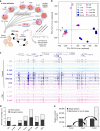
Fig. 1
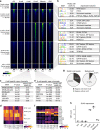
Fig. 1. Chromatin accessibility in bovine oocytes and in vitro preimplantation embryos.
a Schematic of in vitro embryo production and ATAC-seq library preparation. b Principal components analysis (PCA) of ATAC-seq signal, normalized by fragments per kilobase million (FPKM), in 500 bp windows covering the whole genome. c Normalized coverage (FPKM) of replicate ATAC-seq libraries for each stage of development. d Proportion of genome that is covered by genic and intergenic ATAC-seq peaks, called from 30 million reads for each developmental stage. e Categorization of ATAC-seq peaks in 2-, 4-, and 8-cell embryos into stage-specific and maintained peaks (accessibility maintained up until the morula stage). Maintained peaks are carried over from latter stages to show cumulative maintained peaks. Source data are provided as a Source Data file.
Fig. 2
Fig. 2. Gradual establishment of open chromatin enriched in regulatory motifs.
a Normalized ATAC-seq signal (FPKM) shown at peaks that were either unique to GV oocytes, or which were gained between consecutive developmental stages. Peaks at each stage were called from 30 million reads, and were scaled to 500 bp. b Top four de novo motifs enriched in intergenic peaks, matched to known motifs (log odds match score >0.6) of TFs that were expressed at the given stage. c Top seven known motifs enriched in 4-cell specific peaks. Binomial test p values reported. Adjustment for false discovery rate (FDR) yielded Q values less than 1e–4. d Variance stabilized transformed (VST) expression counts of TFs corresponding to enriched motifs in 4-cell specific open chromatin. e Top seven known motifs enriched in 8-cell specific peaks. Binomial test p values reported (all FDR adjusted Q values <1e–4). f VST expression counts of TFs corresponding to enriched motifs in 8-cell specific open chromatin. g Proportion of intergenic 8-cell peaks overlapping the de novo motif most closely matching the DUXA motif, relative to background. h VST expression counts of DUXA throughout development (n = 3 biologically independent samples). Boxplots indicate the median and interquartile range (IQR), and whiskers span 1.5 times the IQR. RNA-seq data from Graf et al.. Source data are provided as a Source Data file.
Fig. 3
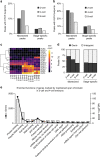
Fig. 3. Binding motif enrichment in 2-, 4-, and 8-cell ATAC-seq peaks that were either stage-specific or subsequently maintained up to morula stage. Proportion of peaks containing.
a CTCF or (b) KLF5 footprints. c VST expression profiles of KLF genes. RNA-seq data from Graf et al.. d Proportion of maintained and stage-specific peaks that were genic or intergenic. e Gene ontology term enrichment of the 9,456 genes that were marked by maintained genic open chromatin that was first established in 2- or 4-cell embryos. Top 15 terms, based on FDR, are reported. Source data are provided as a Source Data file.
Fig. 4
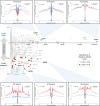
Fig. 4. Effect of transcription inhibition on chromatin remodeling.
a Transcription inhibition effect on loci that should have opened or closed between consecutive stages. Peaks called from 20 million reads per stage. b Normalized ATAC-seq signal (FPKM) in control and transcription inhibited 8-cell embryos at peaks which were gained between the 4- and 8-cell stage. Peaks scaled to 500 bp. c Normalized ATAC-seq (FPKM) and RNA-seq signal (reads per kilobase million; RPKM) in 8-cell control and TBE at the KLF4 locus. RNA-seq data from Bogliotti et al.. d Proportion of stage-specific and maintained peaks that should appear at each stage, but which fail to appear in TBE. Source data are provided as a Source Data file.
Fig. 5
Fig. 5. Differential transcription factor binding activity in 8-cell control and TBEs.
TFs marked in red demonstrated significantly reduced binding activity when embryonic transcription was inhibited (p value < 0.05; two-tailed t test). Average ATAC-seq signal around footprints is shown for select TFs, including three TFs with no significant change in binding activity (top) and three TFs with significantly reduced binding activity in TBEs (bottom). Source data are provided as a Source Data file.
Fig. 6
Fig. 6. Expression and accessibility dynamics of repeat families during bovine preimplantation development.
Boxplots indicate the median and interquartile range (IQR), and whiskers span 1.5 times the IQR. a VST normalized expression profiles of select LTR, LINE, and SINE repeat families. RNA-seq data from Graf et al.. b Enrichment of several transposable element (TE) families in ATAC-seq peaks, called from 30 million reads. Promoter peaks fell within the 2 kb region upstream of TSS. Intergenic peaks did not overlap the 2 kb regions upstream of TSS, exons, or introns (n = 3 biologically independent samples). Source data are provided as a Source Data file.
Fig. 7
Fig. 7. Activity of LTR elements during bovine preimplantation development.
a Open chromatin enrichment of LTR elements with increased accessibility in 4-cell, 8-cell, and/or morula-stage embryos, and VST expression of the same LTR elements; three replicates per stage. b ATAC-seq and RNA-seq read coverage at a highly expressed ERV1-2 repeat sequence. ATAC-seq tracks show coverage from 30 million reads per library; RNA-seq tracks show combined coverage from three replicates. TF motifs predicted from JASPAR binding motifs MA0039.3 (KLF4) and MA0712.1 (OTX2), respectively. c Average normalized ATAC-seq (FPKM) and (d) RNA-seq signal (RPKM) at MLT1A0 repeats overlapped by 8-cell intergenic open chromatin harboring DUXA motifs, predicted based on JASPAR motif MA0468.1. e Co-option of an accessible MLT1A0 element with a DUXA binding motif as an alternative promoter upstream of the C1D locus. RNA-seq data from Graf et al.. Source data are provided as a Source Data file.
Fig. 8
Fig. 8. Comparison of enriched motifs in open chromatin during cattle, human, and mouse preimplantation development.
a PCA comparing the percent of ATAC-seq peaks that contained a given TF motif for each cell type and species. b Inference of key regulatory factors during EGA in cattle, human, and mouse, based on enrichment of TF binding motifs in open chromatin and expression of the corresponding TFs. For motif enrichment, binomial test p values reported. Bovine RNA-seq data from Graf et al. human ATAC-seq and RNA-seq data from Wu et al. mouse ATAC-seq and RNA-seq from Wu et al.. Source data are provided as a Source Data file.
Fig. 9
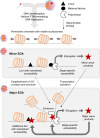
Fig. 9. Potential mechanistic model depicting events leading to major EGA.
Chromatin structure is globally decondensed following fertilization, allowing opportunistic binding of maternal factors, which initiate a minor wave of transcription and begin to establish 3-D chromatin architecture. This sets the stage for major EGA, wherein maternal products, minor EGA products, and promoter-enhancer contacts mediate the first major wave of gene expression and continue to refine 3-D chromatin structure. PTM post-translational modifications.

Similar articles

Cited by

References

    1. Abe K-I, et al. Minor zygotic gene activation is essential for mouse preimplantation development. Proc. Natl Acad. Sci. USA. 2018;115:E6780–E6788. - PMC - PubMed
    1. Ram PT, Schultz RM. Reporter gene expression in G2 of the 1-cell mouse embryo. Dev. Biol. 1993;156:552–556. - PubMed
    1. Schulz KN, Harrison MM. Mechanisms regulating zygotic genome activation. Nat. Rev. Genet. 2019;20:221–234. - PMC - PubMed
    1. Latham KE, Garrels JI, Chang C, Solter D. Quantitative analysis of protein synthesis in mouse embryos. I. Extensive reprogramming at the one- and two-cell stages. Development. 1991;112:921 LP–921932. - PubMed
    1. Eckersley-Maslin MA, Alda-Catalinas C, Reik W. Dynamics of the epigenetic landscape during the maternal-to-zygotic transition. Nat. Rev. Mol. Cell Biol. 2018;19:436–450. - PubMed

Publication types